

SUMMARY
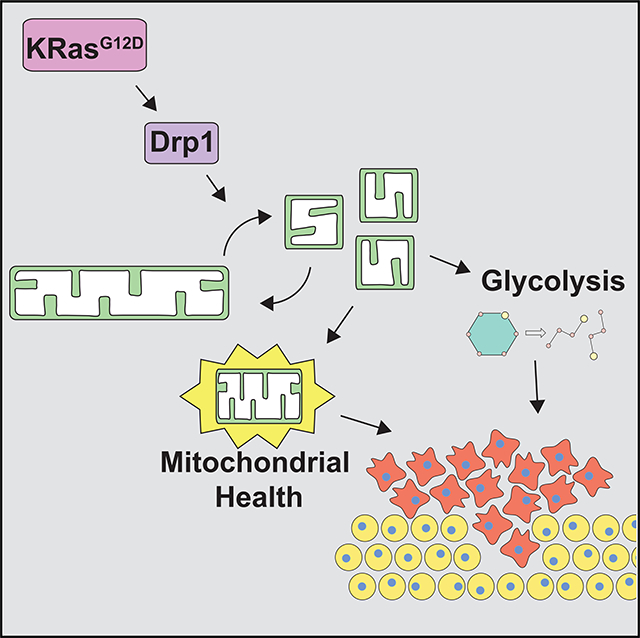
Mitochondria undergo fission and fusion to maintain homeostasis, and tumors exhibit the dysregulation of mitochondrial dynamics. We recently demonstrated that ectopic HRasG12V promotes mitochondrial fragmentation and tumor growth through Erk phosphorylation of the mitochondrial fission GTPase Dynamin-related protein 1 (Drp1). However, the role of Drp1 in the setting of endogenous oncogenic KRas remains unknown. Here, we show that Drp1 is required for KRas-driven anchorage-independent growth in fibroblasts and patient-derived pancreatic cancer cell lines, and it promotes glycolytic flux, in part through the regulation of hexokinase 2 (HK2). Furthermore, Drp1 deletion imparts a significant survival advantage in a model of KRas-driven pancreatic cancer, and tumors exhibit a strong selective pressure against complete Drp1 deletion. Rare tumors that arise in the absence of Drp1 have restored glycolysis but exhibit defective mitochondrial metabolism. This work demonstrates that Drp1 plays dual roles in KRas-driven tumor growth: supporting both glycolysis and mitochondrial function through independent mechanisms.
In Brief
Nagdas et al. find that the mitochondrial fission GTPase Drp1 is required for KRas-driven transformation and pancreatic tumor growth. The inhibition of Drp1 in cells expressing oncogenic KRas leads to impaired glycolytic flux and the eventual loss of mitochondrial metabolic function.
Graphical Abstract
INTRODUCTION
Pancreatic ductal adenocarcinoma (PDAC) is the fourth leading cause of cancer-related death in the United States (Siegel et al., 2018). With predicted increases in incidence over the next decade and a 5-year survival rate of ~8%, it is projected to be the second leading cause by 2030 (Rahib et al., 2014; Siegel et al., 2018). Up to 90% of PDAC cases harbor a mutation in the gene encoding KRas (Cox et al., 2014; Ryan et al., 2014), leading to its constitutive activation. This initiates a variety of processes that are critical for tumor growth, including proliferation, survival, and evasion of immune destruction (Hanahan and Weinberg, 2011; Pylayeva-Gupta et al., 2011). KRas and its effector pathways facilitate these processes by rewiring metabolic pathways to support the biosynthetic needs of the cancer cell and to maintain redox homeostasis (Cohen et al., 2015; Kimmelman, 2015; Pavlova and Thompson, 2016; Vander Heiden and DeBerardinis, 2017). For example, oncogenic KRas signaling induces glucose uptake and glycolysis in PDAC (Gaglio et al., 2011; Ying et al., 2012) and promotes a non-canonical use of glutamine for redox homeostasis (Son et al., 2013) and increased macropinocytosis (Commisso et al., 2013; Kamphorst et al., 2015). Furthermore, KRas-driven cancer cells use autophagy to recycle and restore tricarboxylic acid (TCA) cycle metabolic intermediates needed for both anabolic and bioenergetic processes (Guo et al., 2011; Yang et al., 2011).
Mitochondria are major hubs of metabolic regulation. We and others previously demonstrated that oncogenic Ras signaling promotes mitochondrial fragmentation through Erk2-mediated phosphorylation of the large mitochondrial fission guanosine triphosphatase (GTPase) dynamin-related protein 1 (Drp1) (Kashatus et al., 2015; Serasinghe et al., 2015). Notably, we found that the activation of Raf or mitogen-activated protein kinase kinase (MEK) was sufficient to induce mitochondrial fragmentation, even in the absence of oncogenic Ras (Kashatus et al., 2015). Furthermore, we showed that Drp1 is necessary for Ras-induced transformation and tumor growth, suggesting that Drp1-dependent mitochondrial fragmentation promotes physiological processes that are important for tumorigenesis (Kashatus et al., 2015; Serasinghe et al., 2015). Consistent with this, PDAC cell lines and patient samples with hyperactive Ras or mitogen-activated protein kinase (MAPK) signaling exhibit activated Drp1 and mitochondrial fragmentation, indicating that this pathway is active in vivo (Kashatus et al., 2015).
The link between Ras and Drp1-dependent mitochondrial fission joins a growing list of studies connecting oncogenic signaling and mitochondrial dynamics (Kashatus, 2017; Vyas et al., 2016). Shifts in the balance of mitochondrial fusion and fission affect mitochondrial function, which can have physiological consequences for tumor growth (Scatena, 2012; Vyas et al., 2016), including changes in proliferation (Kashatus et al., 2011; Qian et al., 2012), apoptosis (Martinou and Youle, 2011; Sheridan and Martin, 2010), and metabolism (Roy et al., 2015).
In this study, we sought to investigate the role of Drp1 in models of cellular transformation and pancreatic cancer driven by endogenous expression of oncogenic KRas and elevated MAPK activity. We find that Drp1 is required for KRas-mediated cell proliferation and cellular transformation in mouse embryonic fibroblasts (MEFs) and human PDAC cell lines. Mechanistically, knockdown of Drp1 results in decreased glycolytic flux in both Ras-transformed MEFs and PDAC cells. In a genetically engineered model of KRas-driven pancreatic cancer, deletion of Drp1 leads to a significant survival advantage over littermates with wild-type Drp1, and we observe a strong selective pressure against the loss of both alleles of Drp1. Tumors that ultimately arise with the complete loss of Drp1 exhibit profound metabolic reprogramming. It is not surprising that Drp1−/− tumor cells restore glycolytic metabolism, but the prolonged loss of mitochondrial fission leads to decreased mitochondrial function and decreased fatty acid utilization. These results indicate that Drp1 plays key roles in both glycolytic and oxidative metabolism in KRas-driven tumors and suggests that Drp1 inhibition may provide a therapeutic benefit to pancreatic cancer patients.
RESULTS
Drp1 Is Required for KRas-Driven Cellular Transformation
Our previous studies demonstrated that Drp1 is required for subcutaneous tumor growth driven by exogenous HRasG12V (Kashatus et al., 2015). Given the distinct biological roles of HRas and KRas and the different physiological outcomes of exogenous versus endogenous expression of Ras (DeNicola et al., 2011; Hobbs et al., 2016), we sought to determine the role of Drp1 in the setting of oncogenic KRas. To that end, we isolated MEFs from Trp53flox/flox (P), KrasLSL-G12D/+; Trp53flox/flox (KP), or KrasLSL-G12D/+; Trp53flox/flox; Drp1flox/flox (KPD) mice, treated them with adenoviral Cre to induce recombination, and isolated clonal cell lines (Figures 1A and S1A). Consistent with our observations in HRasG12V-expressing HEK cells (Kashatus et al., 2015), the expression of KRasG12D promotes a fragmented mitochondrial morphology (compare P to KP) that reverts to a more connected morphology upon deletion of Drp1 (KPD) (Figure 1B). While KP MEFs exhibit robust cellular expansion in vitro, the deletion of Drp1 reduces cell expansion to the levels of the KRasWT MEFs (Figures 1C and 1D). These effects are observed in a second independent set of clonal cell lines (Figure S1B). Furthermore, the deletion of Drp1 does not affect cell expansion in KrasWT MEFs (Figure S1C). Consistent with these effects, the deletion of Drp1 leads to a loss of KRas-induced soft agar colony formation in both sets of MEFs (Figures 1E and S1D). The re-expression of murine Drp1 in KPD MEFs restores colony formation (Figures 1F and 1G). These data demonstrate that Drp1 is necessary for KRas-driven cellular transformation and cell accumulation.
Figure 1. Drp1 Is Required for KRas-Driven Cellular Transformation.

(A) Immunoblot analysis of Drp1, p-ERK, and total ERK in indicated MEFs.
(B) Representative immunofluorescence of mitochondrial morphology in the indicated MEFs stained with Tom20 (mitochondria, green) and DAPI (nuclei, blue). Scale bars, 20 μm. Insets, mitochondria magnified.
(C and D) Cell expansion of indicated MEFs over 5 days (C) or 24 h (D) (representative result, n = 3).
(E) Soft agar growth of indicated MEFs (n = 3).
(F) Immunoblot analysis of Drp1 in indicated MEFs.
(G) Soft agar growth of indicated MEFs after 3 weeks (n = 3).
(H) Immunoblot analysis of Drp1 in indicated PDAC cell lines; doxycycline dosage was 2 μg/mL for 48 h. Quantification of densitometry relative to shCtrl cells with no doxycycline provided below blot (representative result, n = 3).
(I) Cell expansion of indicated cells over 7 days (n = 3).
(J) Soft agar growth of indicated cells after 2 weeks (n = 3).
(K) Quantification for number of colonies >0.01 mm2 from (J) relative to shCtrl (n = 3).
Drp1 Is Required for Anchorage-Independent Growth in Human PDAC Cell Lines
Next, to assess the role of Drp1 in pancreatic tumor cells, the majority of which exhibit oncogenic KRas mutations and almost invariably depend on MAPK activity, we developed a panel of patient-derived pancreatic cancer cell lines with different KRAS mutational status (Bruns et al., 1999; Deer et al., 2010; Moore et al., 2001) (Figure S1E) that express doxycycline-inducible Drp1 small hairpin RNA (shRNA) (Figures 1H and S1F). Each line has a KRas mutation at codon 12, except PDX-188t, which encodes wild-type KRas at codons 12, 13, and 61, and each of the lines exhibits high MAPK activity and is sensitive to ERK inhibition (Gysin et al., 2005; Walters et al., 2013a). Inducible knockdown of Drp1 in these cell lines reduces cell accumulation following 7 days of culture (Figures 1I, S1G, and S1H). Furthermore, each cell line exhibits decreased soft agar growth following Drp1 knockdown, and the two cell lines with the greatest degree of knockdown (188t, L3.6pL) demonstrate the most robust reduction in colony number (Figures 1J, 1K, S1I, and S1J). Consistent with MEFs, these data demonstrate that Drp1 contributes to Ras-induced cell accumulation and anchorage-independent colony formation in human cells.
Loss of Drp1 Decreases KRas-Driven Glycolytic Flux
Although a number of mechanisms could account for the requirement of Drp1 in KRas-driven transformation, we initially investigated glycolysis because despite regular media changes, the media of the KP MEFs quickly becomes acidic, while the KPD MEFs appear to maintain a more neutral pH, similar to the P cells (Figure 2A). Consistent with this, glucose-induced extracellular acidification rate (ECAR) and maximal ECAR increase in KP MEFs compared with P cells (Figures 2B and S1K). Furthermore, the deletion of Drp1 decreases both measurements, suggesting that Drp1 is required for KRas-induced increases in glycolytic flux (Figures 2B and S1K). We also observe an increase in extracellular lactate in KP MEFs compared to P MEFs, which is decreased upon Drp1 loss (Figure 2C), and KP MEFs exhibit an increased flux of 3H-glucose to 3H2O compared to P and KPD cells (Figures 2D and S1L). The re-expression of murine Drp1 in the KPD MEFs is sufficient to increase ECAR to levels seen in KP MEFs (Figure S1M).
Figure 2. Loss of Drp1 Decreases KRas-Driven Glycolytic Flux.

(A) Soft agar growth from Figure 1E to analyze media color.
(B) ECAR of indicated MEFs during a glycolysis stress test (GST). Glucose, oligomycin, and 2-deoxyglucose (2-DG) were added at the indicated time points (representative result, n = 3).
(C) Extracellular lactate of indicated MEFs (n = 3).
(D) Radiotracer flux of 3H-glucose to 3H2O in indicated MEFs (n = 3).
(E) Calculated ECAR attributable to glycolysis of the indicated 14-day doxycycline-treated PDAC cell lines (n = 4).
(F) Radiotracer flux of 3H-glucose to 3H2O of the indicated 14-day doxycycline-treated PDAC cell lines (n = 3).
To determine whether this decrease in glycolysis upon Drp1 inhibition extends to human PDAC cell lines, we repeated the analysis on 188t and L3.6pL lines. Fourteen-day knockdown of Drp1 reduces both ECAR and 3H2O production compared to controls in both cell lines, which is consistent with the MEF data (Figures 2E and 2F). These data suggest that Drp1 contributes to KRas-induced glycolytic metabolism in distinct cancer models.
Drp1 Deletion Attenuates Hexokinase II Expression and Glycolytic Flux
KRas can increase glucose flux through a variety of mechanisms, including upregulation of glucose transporters (Ying et al., 2012; Yun et al., 2009) and hexokinase activity (Patra et al., 2013). One candidate that may contribute to the Drp1-dependent glycolytic flux seen in KRas-driven cells is hexokinase-2 (HK2), which localizes to the mitochondrial outer membrane and is constitutively active in KRas-driven cancers (Patra et al., 2013; Pedersen, 2007). Notably, KRasG12D expression induces an increase in HK2 protein and mRNA levels that is decreased upon the deletion of Drp1 (Figures 3A–3C and S1N). Notably, KP MEFs also demonstrate increased levels of hypoxia-inducible factor 1-α (HIF1α), a known transcriptional regulator of HK2 (Riddle et al., 2000), and the levels are decreased in the KPD MEFs, similar to the expression pattern of HK2 (Figure 3D). These data suggest a model in which Ras-induced HK2 expression requires the Drp1-dependent stabilization of HIF1 α.
Figure 3. Drp1 Deletion Attenuates Hexokinase II Expression and Glycolytic Flux.

(A) Immunoblot analysis of HK2 and Drp1 in indicated MEFs (n = 3).
(B) Quantification of (A) (n = 3).
(C) Quantitative real-time PCR analysis of relative HK2 mRNA levels in the indicated MEFs (n = 3).
(D) Immunoblot analysis of HK2, HIF1α, and Drp1 in indicated MEFs.
(E) Immunoblot analysis of HK2, Drp1, p-ERK, and t-ERK in indicated MEFs.
(F) ECAR of the indicated MEF lines during a GST (representative result, n = 3).
(G) Soft agar growth of indicated MEFs after 3 weeks quantified for colonies >0.001 in2 (representative result, n = 3).
Stable re-expression of HK2 in KPD cells rescues ECAR to the levels observed in KP cells, suggesting that the loss of HK2 is sufficient to account for the loss of glycolytic flux (Figures 3E and 3F). Re-expression of HK2 in the KPD MEFs also partially rescues soft agar growth (Figure 3G). These data demonstrate that the Drp1-dependent regulation of HK2 is critical for the KRasG12D-induced increase in glycolytic flux and contributes to the role that Drp1 plays in KRas-driven transformation.
Loss of Drp1 Inhibits PDAC Progression
To test whether the requirement for Drp1 for KRas-induced transformation extends to an in vivo setting, we crossed KrasLSL-G12D/+; Trp53flox/flox; Pdx-1-CreERTg/+ mice (29) to mice harboring two floxed alleles of Drp1 (Wakabayashi et al., 2009) to generate KPDC mice. We injected 30 mice of each genotype (KrasLSL-G12D/+; Trp53flox/flox; Pdx-1-CreERTg/+; Drp1+/+ OR Drp1flox/flox) with tamoxifen after weaning and monitored them for tumor development. Consistent with a role for Drp1 in KRas-driven tumor growth in vivo, Drp1flox/flox mice exhibit a 45-day survival advantage compared to Drp1WT mice (Figure 4A). Notably, all KPDC mice bore moderately to poorly differentiated PDAC at endpoint, regardless of Drp1 status (Figures 4B and 4C). The masses of tumors, frequency of tumor sequelae, and overall weight gain were similar between Drp1WT and Drp1flox mice (Figures S2A–S2C).
Figure 4. Loss of Drp1 Inhibits PDAC Progression.

(A) Overall survival of Drp1WT (gray line) and Drp1flox/flox (black line) KPDC mice (n = 30 mice per group).
(B) Representative gross images of PDAC (black dashed outline) and liver metastases (white arrows).
(C) Tumor sections of indicated genotypes and stained with H&E. Scale bars, 300 μm.
(D) Drp1WT and Drp1flox/flox KPDC mice 40 days (left panel; n = 4 mice per genotype) or 60 days (right panel; n = 6 mice [Drp1WT]; 8 mice [Drp1flox/flox]) after tamoxifen injection quantified for all pancreatic lesions.
(E) Drp1 IHC of tumors. Low-magnification H&E (top row, left) and corresponding IHC images of tumor (top row, right). High-magnification IHC images from regions within tumors of the top panel (rows 2 and 4). Color-deconvoluted image of high-magnification IHC image (rows 3 and 5). Scale bars, 300 μm (rows 2–5); 2 mm (top row).
(F) Representative immunofluorescence analysis of mitochondrial morphology in pancreatic tumors harvested from Drp1WT and Drp1flox/flox mice and stained with an anti-mitochondria antibody (red) and DAPI (nuclei, blue). Insets, mitochondria magnified.
We sought to determine whether Drp1flox mice progress to adenocarcinoma slower than Drp1WT mice, which could contribute to the survival advantage we observe. PDAC is proposed to arise following progression through a series of precursor lesions, with pancreatic intraepithelial neoplasias (PanINs) most abundantly found in this KPC model (Gidekel Friedlander et al., 2009; Guerra and Barbacid, 2013). Pancreata from both Drp1flox and Drp1WT mice exhibit all subtypes of PanINs when analyzed either 40 or 60 days after tamoxifen injection (Figure S2D). Although there are no differences in lesions after 40 days, Drp1flox mice exhibit decreased PanIN3, but not PanIN1/2 lesions compared to Drp1WT mice 60 days following injection, suggesting that the loss of Drp1 impairs the progression to PanIN3 and explaining, at least in part, the survival advantage observed for the Drp1flox mice (Figure 4D).
The incomplete inhibition of PanIN development and eventual emergence of PDAC in the Drp1flox mice led us to speculate that these mice experience incomplete Drp1 excision, especially given previously described selective pressures against Drp1 knockdown in PDAC lines (Kashatus et al., 2015). To that end, we evaluated Drp1 expression by immunohistochemistry (IHC) in tumors collected at necropsy by thresholding Drp1 staining to Drp1−/− MEF− controls (Figures S2E and S2F). Drp1flox tumors exhibit regions with tumor cells that retain Drp1 expression as well as regions with a complete loss of Drp1 (Figure 4E). Although some Drp1 recombination can be detected by PCR in all of the Drp1flox tumors examined (Figure S2G), none demonstrated a complete loss of Drp1 (Figure S2H). Furthermore only 2/33 PanIN3 lesions from Drp1flox mice evaluated 60 days after injection demonstrated a complete loss of Drp1 (Figure S2I).
Consistent with our previous observations in patient PDAC specimens (Kashatus et al., 2015), mitochondria from Drp1WT tumors exhibit a highly fragmented morphology (Figure 4F). Drp1flox tumors, however, exhibit a heterogeneous morphology, with regions of both highly fragmented and more elongated mitochondria, consistent with the incomplete deletion of Drp1 (Figure 4F). These data suggest that Drp1 loss inhibits KRas-driven tumor growth in an in vivo PDAC model and that strong selective pressure against Drp1 loss leads to cells in which Drp1 excision is incomplete.
Drp1−/− Tumor Cell Lines Exhibit Metabolic Reprogramming
To further investigate the physiological changes that may occur as a consequence of or adaptation to the prolonged loss of Drp1 in vivo, we generated cell lines from Drp1WT and Drp1flox tumors. Consistent with IHC, many clones, but not all, derived from Drp1flox tumors retain one allele of Drp1 (Figure 5A). Both Drp1WT and Drp1Fl/− cell lines exhibit fragmented mitochondria, demonstrating that one allele of Drp1 is sufficient to support KRasdriven mitochondrial fragmentation (Figures 5B and 5C). Drp1−/− cell lines, however, exhibit elongated, tubular mitochondria, which is consistent with a loss of mitochondrial fission capability (Figures 5B and 5C). Drp1WT and Drp1−/− cells form tumors of comparable volume 20 days after orthotopic injection into the pancreata of immunodeficient mice (Figure 5D). Given that deletion or knockdown of Drp1 in both MEFs and PDAC cell lines impairs cell accumulation and growth in soft agar, these data suggest that the Drp1−/− tumor cells have acquired a set of physiological adaptations that allow them to overcome the loss of Drp1.
Figure 5. Drp1−/− Tumor Cell Lines Exhibit Metabolic Reprogramming.

(A) PCR on indicated cell lines; top panel detects recombination of Drp1flox allele; bottom panel detects the floxed Drp1 allele.
(B) Identical PCR reactions as in (A) and immunoblot analysis for Drp1 on indicated cell lines.
(C) Representative immunofluorescence staining of mitochondrial morphology in cells transiently transfected with mito-yellow fluorescent protein (YFP) (mitochondria, green) and stained with DAPI (nuclei, blue).
(D) Tumor mass of indicated cell lines 20 days after orthotopic injection into the pancreata of immunocompromised mice (n = 4 mice per cell line).
(E) Immunoblot analysis of HK2 and Drp1 in indicated tumor cell lines (representative result, n = 3).
(F) Radiotracer flux of 3H-glucose to 3H2O in indicated cell lines (n = 3).
(G) Principal-component analysis of metabolomics profiles for six replicates of each of the indicated cell lines.
(H) Hierarchical cluster analysis on all of the metabolites detected in (G).
(I) Topographical pathway enrichment analysis on metabolomics data from indicated cell lines.
Given the decrease in glycolytic flux upon deletion or knockdown of Drp1 in MEFs and patient-derived PDAC cell lines, we analyzed those parameters in the murine tumor-derived cell lines. Unlike MEFs, cells that have formed tumors in the absence of Drp1 express HK2 at levels comparable to those expressing Drp1 and exhibit a comparable glycolytic flux of radiolabeled glucose (Figures 5E and 5F). These data suggest that the restoration of glycolytic flux is an important adaptation to allow for tumor growth following Drp1 loss. To further test this, we analyzed glycolysis in 188t and L3.6pL under conditions of sustained Drp1 knockdown. While glycolysis is decreased 2 weeks following doxycycline induction, the levels are restored following 4 and 10 weeks (Figures S3A–S3D), which is consistent with a model in which Drp1−/− cells overcome the decrease in Drp1-mediated glycolytic flux for tumor progression to occur.
Despite a lack of glycolytic differences in Drp1 null tumor cells, the intimate relation between mitochondrial biology, dynamics, and metabolism (Roy et al., 2015; Wai and Langer, 2016; Zorzano et al., 2010) led us to interrogate additional metabolic differences between Drp1WT and Drp1−/− cells. Thus, we performed global metabolomics profiling on two Drp1WT and two Drp1−/− cell lines (Table S1). Two-dimensional principal-component analysis (PCA) reveals that each cell line clusters distinctly from one another (Figure 5G), while hierarchical clustering illustrates that each of the cell lines segregates on independent branches of a metabolite dendrogram (Figure 5H), demonstrating the expected tumor cell heterogeneity. Drp1 null cell lines cluster away from Drp1WT cells, particularly along component 1, the largest contributor of the variance (Figure 5G), suggesting that Drp1 expression contributes significantly to the global metabolic phenotype of KRas-driven tumor cells. Also, hierarchical clustering demonstrates that the two Drp1WT cell lines segregate together on an independent branch from the two Drp1−/− cell lines (Figure 5H). The heatmap demonstrates distinct classes of metabolites dysregulated between Drp1−/− and Drp1WT cells, suggesting that Drp1 loss leads to distinct metabolic reprogramming either as a direct consequence of or an adaptation to the loss of Drp1 function (Figure 5H).
We next performed pathway analyses using two independent metabolomics platforms—pathway enrichment analysis on the set of 350 metabolites significantly different between the pairwise comparison of all Drp1−/− and Drp1WT samples and topographical pathway analyses of our entire dataset identified the TCA cycle and fatty acid metabolism (i.e., glycerophospholipid) as potential top pathways that contribute to the global metabolic reprogramming occurring upon the loss of Drp1 in our KRas-driven cancer cells (Figures 5I and S4A).
Drp1−/− Tumor Cells Exhibit Impaired Fatty Acid Oxidation and Dysfunctional Mitochondrial Respiration
The levels of succinate are increased in both Drp1−/− lines compared to Drp1WT, while the levels of fumarate are decreased (Figure 6A), suggesting a defect in succinate dehydrogenase (SDH) activity. As SDH is involved in both the TCA cycle and the electron transport chain (ETC), defective SDH activity would be predicted to result in decreased activity in both. Consistent with this, the Drp1−/− cells exhibit an increased NAD+:NADH ratio compared to the Drp1WT cells (Figure 6B). Furthermore, the three Drp1−/− tumor cell lines that we tested exhibit decreased spare respiratory capacity compared to three Drp1WT lines (Figure 6C), indicating a loss in ETC function.
Figure 6. Drp1−/− Tumor Cells Exhibit Impaired Fatty Acid Oxidation and Dysfunctional Mitochondrial Respiration.

(A) Scaled abundance of indicated metabolites in indicated cell lines (n = 6 replicates per cell type).
(B) NAD+:NADH ratio calculated from metabolomics dataset in indicated cell lines. (n = 6 replicates per cell type).
(C) Calculated spare respiratory capacity oxygen consumption rate (OCR) of indicated cell lines (n = 3).
(D) Radiotracer flux of 14C-palmitate to 14CO2 (n = 3).
(E) Scaled abundance of indicated acylcarnitines of the indicated cell lines (n = 6 replicates per cell type).
(F) Scaled abundance of four phosphatidylcholine (PC) species (top row) and corresponding fatty acids (bottom row) of the indicated cell lines (n = 6 replicates per cell type).
These data suggest that sustained loss of Drp1 in these tumor cells results in mitochondrial dysfunction. We next analyzed mitochondrial function in PDAC cells expressing an inducible Drp1 shRNA. Consistent with the proposed model, 10-week knockdown of Drp1 leads to a significant decrease in maximal respiration when compared with the 4-week knockdown in both 188t and L3.6pL cells (Figure S3E).
This decrease in mitochondrial function and the identification of glycerophospholipid as a pathway altered in Drp1−/− cells prompted us to assess lipid metabolism. Consistent with diminished mitochondrial function, Drp1−/− cell lines exhibit decreased oxidation of 14C-labeled palmitate compared to Drp1WT cells (Figure 6D). Furthermore, the metabolomics data reveal that the levels of short-chain acylcarnitines (C4, C6, and C8) are increased in the Drp1−/− cells compared to the Drp1WT cells (Figure 6E). The accumulation of acylcarnitines is associated with inefficient fatty acid oxidation (Kler et al., 1991). These data suggest that mitochondrial metabolism in general and fatty acid oxidation specifically are impaired in tumor cells that have arisen in the absence of Drp1.
The apparent defects in fatty acid oxidation led us to broadly examine lipid metabolites in the tumor cells. The levels of several fatty acids and lysolipids with diverse chain length and saturation were decreased in Drp1−/− cell lines compared to Drp1WT cells (Figures 6F and S4B). Despite this, the levels of the corresponding phospholipids were not significantly different (Figures 6F and S4B). These data suggest that cells adapt to decreased mitochondrial efficiency either by storing fatty acids in the neutral lipid compartment to protect against the toxic buildup of fatty acids or, less likely, increasing the utilization of fatty acid fuels to compensate for the loss of mitochondrial efficiency. Both of these models would predict an overall decrease in the steady-state levels of free fatty acids.
Drp1−/− Tumor Cells Exhibit Impaired Fatty Acid Trafficking
To distinguish between these two models and to determine whether fatty acids are mobilized differentially in Drp1−/− tumor-derived cells compared to Drp1WT cells, we performed a pulse-chase experiment to visualize fatty acid trafficking into and out of lipid droplets using BODIPY 558/568 C12 (Red C12), a fluorescent fatty acid that traffics similar to palmitate (Figure 7A) (Rambold et al., 2015). We pulsed cells for 12 h with Red C12 and followed with a chase for 25 h. At 1 h, we observed a high degree of colocalization between the Red C12 and BODIPY 493/503, a marker for lipid droplets (LDs), in both Drp1−/− and Drp1WT cells, suggesting that both cells are able to take up and store fatty acids equivalently (Figures 7B, 7C, S5, and S6). After 13 and 25 h, we observed a decrease in the Red C12-LD colocalization in all Drp1WT cell lines but not in the Drp1−/− lines (Figures 7B, 7C, S5, and S6). These data suggest that the loss of mitochondrial function in Drp1−/− cells leads to a defect or delay in fatty acid mobilization away from LD stores. Consistent with this interpretation, the pharmacological inhibition of adipose triglyceride lipase (ATGL), an enzyme that breaks down triglycerides to mobilize fatty acids for oxidation, largely phenocopies the fatty acid mobilization defect in Drp1WT cells, but it has little or no effect on Drp1−/− cells (Figures 7B, 7C, S5, and S6).
Figure 7. Drp1−/− Tumor Cells Exhibit Impaired Fatty Acid Trafficking.

(A) Schematic of Red C12 cellular processing.
(B) Representative confocal fluorescence images of Red C12 pulse-chase over 25 h in indicated cell lines. Red C12 (fatty acids, magenta), BODIPY 493/503 (lipid droplets, green), and DAPI (nuclei, blue). Scale bars, 20 μm.
(C) Quantification using Pearson’s correlation coefficient from (B) and Figure S5. (n = 3 [128 and 109–3 lines]; n = 2 [remaining cell lines], ≥50 cells analyzed per time point per cell line).
(D) Cell expansion of indicated cell lines under specified nutrient conditions following 24 h in culture (representative result, n = 3).
The observed defect in fatty acid mobilization could either be a direct consequence of Drp1 loss or an adaptation or response to the loss in mitochondrial function observed in these cells. To distinguish between these two possibilities, we repeated the pulse-chase experiment in the MEFs. Like the tumor cell lines, each MEF line exhibits a high degree of Red C12-LD colocalization after a 1-h chase (Figure S7). However, at 25 h, KP but not P MEFs exhibit a decrease in Red C12-LD colocalization, demonstrating that KRas promotes increased fatty acid egress from LDs (Figure S7). KPD MEFs exhibit a similar degree of Red C12-LD colocalization as the KP MEFs, indicating that the loss of Drp1 in MEFs does not directly affect fatty acid trafficking (Figure S7) and suggesting the defect observed in the Drp1−/− tumor cell lines is instead a consequence of impaired mitochondrial function.
Given the defects we observe in mitochondrial metabolism and lipid oxidation, we sought to determine whether these defects reveal vulnerabilities in tumor cells that have arisen without Drp1. By seeding Drp1WT and Drp1−/− cells under a variety of nutrient conditions, we found that while removal of either glucose or glutamine had equivalent effects on cell viability, the removal of both, leaving serum as the sole source of carbon, led to a statistically significant difference in viability (Figure 7D). Notably, this was not rescued by supplementation with galactose, which can produce net ATP only through mitochondrial oxidation. Thus, these data suggest that Drp1−/− cells are more sensitive to conditions that force reliance on fatty acid oxidation and mitochondrial metabolism.
DISCUSSION
In this study, we have demonstrated that Drp1 is required for KRas-driven transformation of both murine and human cells and for KRas-driven tumor growth in a mouse model of pancreatic ductal adenocarcinoma. These findings are consistent with previous literature that has demonstrated the importance of Drp1 and mitochondrial fission in a variety of tumor models, including melanoma (Serasinghe et al., 2015; Wieder et al., 2015), lung cancer (Rehman et al., 2012), and ovarian cancer (Tanwar et al., 2016). We found that one key role for Drp1 in Ras-driven transformation is to support increased glycolysis through the maintenance of Ras-induced HK2 expression. The defects in transformation observed upon Drp1 knockout in vitro are also observed in vivo, as Drp1Fl/Fl mice exhibit fewer high-grade precursor lesions and a 45-day survival advantage over Drp1WT mice in an inducible model of PDAC. Furthermore, the frequent retention of a single allele of Drp1 in Drp1Fl/Fl mice suggests that there is selective pressure against Drp1 loss and argues strongly that Drp1 plays an important role in tumorigenesis. In the relatively rare Drp1 null tumor cells that arise in this model, the prolonged loss of mitochondrial fission results in significant mitochondrial dysfunction, which leads to specific vulnerabilities to conditions that force mitochondrial metabolism.
These findings propose a model in which Drp1 plays two key roles to support KRas-driven transformation and tumor growth. First, Drp1 supports enhanced glycolytic flux, at least in part through the maintenance of HK2 expression. Second, Drp1 supports the maintenance of mitochondrial function, presumably by promoting homeostatic fusion and fission cycles and allowing for the selective autophagy of damaged organelles. Ultimately, these dual roles for Drp1 can account for the significant survival advantage we observe in the Drp1Fl/Fl mice, as tumors in these mice necessarily arise from cells that have lost only one allele of Drp1, which will be fewer than the number of potential initiating cells in the Drp1WT mice, or from cells that have overcome the loss of glycolytic metabolism through additional genetic events.
The dual metabolic effects we observe upon Drp1 ablation in the setting of oncogenic KRas raise several important questions. First, how does Drp1 loss lead to reduced HK2 mRNA and protein? There is an increasing appreciation for the importance of mitochondria to nucleus signaling (Cardamone et al., 2018; Kotiadis et al., 2014), and we speculate that disruption of the fusion-fission balance leads to changes in specific metabolites that play a direct or indirect role in the regulation of HK2 transcription. For example, acetyl-coenzyme A (CoA) levels can affect transcription via post-translational modifications on histones and transcriptional regulators such as HIF1α (Fan et al., 2015). In addition, α-ketoglutarate (AKG) levels can modulate the activity of AKG-dependent dioxygenases, which affect transcription, including through indirect activation of HIF1α (Riddle et al., 2000; Zdzisinska et al., 2017). Consistent with this, we observe a Drp1-dependent increase in HIF1α upon the expression of oncogenic Ras in MEFs, suggesting that Drp1 may be affecting transcriptional activity through the regulation of mitochondrial metabolism. These findings also raise the intriguing possibility that this phenotype is a part of a larger transcriptional program regulated by Drp1. The lack of a complete rescue of colony formation despite the robust expression of HK2 suggests that other factors downstream of Drp1 are involved.
Second, how does the loss of mitochondrial fission lead to impaired TCA and ETC activity? We speculate that successive population doublings without fission lead to the accumulation of damage to mtDNA and/or direct oxidative damage to other macromolecules within the matrix, ultimately leading to decreased ETC function. This has been observed in a number of systems in which the fusion-fission balance has been disrupted (Meyer et al., 2017; Youle and van der Bliek, 2012). ETC dysfunction would promote additional mitochondrial damage through the generation of reactive oxygen species. In addition, the loss of Drp1 and mitochondrial fission may disrupt normal mitophagy, leading to the additional accumulation of dysfunctional mitochondria. The mitochondrial dysfunction we observe is most apparent in fatty acid utilization, in which loss of Drp1 reduces efficient fatty acid oxidation. The fact that we do not observe this defect in Drp1−/− MEFs suggests that it is a consequence of reduced mitochondrial function rather than a direct consequence of Drp1 loss. This suggests the possibility that cells slow or halt the transport of fatty acids from LDs if they are unable to be efficiently oxidized in the mitochondria. Overall, the lack of efficient fatty acid utilization and mitochondrial function has a fitness consequence as nutrient conditions that force reliance on fatty acid utilization are more detrimental to Drp1 null tumor cells.
Drp1 also regulates the fission of peroxisomes (Koch et al., 2003), organelles that catabolize very-long-chain fatty acids via β-oxidation (Smith and Aitchison, 2013). Although the assay using 14C-palmitate is specific for mitochondrial function (Wanders et al., 2001), it is likely that impaired peroxisomal fission and subsequent peroxisomal dysfunction also contribute to the defects in lipid metabolism observed in Drp1 null tumor cells.
Ultimately, our work suggests that the inhibition of Drp1 in cancer may have therapeutic value, either as a single agent or in combination with other approaches. For instance, an approach that targets Drp1 along with mitochondrial function (e.g., ETC inhibitors, uncouplers) or fatty acid oxidation (carnitine palmitoyltransferase [CPT] inhibitors) may have particular value, given the vulnerability we identified in Drp1 null tumor cells. Although clinically useful pharmacologic inhibitors of Drp1 are not yet available, this work provides important rationale for the further development of these agents or the identification and development of available compounds that indirectly affect Drp1 or mitochondrial morphology.
STAR★METHODS
Detailed methods are provided in the online version of this paper and include the following:
LEAD CONTACT AND MATERIALS AVAILABILITY
Further information and requests for resources and reagents should be directed to and will be fulfilled by the Lead Contact, David Kashatus (kashatus@virginia.edu).
EXPERIMENTAL MODEL AND SUBJECT DETAILS
Mouse Strains and Tamoxifen Injections
LSL-KRasG12D/+; TP53flox/flox mice (Jackson et al., 2005) were provided by Dr. Kwon Park (University of Virginia), and Pdx1-Cre-ER™ mice were purchased from Jackson Laboratory. These three lines were intercrossed along with Drp1flox/flox mice (Wakabayashi et al., 2009) to produce LSL-KRasG12D/+; TP53flox/flox; Drp1flox/flox; Pdx1-Cre-ER™ or LSL-KRasG12D/+; TP53flox/flox; Drp1WT; Pdx1-Cre-ER™ (KPDC) mice for subsequent studies. Mice from independent litters were analyzed to control for mixed background effects. Mice were enrolled independently of sex. The primers used for genotyping were previously described (Gidekel Friedlander et al., 2009; Wakabayashi et al., 2009).
Mice (of either sex) with the desired genotypes were treated with tamoxifen on postnatal days 22, 24, and 26 by intraperitoneal injection (IP) of 9mg/40 g body weight in corn oil. In accordance with institutional guidelines, mice were monitored and euthanized when mice reached pre-determined endpoints or exhibited features associated with disease such as weight loss. All animal studies and procedures were approved by the University of Virginia Institutional Animal Care and Use Committee.
Generation of Mouse Embryonic Fibroblasts and Tumor-Derived Cell Lines
To generate clonal MEFs, we isolated E13.5-E14.5 aged embryos, removed fetal heart and liver structures, and digested remaining tissue both mechanically and enzymatically with 0.1% Trypsin (GIBCO) for 5 minutes at 37°C. Cell suspension from digested tissue was cultured overnight in DMEM supplemented with 10% FBS. Adherent cells were serially diluted and plated in 96-well plates. Single cell clones were identified and expanded.
To generate the tumor-derived cell lines, a ~ 10mm3 tumor piece was isolated at necropsy. The tumor was mechanically and enzymatically digested with 2mg/mL Collagenase (MP Biomedical) in DMEM supplemented with 10% FBS for 30 minutes at 37°C. All tumor tissues were cultured overnight in DMEM supplemented with 10% FBS. Adherent cells were isolated, serially diluted, and plated in 96-well plates. Single cell clones were identified and expanded.
Generation of Doxycycline Inducible Patient-Derived Cell Lines
PDAC tumor sample MAD 12–188 (cell line 188t) was generated from remnant human tumor surgical pathology specimens collected with assistance from the University of Virginia Biorepository and Tissue Research Facility and with the approval of the University of Virginia Institutional Review Board for Health Sciences Research following informed written consent from each patient as previously described (Walters et al., 2013b). Cell lines were authenticated by the University of Virginia Biomolecular Research Facility.
To generate doxycycline inducible cell lines, the following plasmids were sequentially and stably introduced to the cells: 1) pLenti CMV TetR Blast (Addgene Plasmid 17492) (Campeau et al., 2009) 2) pSuperior-Retro-Puro with shRNAs against Drp1 OR scramble-control (Kashatus et al., 2015).
METHOD DETAILS
Histology and Immunohistochemistry
Entire pancreata were isolated from euthanized mice and fixed in 10% buffered formalin (Fisher Scientific) and embedded in paraffin. For pancreata dedicated to our PanIN investigation arm, 3 serial sections were cut at approximately 100 μm, 300 μm, and 500 μm of depth. Formalin-fixed paraffin-embedded (FFPE) tissue sections were cut at 4–5 μm thick intervals. One section of each set of serial sections was stained with routine hematoxylin and eosin stain (H&E), with the other sections dedicated for immunohistochemistry for Drp1 or mitochondrial immunofluorescence. Antigen retrieval and deparaffinization were performed in PT Link (Dako, Glostrup, Denmark) using low pH for DRP1 and high pH, EnVision FLEX Target Retrieval Solution (Dako) for 20 min at 97°C. Immunohistochemistry was performed on a robotic platform (Autostainer, Dako). Endogenous peroxidases were blocked with peroxidase and alkaline Phosphatase blocking reagent (Dako) before incubating the sections with respective antibodies. Antibodies for DRP1 (Ab184247) was purchased from Abcam. Antibodies were used at the following concentrations: DRP1,1: 1,000 for 30 min at room temperature. Antigen–antibody complex was detected using Envision™ Dual Link (Dako) followed by incubation with 3,3′-diaminobenzidine tetrahydrochloride (DAB+) chromogen (Dako). All the slides were counterstained with hematoxylin subsequently; they were dehydrated, cleared, and mounted for the assessment.
PanIN Histologic Analyses
Slides were digitally scanned using an Aperio ScanScope (SC System) with a 20 × objective to obtain digital slides. Using the ImageScope (Leica Biosystems) “Annotations” tool, individual PanIN and PDAC lesions and lymph nodes were traced by hand and area was determined from H&E stained slides. H&E stained pancreatic sections were deconvoluted using Fiji/ImageJ’s code and the hematoxylin image was used to determine total tissue area. The area of the lymph node traces were subtracted to determine total pancreatic parenchyma area. Three sections per mouse pancreas was analyzed for pancreatic lesion determination.
Cell Culture
All murine cells were maintained in Dulbecco’s Modified Eagle Medium (DMEM – Life Technologies) supplemented with 10% Fetal Bovine Serum (FBS – Life Technologies) and 100 units per ml penicillin, and 100 μg/ml streptomycin (pen/strep) (Life Technologies). All human pancreatic cancer cells were maintained in RPMI 1640 (Life Technologies) supplemented with 10% FBS and 100 units per ml penicillin, and 100 μg/ml streptomycin (pen/strep) (Life Technologies).
Nutrient-defined media (Figure 7D) was made in DMEM (Life Technologies, A14430) and supplemented with 5% FBS, 4mM L-Glutamine (Life Technologies), 5mM D- glucose (Fisher chemicals) or 25mM D-galactose (BD) as indicated. Viable cell numbers were determined by cell counting (Figure 1C), using the CellTiter-Glo Luminescent Cell Viability assay according to manufacturer protocol (Promega - Figures 1D and7D), or using the CyQUANT Cell Proliferation Assay according to manufacturer protocol (ThermoFisher- Figure 1I). Each cell counting experiment was initially seeded at equal numbers in technical duplicate to triplicate per independent experiment.
Genotyping of Murine Tumor-Derived Cell Lines
Cells were harvested from culture plates and centrifuged at 1,000RPM for 5 minutes at 4°C. Cell pellets were resuspended in 200 μL DNA Lysis Buffer and incubated at 55°C for at least 1 hour. The lysate was incubated with 95 μL 5M NaCl to precipitate proteins and centrifuged at 3,000RPM for 15 minutes at 4°C. DNA was precipitated with isopropanol, resuspended in water, and used for genotyping analysis as previously described (Gidekel Friedlander et al., 2009; Wakabayashi et al., 2009).
Genotyping of Patient-Derived Cell Lines
DNA was isolated from cells in culture as described above. Regions of KRAS exons 2 and 3 were PCR amplified using previously published primers (Singhi et al., 2014) and Phusion HF DNA Polymerase (NEB). PCR products were gel purified using a PureLInk Quick Gel Extraction Kit (Invitrogen) and sent for sequencing (Eurofins Genomics).
Western Blotting
Whole cell lysates were prepared in RIPA buffer and equivalent protein amounts (generally 50 μg) were resolved by SDS-Page. Gels were transferred to PVDF membranes and immunoblotted with the indicated antibodies. List of antibodies used in this study: α-Drp1 (Abcam), α-Erk1/2, α-pT202/Y204Erk 1/2, α-HK2, α-HIF1α, α-Tubulin, α-Actin, α-GAPDH (Cell Signaling Technologies).
Mitochondrial Stress Test / Glycolysis Stress Test
Oxygen Consumption Rate (OCR) for Mitochondrial Stress Test (MST) assays and Extracellular Acidification Rate (ECAR) for Glycolysis Stress Test (GST) assays were measured using a Seahorse XF24 Extracellular Flux Analyzer. GST media was made using serum-free DMEM without glucose, glutamine, pyruvate, sodium bicarbonate (Sigma-Aldrich) adjusted to pH 7.4. The day before the experiment, the 24-well cell culture microplates were coated with 50 μL of poly-D-lysine (Millipore) at 10 μg/cm2/sterile water. The following morning, the plate was washed once with 200 μL of PBS and allowed to air dry. For MEFs, 40,000 cells were plated in at least triplicate for each condition the day of the experiment in 100 μL of GST media per well for GST assay and 100 μL per well in unbuffered, serum-free DMEM adjusted to pH 7.4 (MST media) for the MST assay. Cells were then spun at 500 RPM for 1 min and supplemented with 575 μL of GST media or MST media and immediately placed into seahorse analyzer to begin assay. For murine tumor cells and human inducible cells, 125,000 and 100,000 cells, respectively, were plated in at least duplicate (seeded in triplicate most frequently) the day of the experiment in native media (supplemented with doxycycline for the human inducible cells), spun at 500 RPM for 1 min, and allowed to adhere for 2.5 hours. Native media was then aspirated off, cells were washed with PBS, 675 μL of GST or MST media was added, and the assay was started. During the GST assay, glucose (BD), oligomycin (Millipore) and 2-deoxyglucose (Chem-Impex) were injected to a final concentration of 10mM, 2 μM and 100mM, respectively. For the MST assay, oligomycin, BAM15 (Cayman) and Rotenone and Antimycin A (Sigma) were injected to a final concentration of 2 μM, 10 μM, 1 μM and 2μM, respectively. At the end of each experiment, each assay was normalized to cell number counted from a sister plate that was seeded concurrently with the experimental plate.
Radiotracer Metabolic Flux Studies/Substrate Competition Assay
Cells were harvested from culture the day of assay and the cells (275,000 murine tumor cells) were seeded per well in triplicate in a 24-well plate in DMEM supplemented with 10% FBS. After 3 hours, the cells were washed 1 × in PBS. For the murine tumor cells, the KRP assay media with 5mM glucose, 50 μM acetate, 0.5mM glutamine, 1mM carnitine, and 125 μM palmitate supplemented with either 3H-glucose (Perkin Elmer) for glycolysis determination or 14C-Palmitate (Perkin Elmer) for oxidative metabolism determination was applied. In wells used to investigate oxidative metabolism, a CO2 trap with 2M NaOH, was placed in the wells. The wells were sealed and cells were incubated for 2 hours.
For evaluation of glycolysis, 1N HCl was added to the wells with 3H-glucose and all the liquid was collected into an Eppendorf tube. The tube was placed in a scintillation vial containing an equivalent volume of water and allowed to equilibrate overnight. After equilibration, scintillation cocktail fluid was mixed (Optiphase Super, Perkin Elmer) and vials were counted on a scintillation counter (LS6500, Beckman Coulter).
For determination of oxidative metabolism, the assay media and CO2 trap was transferred to new wells and sealed. 2M perchloric acid was injected into each sealed well, resealed, and allowed to incubate at room temperature for 1 hour. After incubation, the NaOH was transferred into scintillation vials, scintillation cocktail fluid was mixed and vials were counted on a scintillation counter.
For the MEFs and inducible human PDAC cells, cells were harvested from culture the day of assay and the cells (125,000 MEFs or 200,000 inducible human cells) were seeded per well in triplicate in a 24-well plate in DMEM (MEFs) or RPMI (inducible human) supplemented with 10% FBS. After 3 hours of incubation, the cells were washed 1 × in PBS. GST media was then added and allowed to incubate for 30 minutes. Then, GST media with 10mM glucose with either 3H-glucose (Perkin Elmer) for glycolysis determination or 14C-glucose (Perkin Elmer) for oxidative metabolism was supplemented, applied to the wells, and incubated in sealed wells for 1 hour.
ATP Generation Assay
ATP levels were determined using the CellTiter-Glo Luminescent Cell Viability assay (Promega).
Lactate Generation Assay
Lactate levels were determined using the Lactate-Glo Luminescent assay (Promega). For lactate assessment in Figure 2C, equal numbers of the indicated MEFs were seeded in a 96-well plate and incubated in GST media. A bolus of 5mM glucose was added and lactate was measured after 30 minutes per manufacturer protocol.
Mitochondrial Immunofluorescence
The mitochondria of the MEFs and tumor-derived cell lines used in these studies were visualized as previously described (Kashatus et al., 2015). Immunofluorescence on FFPE sections was performed as previously described and mitochondria were stained using anti-Mitochondria antibody, clone 113–1, Cy3 conjugate (EMD Millipore) (Wang et al., 2014).
Soft Agar Colony Formation Assay
Soft agar assay was performed as described previously described (Borowicz et al., 2014). MEFs were seeded in DMEM soft agar while human PDAC cells were seeded in RPMI soft agar. Colonies were imaged using BioRad ChemiDoc Imaging System (MEFs) or Alpha Innotech FluorChem SP imager (PDAC) and quantified using ImageJ.
Metabolomics
Metabolomics analyses (Table S1) were performed by Metabolon, Inc. (Durham, North Carolina, USA) as previously described. Tumor derived cell lines were grown to 70% confluence in 15cm dishes, with a fresh media change 1 day before harvest. Cells were recovered by trypsinization. The cell pellets were washed once in PBS then pelleted again, removing all supernatant before flash freezing 100 μL packed cell pellets for shipment. Proteins were precipitated with methanol under vigorous shaking for 2 minutes followed by centrifugation. The resulting extract was divided into four fractions: two for analysis by two separate reverse phase (RP)/UPLC-MS/MS methods with positive ion mode electrospray ionization (ESI), one for analysis by RP/UPLC-MS/MS with negative ion mode ESI, and one for analysis by HILIC/UPLC-MS/MS with negative ion mode ESI. Instrument variability was determined to be 3% by calculating the median relative standard deviation (RSD) for the quality control standards that were added to each sample prior to injection into the mass spectrometers. Overall process variability was determined to be 9% by calculating the median RSD for all endogenous metabolites (i.e., non-instrument standards) present in 100% of the pooled matrix samples. Experimental samples were randomized across the platform run with QC samples spaced evenly among the injections.
Raw data were extracted, peak-identified and QC processed using Metabolon’s hardware and software. Compounds were identified by comparison to library entries of purified standards or recurrent unknown entities. Metabolon maintains a library based on authenticated standards that contain the retention time/index (RI), mass to charge ratio (m/z), and chromatographic data (including MS/MS spectral data) on all molecules present in the library. Peaks were quantified using area-under-the-curve. Data were normalized to total protein as determined by Bradford assay to account for differences in metabolite levels due to differences in the amount of material present in each sample.
Preliminary bioinformatics analysis and pathway analysis on the four cell lines for Figures 5G–5I was performed using Metabolon software and MetaboAnalyst (Xia and Wishart, 2010), a web-based platform for processing metabolomics data (https://www.metaboanalyst.ca/).
Orthotopic Xenografts
Orthotopic xenografts of the murine tumor-derived cells were performed as previously described (Walters et al., 2013b).
Real-Time PCR
Cells were harvested from culture and total RNA was extracted using TRIzol reagent (Life Technologies) per manufacturer’s protocol. Samples were treated with DNase I (New England Biolabs), inactivated, and RNA concentration and quality was measured (NanoDrop). 1 μg RNA per sample was reversed-transcribed (iScript cDNA synthesis kit, BioRad). Real-time PCR was performed on the Applied Biosystems StepOnePlus Real- Time PCR System using Power SYBR green (Life Technologies) detection chemistry. ΔΔCt was calculated for each sample reaction using UbC and ActB genes as housekeeping controls. The primers used are listed below. The real-time PCR conditions were 95°C for 2 min, followed by 40 cycles of 95°C for 5 s and 65°C for 30 s. After the last PCR cycle, each sample was subject to thermal melting curve analysis to check for non-specific product formation.
HK2 (Shi et al., 2011)
Forward: 5′-TGATCGCCTGCTTATTCACGG-3′
Reverse: 5′-AACCGCCTAGAAATCTCCAGA-3′
ActB (Yan et al., 2016)
Forward: 5′-TGACGTTGACATCCGTAAAG-3′
Reverse: 5′-GAGGAGCAATGATCTTGATCT-3′
Ubc (Yan et al., 2016)
Forward: 5′-GCCCAGTGTTACCACCAAGA-3′
Reverse: 5′-CCCATCACACCCAAGAACA-3′
Fatty Acid Pulse Chase Assay
Red C12 experimental methods were performed similar to what was described previously (Rambold et al., 2015). Atglistatin (Sigma) was added, where indicated, at 10uM concentration for the duration of assay. Images were taken using the Zeiss 710 Confocal Microscope.
QUANTIFICATION AND STATISTICAL ANALYSIS
GraphPad Prism (Version 7) was used for graphical representation and statistical analysis of data. Data are presented as mean ± SEM. The following statistical analyses were applied to experiments as described in figure legends: unpaired two-sided Student’s T–test, one-way ANOVA with Tukey’s multiple comparison, two-way ANOVA with Tukey’s multiple comparison (Figure 4D only), log-rank (Mantel-Cox) test (Figure 4A only). Cell lines were grouped by genotype for statistical analyses for Figures 3B, 6B, 6C, 6D, 7C, and 7D. Statistical significance is denoted in figures as *p < 0.05, **p < 0.01, ***p < 0.001, and ****p < 0.0001.
DATA AND CODE AVAILABILITY
Further information about the data may be directed to and will be fulfilled by the corresponding author David Kashatus (kashatus@virginia.edu). Raw metabolomics data can be found in Table S1.
Supplementary Material
KEY RESOURCES TABLE.
| REAGENT or RESOURCE | SOURCE | IDENTIFIER |
|---|---|---|
| Antibodies | ||
| Drp1 | Abcam | Ab184247 |
| p44/42 MAPK (Erk 1/2) | Cell Signaling Technology | CST-9102; RRID: AB_330744 |
| phospho-p44/42 MAPK (Erk 1/2) T202/Y204 | Cell Signaling Technology | CST-9101; RRID: AB_331646 |
| HK2 (C64G5) | Cell Signaling Technology | CST-2867; RRID: AB_2232946 |
| Hif1α | Cell Signaling Technology | CST-3716; RRID: AB_2116962 |
| β-Tubulin (9F3) | Cell Signaling Technology | CST-2128; RRID: AB_823664 |
| β-Actin (D6AB) | Cell Signaling Technology | CST-8457; RRID: AB_10950489 |
| GAPDH (D16H11) | Cell Signaling Technology | CST-5174; RRID: AB_10622025 |
| anti-Mitochondria antibody (clone 113–1, Cy3 conjugate) | EMD Millipore | MAB1273C3; RRID: AB_2631100 |
| Biological Samples | ||
| Patient-derived xenografts (PDX) | Walters et al., 2013b | N/A |
| Chemicals | ||
| Atglistatin | Sigma | SML1075 |
| Glucose, D-[3-3H] | Perkin-Elmer | NET331C001MC |
| Glucose, D-[14C (U)] | Perkin-Elmer | NEC042X250UC |
| oligomycin | Millipore | 495455 |
| 2-deoxyglucose | Chem-Impex | 21916 |
| BAM15 | Cayman | 17811 |
| Rotenone | Sigma | R8875 |
| Antimycin A | Sigma | A8674 |
| Phusion HF DNA Polymerase | New England Biolabs | M0530 |
| EnVision FLEX Target Retrieval Solution | Dako, Glostrup, Denmark | GV80411–2 (Agilent) |
| 3,3′-diaminobenzidine tetrahydrochloride (DAB+) chromogen | Dako, Glostrup, Denmark | GV82511–2 (Agilent) |
| Critical Commercial Assays | ||
| CellTiter-Glo Luminescent Cell Viability assay | Promega | G7572 |
| CyQUANT Cell Proliferation Assay | ThermoFisher | C7026 |
| Mitochondrial Stress Test | Seahorse Biosciences | 103015–100 |
| Glycolysis Stress Test | Seahorse Biosciences | 103020–100 |
| Lactate-Glo Luminescent assay | Promega | J5021 |
| Experimental Models: Cell Lines | ||
| PDX 188t | Walters et al., 2013b | N/A |
| PDX 395t | Walters et al., 2013b | N/A |
| L3.6pL | Bruns et al., 1999 | Gift from Dr. Kim Kelly |
| CFPac | Moore et al., 2001 | Gift from Dr. Kim Kelly |
| 109, 123, 128, 132, 143, 145, 253, 410, 650 (+ clones) | This Paper | N/A |
| P.1, KP.1, KPD.1, P.2, KP.2, KPD.2 | This Paper | N/A |
| Experimental Models: Organisms/Strains | ||
| LSL-KRasG12D/+; TP53flox/flox | Jackson et al., 2005 | Gift of Kwon Park |
| Pdx1-Cre-ERTM | Gidekel Friedlander et al., 2009 | Jackson Laboratory |
| Drp1flox/flox | Wakabayashi et al., 2009 | N/A |
| Oligonucleotides | ||
| HK2 Forward: 5′-TGATCGCCTGCTTATTCACGG-3′ | Shi et al., 2011 | N/A |
| HK2 Reverse: 5′-AACCGCCTAGAAATCTCCAGA-3′ | Shi et al., 2011 | N/A |
| ActB Forward: 5′-TGACGTTGACATCCGTAAAG-3′ | Yan et al., 2016 | N/A |
| ActB Reverse: 5′-GAGGAGCAATGATCTTGATCT-3′ | Yan et al., 2016 | N/A |
| Ubc Forward: 5′-GCCCAGTGTTACCACCAAGA-3′ | Yan et al., 2016 | N/A |
| Ubc Reverse: 5′-CCCATCACACCCAAGAACA-3′ | Yan et al., 2016 | N/A |
| Recombinant DNA | ||
| pLenti CMV TetR Blast | Campeau et al., 2009 | Addgene #17492 |
| pSuperior-Retro-Puro-scramble | Kashatus et al., 2015 | N/A |
| pSuperior-Retro-Puro-shDrp1 | Kashatus et al., 2015 | Addgene #99385 |
| Software and Algorithms | ||
| ImageScope Annotations tool | Leica Biosystems | https://www.leicabiosystems.com/digital-pathology/manage/aperio-imagescope/ |
Highlights.
Drp1 is required for oncogenic KRas-driven transformation
Drp1 promotes KRas-driven glycolysis
Loss of Drp1 inhibits pancreatic tumorigenesis
Loss of Drp1 impairs mitochondrial metabolism in tumor cells
ACKNOWLEDGMENTS
We thank K. Hoehn, F. Byrne, S. Hargett, S. Lahiri, and L. Werner for assistance with the metabolic studies; A. Schinlever for assistance with the mouse tumor model; V. Anjutgi for assistance with the inducible human model; K. Park for the KP mice; S. Criswell and the UVA Advanced Microscopy Facility for assistance with imaging; M. Carroll, P. Pramoonjago, and the UVA Biorepository and Tissue Research Facility, as well as S. VanHoose and the UVA Research Histology Core, for assistance with immunohistochemistry; K. Kelly for the pancreatic cancer cell lines; and J. Luster and Metabolon for assistance with the metabolomics analysis. This paper was supported by NIH grants CA200755 (to D.F.K.) and GM123266 (to H.S.).
Footnotes
DECLARATION OF INTERESTS
The authors declare no competing interests.
SUPPLEMENTAL INFORMATION
Supplemental Information can be found online at https://doi.org/10.1016/j.celrep.2019.07.031.
REFERENCES
- Borowicz S, Van Scoyk M, Avasarala S, Karuppusamy Rathinam MK, Tauler J, Bikkavilli RK, and Winn RA (2014). The soft agar colony formation assay. J. Vis. Exp 92, e51998. [DOI] [PMC free article] [PubMed] [Google Scholar]
- Bruns CJ, Harbison MT, Kuniyasu H, Eue I, and Fidler IJ (1999). In vivo selection and characterization of metastatic variants from human pancreatic adenocarcinoma by using orthotopic implantation in nude mice. Neoplasia 1, 50–62. [DOI] [PMC free article] [PubMed] [Google Scholar]
- Campeau E, Ruhl VE, Rodier F, Smith CL, Rahmberg BL, Fuss JO, Campisi J, Yaswen P, Cooper PK, and Kaufman PD (2009). A versatile viral system for expression and depletion of proteins in mammalian cells. PLoS One 4, e6529. [DOI] [PMC free article] [PubMed] [Google Scholar]
- Cardamone MD, Tanasa B, Cederquist CT, Huang J, Mahdaviani K, Li W, Rosenfeld MG, Liesa M, and Perissi V (2018). Mitochondrial Retrograde Signaling in Mammals Is Mediated by the Transcriptional Cofactor GPS2 via Direct Mitochondria-to-Nucleus Translocation. Mol. Cell 69, 757–772.e7. [DOI] [PMC free article] [PubMed] [Google Scholar]
- Cohen R, Neuzillet C, Tijeras-Raballand A, Faivre S, de Gramont A, and Raymond E (2015). Targeting cancer cell metabolism in pancreatic adenocarcinoma. Oncotarget 6, 16832–16847. [DOI] [PMC free article] [PubMed] [Google Scholar]
- Commisso C, Davidson SM, Soydaner-Azeloglu RG, Parker SJ, Kamphorst JJ, Hackett S, Grabocka E, Nofal M, Drebin JA, Thompson CB, et al. (2013). Macropinocytosis of protein is an amino acid supply route in Ras-transformed cells. Nature 497, 633–637. [DOI] [PMC free article] [PubMed] [Google Scholar]
- Cox AD, Fesik SW, Kimmelman AC, Luo J, and Der CJ (2014). Drugging the undruggable RAS: Mission possible? Nat. Rev. Drug Discov 13, 828–851. [DOI] [PMC free article] [PubMed] [Google Scholar]
- Deer EL, González-Hernández J, Coursen JD, Shea JE, Ngatia J, Scaife CL, Firpo MA, and Mulvihill SJ (2010). Phenotype and genotype of pancreatic cancer cell lines. Pancreas 39, 425–435. [DOI] [PMC free article] [PubMed] [Google Scholar]
- DeNicola GM, Karreth FA, Humpton TJ, Gopinathan A, Wei C, Frese K, Mangal D, Yu KH, Yeo CJ, Calhoun ES, et al. (2011). Oncogene-induced Nrf2 transcription promotes ROS detoxification and tumorigenesis. Nature 475, 106–109. [DOI] [PMC free article] [PubMed] [Google Scholar]
- Fan J, Krautkramer KA, Feldman JL, and Denu JM (2015). Metabolic regulation of histone post-translational modifications. ACS Chem. Biol 10, 95–108. [DOI] [PMC free article] [PubMed] [Google Scholar]
- Gaglio D, Metallo CM, Gameiro PA, Hiller K, Danna LS, Balestrieri C, Alberghina L, Stephanopoulos G, and Chiaradonna F (2011). Oncogenic K-Ras decouples glucose and glutamine metabolism to support cancer cell growth. Mol. Syst. Biol 7, 523. [DOI] [PMC free article] [PubMed] [Google Scholar]
- Gidekel Friedlander SY, Chu GC, Snyder EL, Girnius N, Dibelius G, Crowley D, Vasile E, DePinho RA, and Jacks T (2009). Context-dependent transformation of adult pancreatic cells by oncogenic K-Ras. Cancer Cell 16, 379–389. [DOI] [PMC free article] [PubMed] [Google Scholar]
- Guerra C, and Barbacid M (2013). Genetically engineered mouse models of pancreatic adenocarcinoma. Mol. Oncol 7, 232–247. [DOI] [PMC free article] [PubMed] [Google Scholar]
- Guo JY, Chen H-Y, Mathew R, Fan J, Strohecker AM, Karsli-Uzunbas G, Kamphorst JJ, Chen G, Lemons JMS, Karantza V, et al. (2011). Activated Ras requires autophagy to maintain oxidative metabolism and tumorigenesis. Genes Dev. 25, 460–470. [DOI] [PMC free article] [PubMed] [Google Scholar]
- Gysin S, Rickert P, Kastury K, and McMahon M (2005). Analysis of genomic DNA alterations and mRNA expression patterns in a panel of human pancreatic cancer cell lines. Genes Chromosomes Cancer 44, 37–51. [DOI] [PubMed] [Google Scholar]
- Hanahan D, and Weinberg RA (2011). Hallmarks of cancer: the next generation. Cell 144, 646–674. [DOI] [PubMed] [Google Scholar]
- Hobbs GA, Der CJ, and Rossman KL (2016). RAS isoforms and mutations in cancer at a glance. J. Cell Sci 129, 1287–1292. [DOI] [PMC free article] [PubMed] [Google Scholar]
- Jackson EL, Olive KP, Tuveson DA, Bronson R, Crowley D, Brown M, and Jacks T (2005). The differential effects of mutant p53 alleles on advanced murine lung cancer. Cancer Res. 65, 10280–10288. [DOI] [PubMed] [Google Scholar]
- Kamphorst JJ, Nofal M, Commisso C, Hackett SR, Lu W, Grabocka E, Vander Heiden MG, Miller G, Drebin JA, Bar-Sagi D, et al. (2015). Human pancreatic cancer tumors are nutrient poor and tumor cells actively scavenge extracellular protein. Cancer Res. 75, 544–553. [DOI] [PMC free article] [PubMed] [Google Scholar]
- Kashatus DF (2017). The regulation of tumor cell physiology by mitochondrial dynamics. Biochem. Biophys. Res. Commun 500, 9–16. [DOI] [PMC free article] [PubMed] [Google Scholar]
- Kashatus DF, Lim K-H, Brady DC, Pershing NLK, Cox AD, and Counter CM (2011). RALA and RALBP1 regulate mitochondrial fission at mitosis. Nat. Cell Biol 13, 1108–1115. [DOI] [PMC free article] [PubMed] [Google Scholar]
- Kashatus JA, Nascimento A, Myers LJ, Sher A, Byrne FL, Hoehn KL, Counter CM, and Kashatus DF (2015). Erk2 phosphorylation of Drp1 promotes mitochondrial fission and MAPK-driven tumor growth. Mol. Cell 57, 537–551. [DOI] [PMC free article] [PubMed] [Google Scholar]
- Kimmelman AC (2015). Metabolic Dependencies in RAS-Driven Cancers. Clin. Cancer Res 21, 1828–1834. [DOI] [PMC free article] [PubMed] [Google Scholar]
- Kler RS, Jackson S, Bartlett K, Bindoff LA, Eaton S, Pourfarzam M, Frerman FE, Goodman SI, Watmough NJ, and Turnbull DM (1991). Quantitation of acyl-CoA and acylcarnitine esters accumulated during abnormal mitochondrial fatty acid oxidation. J. Biol. Chem 266, 22932–22938. [PubMed] [Google Scholar]
- Koch A, Thiemann M, Grabenbauer M, Yoon Y, McNiven MA, and Schrader M (2003). Dynamin-like protein 1 is involved in peroxisomal fission. J. Biol. Chem 278, 8597–8605. [DOI] [PubMed] [Google Scholar]
- Kotiadis VN, Duchen MR, and Osellame LD (2014). Mitochondrial quality control and communications with the nucleus are important in maintaining mitochondrial function and cell health. Biochim. Biophys. Acta 1840, 1254–1265. [DOI] [PMC free article] [PubMed] [Google Scholar]
- Martinou J-C, and Youle RJ (2011). Mitochondria in apoptosis: Bcl-2 family members and mitochondrial dynamics. Dev. Cell 21, 92–101. [DOI] [PMC free article] [PubMed] [Google Scholar]
- Meyer JN, Leuthner TC, and Luz AL (2017). Mitochondrial fusion, fission, and mitochondrial toxicity. Toxicology 391, 42–53. [DOI] [PMC free article] [PubMed] [Google Scholar]
- Moore PS, Sipos B, Orlandini S, Sorio C, Real FX, Lemoine NR, Gress T, Bassi C, Klöppel G, Kalthoff H, et al. (2001). Genetic profile of 22 pancreatic carcinoma cell lines. Analysis of K-ras, p53, p16 and DPC4/Smad4. Virchows Arch. 439, 798–802. [DOI] [PubMed] [Google Scholar]
- Patra KC, Wang Q, Bhaskar PT, Miller L, Wang Z, Wheaton W, Chandel N, Laakso M, Muller WJ, Allen EL, et al. (2013). Hexokinase 2 is required for tumor initiation and maintenance and its systemic deletion is therapeutic in mouse models of cancer. Cancer Cell 24, 213–228. [DOI] [PMC free article] [PubMed] [Google Scholar]
- Pavlova NN, and Thompson CB (2016). The Emerging Hallmarks of Cancer Metabolism. Cell Metab. 23, 27–47. [DOI] [PMC free article] [PubMed] [Google Scholar]
- Pedersen PL (2007). Warburg, me and Hexokinase 2: multiple discoveries of key molecular events underlying one of cancers’ most common phenotypes, the “Warburg Effect”, i.e., elevated glycolysis in the presence of oxygen. J. Bioenerg. Biomembr 39, 211–222. [DOI] [PubMed] [Google Scholar]
- Pylayeva-Gupta Y, Grabocka E, and Bar-Sagi D (2011). RAS oncogenes: weaving a tumorigenic web. Nat. Rev. Cancer 11, 761–774. [DOI] [PMC free article] [PubMed] [Google Scholar]
- Qian W, Choi S, Gibson GA, Watkins SC, Bakkenist CJ, and Van Houten B (2012). Mitochondrial hyperfusion induced by loss of the fission protein Drp1 causes ATM-dependent G2/M arrest and aneuploidy through DNA replication stress. J. Cell Sci 125, 5745–5757. [DOI] [PMC free article] [PubMed] [Google Scholar]
- Rahib L, Smith BD, Aizenberg R, Rosenzweig AB, Fleshman JM, and Matrisian LM (2014). Projecting cancer incidence and deaths to 2030: the unexpected burden of thyroid, liver, and pancreas cancers in the United States. Cancer Res. 74, 2913–2921. [DOI] [PubMed] [Google Scholar]
- Rambold AS, Cohen S, and Lippincott-Schwartz J (2015). Fatty acid trafficking in starved cells: regulation by lipid droplet lipolysis, autophagy, and mitochondrial fusion dynamics. Dev. Cell 32, 678–692. [DOI] [PMC free article] [PubMed] [Google Scholar]
- Rehman J, Zhang HJ, Toth PT, Zhang Y, Marsboom G, Hong Z, Salgia R, Husain AN, Wietholt C, and Archer SL (2012). Inhibition of mitochondrial fission prevents cell cycle progression in lung cancer. FASEB J. 26, 2175–2186. [DOI] [PMC free article] [PubMed] [Google Scholar]
- Riddle SR, Ahmad A, Ahmad S, Deeb SS, Malkki M, Schneider BK, Allen CB, and White CW (2000). Hypoxia induces hexokinase II gene expression in human lung cell line A549. Am. J. Physiol. Lung Cell. Mol. Physiol 278, L407–L416. [DOI] [PubMed] [Google Scholar]
- Roy M, Reddy PH, Iijima M, and Sesaki H (2015). Mitochondrial division and fusion in metabolism. Curr. Opin. Cell Biol 33, 111–118. [DOI] [PMC free article] [PubMed] [Google Scholar]
- Ryan DP, Hong TS, and Bardeesy N (2014). Pancreatic adenocarcinoma. N. Engl. J. Med 371, 1039–1049. [DOI] [PubMed] [Google Scholar]
- Scatena R (2012). Mitochondria and cancer: a growing role in apoptosis, cancer cell metabolism and dedifferentiation. Adv. Exp. Med. Biol 942, 287–308. [DOI] [PubMed] [Google Scholar]
- Serasinghe MN, Wieder SY, Renault TT, Elkholi R, Asciolla JJ, Yao JL, Jabado O, Hoehn K, Kageyama Y, Sesaki H, and Chipuk JE (2015). Mitochondrial division is requisite to RAS-induced transformation and targeted by oncogenic MAPK pathway inhibitors. Mol. Cell 57, 521–536. [DOI] [PMC free article] [PubMed] [Google Scholar]
- Sheridan C, and Martin SJ (2010). Mitochondrial fission/fusion dynamics and apoptosis. Mitochondrion 10, 640–648. [DOI] [PubMed] [Google Scholar]
- Shi LZ, Wang R, Huang G, Vogel P, Neale G, Green DR, and Chi H (2011). HIF1alpha-dependent glycolytic pathway orchestrates a metabolic checkpoint for the differentiation of TH17 and Treg cells. J. Exp. Med 208, 1367–1376. [DOI] [PMC free article] [PubMed] [Google Scholar]
- Siegel RL, Miller KD, and Jemal A (2018). Cancer statistics, 2018. CA Cancer J. Clin 68, 7–30. [DOI] [PubMed] [Google Scholar]
- Singhi AD, Nikiforova MN, Fasanella KE, McGrath KM, Pai RK, Ohori NP, Bartholow TL, Brand RE, Chennat JS, Lu X, et al. (2014). Preoperative GNAS and KRAS testing in the diagnosis of pancreatic mucinous cysts. Clin. Cancer Res. 20, 4381–4389. [DOI] [PubMed] [Google Scholar]
- Smith JJ, and Aitchison JD (2013). Peroxisomes take shape. Nat. Rev. Mol. Cell Biol 14, 803–817. [DOI] [PMC free article] [PubMed] [Google Scholar]
- Son J, Lyssiotis CA, Ying H, Wang X, Hua S, Ligorio M, Perera RM, Ferrone CR, Mullarky E, Shyh-Chang N, et al. (2013). Glutamine supports pancreatic cancer growth through a KRAS-regulated metabolic pathway. Nature 496, 101–105. [DOI] [PMC free article] [PubMed] [Google Scholar]
- Tanwar DK, Parker DJ, Gupta P, Spurlock B, Alvarez RD, Basu MK, and Mitra K (2016). Crosstalk between the mitochondrial fission protein, Drp1, and the cell cycle is identified across various cancer types and can impact survival of epithelial ovarian cancer patients. Oncotarget 7, 60021–60037. [DOI] [PMC free article] [PubMed] [Google Scholar]
- Vander Heiden MG, and DeBerardinis RJ (2017). Understanding the Intersections between Metabolism and Cancer Biology. Cell 168, 657–669. [DOI] [PMC free article] [PubMed] [Google Scholar]
- Vyas S, Zaganjor E, and Haigis MC (2016). Mitochondria and Cancer. Cell 166, 555–566. [DOI] [PMC free article] [PubMed] [Google Scholar]
- Wai T, and Langer T (2016). Mitochondrial Dynamics and Metabolic Regulation. Trends Endocrinol. Metab. 27, 105–117. [DOI] [PubMed] [Google Scholar]
- Wakabayashi J, Zhang Z, Wakabayashi N, Tamura Y, Fukaya M, Kensler TW, Iijima M, and Sesaki H (2009). The dynamin-related GTPase Drp1 is required for embryonic and brain development in mice. J. Cell Biol 186, 805–816. [DOI] [PMC free article] [PubMed] [Google Scholar]
- Walters DM, Lindberg JM, Adair SJ, Newhook TE, Cowan CR, Stokes JB, Borgman CA, Stelow EB, Lowrey BT, Chopivsky ME, et al. (2013a). Inhibition of the growth of patient-derived pancreatic cancer xenografts with the MEK inhibitor trametinib is augmented by combined treatment with the epidermal growth factor receptor/HER2 inhibitor lapatinib. Neoplasia 15, 143–155. [DOI] [PMC free article] [PubMed] [Google Scholar]
- Walters DM, Stokes JB, Adair SJ, Stelow EB, Borgman CA, Lowrey BT, Xin W, Blais EM, Lee JK, Papin JA, et al. (2013b). Clinical, molecular and genetic validation of a murine orthotopic xenograft model of pancreatic adenocarcinoma using fresh human specimens. PLoS One 8, e77065. [DOI] [PMC free article] [PubMed] [Google Scholar]
- Wanders RJ, Vreken P, Ferdinandusse S, Jansen GA, Waterham HR, van Roermund CW, and Van Grunsven EG (2001). Peroxisomal fatty acid alpha- and beta-oxidation in humans: enzymology, peroxisomal metabolite transporters and peroxisomal diseases. Biochem. Soc. Trans 29, 250–267. [DOI] [PubMed] [Google Scholar]
- Wang C-C, Bajikar SS, Jamal L, Atkins KA, and Janes KA (2014). A time- and matrix-dependent TGFBR3-JUND-KRT5 regulatory circuit in single breast epithelial cells and basal-like premalignancies. Nat. Cell Biol 16, 345–356. [DOI] [PMC free article] [PubMed] [Google Scholar]
- Wieder SY, Serasinghe MN, Sung JC, Choi DC, Birge MB, Yao JL, Bernstein E, Celebi JT, and Chipuk JE (2015). Activation of The Mitochondrial Fragmentation Protein Drp1 Correlates with BrafE600E Melanoma. J. Invest. Dermatol 135, 2544–2547. [DOI] [PMC free article] [PubMed] [Google Scholar]
- Xia J, and Wishart DS (2010). MetPA: a web-based metabolomics tool for pathway analysis and visualization. Bioinformatics 26, 2342–2344. [DOI] [PubMed] [Google Scholar]
- Yan Z, Gao J, Lv X, Yang W, Wen S, Tong H, and Tang C (2016). Quantitative Evaluation and Selection of Reference Genes for Quantitative RT-PCR in Mouse Acute Pancreatitis. BioMed Res. Int 2016, 8367063. [DOI] [PMC free article] [PubMed] [Google Scholar]
- Yang S, Wang X, Contino G, Liesa M, Sahin E, Ying H, Bause A, Li Y, Stommel JM, Dell’antonio G, et al. (2011). Pancreatic cancers require autophagy for tumor growth. Genes Dev. 25, 717–729. [DOI] [PMC free article] [PubMed] [Google Scholar]
- Ying H, Kimmelman AC, Lyssiotis CA, Hua S, Chu GC, Fletcher-Sananikone E, Locasale JW, Son J, Zhang H, Coloff JL, et al. (2012). Oncogenic Kras maintains pancreatic tumors through regulation of anabolic glucose metabolism. Cell 149, 656–670. [DOI] [PMC free article] [PubMed] [Google Scholar]
- Youle RJ, and van der Bliek AM (2012). Mitochondrial fission, fusion, and stress. Science 337, 1062–1065. [DOI] [PMC free article] [PubMed] [Google Scholar]
- Yun J, Rago C, Cheong I, Pagliarini R, Angenendt P, Rajagopalan H, Schmidt K, Willson JKV, Markowitz S, Zhou S, et al. (2009). Glucose deprivation contributes to the development of KRAS pathway mutations in tumor cells. Science 325, 1555–1559. [DOI] [PMC free article] [PubMed] [Google Scholar]
- Zdzisińska B, Żurek A, and Kandefer-Szerszeń M (2017). Alpha-Ketoglutarate as a Molecule with Pleiotropic Activity: Well-Known and Novel Possibilities of Therapeutic Use. Arch. Immunol. Ther. Exp. (Warsz.) 65, 21–36. [DOI] [PMC free article] [PubMed] [Google Scholar]
- Zorzano A, Liesa M, Sebastián D, Segalés J, and Palacín M (2010). Mitochondrial fusion proteins: dual regulators of morphology and metabolism. Semin. Cell Dev. Biol 21, 566–574. [DOI] [PubMed] [Google Scholar]
Associated Data
This section collects any data citations, data availability statements, or supplementary materials included in this article.
Supplementary Materials
Data Availability Statement
Further information about the data may be directed to and will be fulfilled by the corresponding author David Kashatus (kashatus@virginia.edu). Raw metabolomics data can be found in Table S1.