

Abstract
Objective:
The use of a neoadjuvant chemoradiation followed by surgery in patients with stage IIIA NSCLC is controversial and the benefit of surgery is limited. There are currently no clinically validated biomarkers to select patients for such an approach. In this study we evaluate computed tomography (CT) derived intratumoral and peritumoral texture and nodule shape features in their ability to predict major pathological response (MPR). MPR being defined as ≤10% of residual viable tumor, assessed at the time of surgery.
Materials and Methods:
Ninety patients with stage III NSCLC treated with chemoradiation prior to surgical resection were selected. The patients were divided randomly into two equal sets, one for training and one for independent testing. The radiomic texture and shape features were extracted from within the nodule (intra) and from the parenchymal regions immediately surrounding the nodule (peritumoral). A univariate regression analysis was performed on the image and clinicopathologic variables and then included into a multivariable logistic regression (MLR) for binary outcome prediction of MPR. The radiomic signature risk-score was generated by using a multivariate Cox regression model and association of the signature with OS and DFS was also evaluated.
Results:
Thirteen stable and predictive intratumoral and peritumoral radiomic texture features were found to be predictive of MPR. The MLR classifier yielded an AUC of 0.90 ± 0.025 within the training set and a corresponding AUC = 0.86 in prediction of MPR within the test set. The radiomic signature was also significantly associated with OS (HR = 11.18, 95% CI = 3.17, 44.1; p-value = 0.008) and DFS (HR = 2.78, 95% CI = 1.11, 4.12; p-value = 0.0042) in the testing set.
Conclusion:
Texture features extracted within and around the lung tumor on CT images appears to be associated with the likelihood of MPR, OS and DFS to chemoradiation.
Keywords: Non-small cell lung cancer, locally advanced, chemoradiation, surgery
1. Introduction
The treatment of stage III NSCLC involves a multi-disciplinary approach and careful patient selection to determine which resectable patients might benefit from a trimodality treatment [1, 2]. Neoadjuvant chemotherapy administered prior to surgery can reduce tumor extent and metastases, thereby improving resectability. The role of surgery in stage IIIA patients still remains controversial. Survival benefit of surgery in this setting has long been debated and has proven difficult to demonstrate in multi-institute trials compared to definitive chemoradiation [1, 3]. Yet, ad hoc subgroup analyses have provided data to suggest that resection (lobectomy) confers a clear survival benefit in this setting [1]. In current clinical practice the selection of patients for trimodality therapy is largely based on relatively limited lymph node burden, single lobe involvement, and patient fitness for this aggressive approach with little attention paid to specific markers of response.
Several studies have shown that pathologic response to chemoradiation is highly predictive of disease free survival and overall survival [4–6]. The degree of down staging seems to correlate with survival with the greatest benefit associated with ≤10% residual tumor noted on resected specimens (defined as major pathologic response (MPR)) [5]. Unfortunately, there are no extant clinically validated and approved biomarkers to predict MPR to chemoradiation.
Use of radiomics, or computerized feature analysis of radiographic scans, to capture quantitative phenotypic attributes of the tumor has emerged as an important prospect for survival prediction [7–19]. These approaches have been used to capture and associate quantitative measurements of intratumoral heterogeneity and tumor shape from CT scans to predict response to first line chemotherapy and neoadjuvant chemoradiation in patients with NSCLC [7, 20, 21]. However, apart from radiomic assessment of intratumoral heterogeneity patterns, there is increasing evidence that heterogeneity patterns associated with the peritumoral region—the area immediately surrounding the tumor mass—might harbor valuable disease specific prognostic cues. For instance, signatures of immune response such as presence of peritumoral lymphocytes have been shown to be associated with disease specific survival [22]. Also, vascular invasion and neovascularization within the peritumoral region have been shown to be associated with an increased likelihood of tumor recurrence as well as reduced overall survival [23].
In this work we sought to explore whether textural patterns of the peritumoral space coupled with measurements of lesion shape and intratumoral texture patterns might identify which stage IIIA NSCLC patients are likely to have MPR after chemoradiation. The association of these radiomic features with overall survival and disease free survival was also evaluated. The intra- and peritumoral texture features were extracted from baseline CT images and only a limited number of features that found to be strongly associated with response were validated in the testing set. Additionally, the prognostic ability of the radiomic features against tumor shape and clinicopathologic variables was also evaluated.
2. Materials and Methods
2.1. Study population
In this single-institution study we retrospectively evaluated the pretreatment CT scans of patients with locally advanced stage IIIA NSCLC who were treated with neoadjuvant chemoradiation followed by surgical resection. The treatment regimen included Carboplatin + Paclitaxel, Carboplatin + Docetaxel, Cisplatin + Etoposide and Carboplatin + Pemetrexed. This study was approved by the institutional review board at the Cleveland Clinic. One hundred twenty-three patients with stage III NSCLC treated with neoadjuvant chemoradiation prior to surgical resection who had baseline CT between 2006 and 2015 were retrospectively included in this study. Among these, 33 patients with incidental findings suspicious of distant metastatic disease or with unavailable pre-chemoradiation CT were excluded. Of the remaining 90 patients (36 responders and 54 non-responders) all of whom underwent surgery, half of the responders and non-responders were randomly selected for the training and testing sets. The training set comprised of 45 patients (18 responders and 27 non-responders), and remaining 45 cases not used in the training set were employed for testing. The overall experimental design and patient selection is depicted in Figure S.1 of the Supplemental Data II document.
2.2. Clinical endpoints
The primary endpoint of our study was major pathological response, defined as ≤10% of residual viable tumor, assessed at the time of surgery. Patients who had majority pathological response were classified as ‘responders’ and the remaining as non-responders. The secondary endpoints were overall survival (OS) and disease-free survival (DFS). OS was measured from the date of surgery to the date of death and censored at the date of last follow-up for survivors. DFS was measured from the date of surgery to the date of recurrence or the date of death, whichever occurred earlier, and censored at the date of last follow-up for those alive without disease recurrence.
2.3. Clinical variables
The clinical prognostic factors used in this study included Eastern Cooperative Oncology Group (ECOG) performance status and TNM stage per the American Joint Committee on Cancer (AJCC) staging system. Clinical staging (e.g., overall stage IIIA vs. IIIB), tumor histology (adenocarcinoma or squamous cell carcinoma), procedure type (lobectomy or pneumonectomy), median radiation dose and nodal disease (N0, N1, N2) were performed.
2.4. CT scan acquisition parameters
The CT scan images were acquired from either Siemens, GE Medical Systems, Philips or Toshiba CT scanners. The information pertaining to the CT acquisition parameters is provided in the Supplementary Data I in Table S.1.
2.5. Image segmentation
Lung tumors were contoured on 3D-Slicer® software where a free hand tool was used to manually segment the lesion by two expert readers. The readers were blinded to the true histopathologic diagnosis of all cases and were asked to delineate the pulmonary nodules. The readers excluded from consideration individuals with diffuse or multiple nodules. The peritumoral region around the nodule was defined by the use of basic mathematical morphologic operations (dilation) as a region expanding radially from the nodule boundary of 15 mm. The choice of the size of the peritumoral region was determined by the findings in [24], where increasing the surgical margin of nodule resection for NSCLC beyond 15 mm did not appear to decrease the likelihood of risk of recurrence. Our in-house software program was able to eliminate the effect of skin, air or lipids when the mask was extended. During the peritumoral texture analysis of the lung parenchyma, care was taken to threshold the Hounsfield units (HU) of the CT scan, to remove air (<−900 HU) and mediastinal muscle pixels (>−100 HU) in peripheral tumor. To avoid any edge artifacts that might arise during feature extraction, the thresholded ‘dead’ pixels of the CT scan were substituted by using an averaging filter (9 × 9). Figure S.2 in the Supplementary Data II shows delineation of the intra-tumoral and peritumoral compartments of the nodule.
2.6. Radiomic feature extraction
To capture the tumor phenotype, radiomic features were extracted from within and around the tumor. The feature extraction was performed in MATLAB 2018b (Mathworks, Natick, MA, USA) using an in-house software program. The radiomic feature set is described in detail in Supplementary Data III. 1542 radiomic features from the intra- and peritumoral compartments were extracted from baseline CT scans. We extracted 13 Haralick, 10 local binary pattern (LBP) and 20 histogram of oriented gradient (HOG) set of features. These features capture textural pattern and were predictive of variation in tumor microarchitecture, heterogeneity and local appearance of nodules [25]. 13 Co-occurrence of local anisotropy gradients (CoLlAGe) features, that capture textural entropy structural disorder by applying gray-level co-occurrence matrix (GLCM) metrics of disorder to local dominant intensity gradients, were extracted. In addition, we extracted 25 Law and 48 Gabor features from intra- and peri-tumoral regions. Law is a filter-based descriptor that can capture textural patterns while Gabor captures different spatial frequencies within the image at directional orientations [26]. Furthermore, 24 computerized quantitative shape features were extracted, and evaluated in combination with texture features [27]. The shape features were calculated in 3D space while the remaining radiomic texture features were computed in 2D on a slice-by-slice basis. The First-order statistics (mean, median, SD, skewness, and kurtosis) of each feature was computed across all the pixels and over all slices containing the tumor. All feature values were then normalized (mean of 0 and a standard deviation of 1).
2.7. Radiomic feature discovery
Feature selection was employed to rank and choose the most stable and predictive features. Highly stable (reproducible) features were selected based off evaluation on the test-retest RIDER lung CT dataset (baseline and follow-up) [28] while lung tumors were annotated by an expert reader. This publicly dataset has been previously used in the context of a number of studies [29, 30, 31]. The intra-class correlation coefficient (ICC) was calculated to quantify the consistency of the radiomic measurements between two scans performed on each patient. Features with a high ICC suggest that the radiomic features should be resilient to variations in CT scan time, repeated experiments and acquisition parameters. In this study features with an ICC ≥ 0.85 were considered as highly stable and reproducible. The minimum redundancy maximum relevance (mRMR) feature selection algorithm, an entropy-based feature selection method, was subsequently employed to identify the most discriminating features from amongst those with an ICC > 0.85. mRMR is used to select those features with a high correlation with respect to the target class, while also attempting to mitigate the relative correlation between features.
2.8. Statistical Data Analysis
Logistic regression along with the receiver operating characteristic (ROC) analysis was used to identify the radiomic features that were determined to be predictive of MPR. The area (AUC) under the receiver operating characteristic curve was calculated for response rate to induction chemoradiotherapy. Exact binomial 95% confidential intervals (CIs) and odds ratio were calculated by using glm function in R, version 3.1.3. A univariate analysis of radiomic features and clinicopathologic variables was initially performed. The variables with p-value < 0.05 were introduced into a multivariable logistic regression model. The regression classifier was then iteratively trained with those variables and evaluated across 100 iterations of three-fold cross-validation. The selected model was then validated to predict response to therapy on the test set.
The Kaplan–Meier survival analysis and log-rank statistical tests were performed to assess the univariate discriminative ability of the features. The following baseline patient characteristics were tested to explain variability in OS: sex, histology (adenocarcinomas vs. squamous), vascular invasion, lymphatic invasion, chemotherapy agent (carboplatin vs. cisplatin) and surgery type (lobectomy vs. pneumonectomy).
To build the multivariate radiomic signature for Time-to-event data (OS, DFS), Cox regression models were trained on the training set for selected prognostic radiomic variables and the predictions by these models were evaluated on the testing set. Backward elimination feature selection method was performed on selected prognostic features in multivariate analysis. Intermediate models were tested by repeated random sub-sampling based cross validation with 100 iterations on the training set. The point at which the mean CI of the shrinking model drops, the corresponding feature set is selected and used to construct a radiomic risk score for predicting OS and DFS. The risk score was calculated using a linear combination of those features with corresponding coefficients calculated by a multivariate Cox model. Patients were stratified based on the median risk-score and were divided into high and low risk categories. A multivariate Cox proportional hazards model was employed to evaluate the ability of the risk-score in predicting OS and DFS (by using survfit and coxph functions, respectively, in R, version 3.1.3). In addition, 95% CIs and relative hazard ratio (HR) were calculated using the Wald test and the G-rho rank test, respectively. Additionally, decision curve analysis was used to compare the radiomics signature and clinicopathological measurements for prediction of high risk patients to receive treatment at different threshold probabilities [32].
Differences between clinical categories were assessed using the Fisher’s exact test or a two-sided Wilcoxon-test for categorical or continuous variables, respectively. Finally, the Dice index statistic and surface distance were calculated to evaluate the nodule contour segmentation agreement between the two radiologists while all agreement values were computed from those slices identified as containing a lesion by both readers.
3. Results
3.1. Statistical Analysis
Ninety patients with NSCLC were included for analysis with a median age of 64 years (range 38–88 years), and majority of men (54.4%). Tumor histology was predominantly adenocarcinoma (71.1%) vs. 22.2% squamous cell carcinoma while the histology for 6.7% was unknown, stage IIIA (94.4%), with positive N2 nodes (91.1%). The median follow-up and survival time was 34.57 months (range: 0.13–114 months). The median time to recurrence or distant metastasis (DM) was 17.95 months (range: 0.2 – 70 months). Following chemoradiation, 77.8% (70) patients underwent lobectomy and 22.2% (20) underwent pneumonectomy. Overall, pathological response was achieved in 40% (36) patients; labeled responders (major pathological response, MPR), while 60% (54) patients were non-responders (non-MPR). Among the responders, 66.7% (24) patients underwent lobectomy while 33.3% (12) underwent pneumonectomy, (see Tables S.2 and S.3 in Supplemental Data I for additional information regarding patient characteristics, clinical outcomes and treatment information).
3.2. Radiomic feature discovery
Among all 1542 extracted features, a total of 1039 (67%) were identified as being highly stable, based off the intra-class correlation coefficient, ICC > 0.85 threshold. From among these 1039 features, a further 13 features were selected using the mRMR feature selection method as being predictive of MPR. The average and variance ICC for these 13 selected features was 0.93 ± 0.026 (95% CI = 0.90, 0.98), suggesting a high degree of reproducibility for the same day test-retest cases within the RIDER dataset. These features and their corresponding p-values obtained in discriminating responders vs non-responders are summarized in Table 1.
Table 1.
The most discriminative texture features selected by the feature selection method.
| MRMR feature selection method | ||||||
|---|---|---|---|---|---|---|
| Feature Family | Descriptor | Statistic | Location | p-value (training) Reader 1 | p-value (training) Reader 2 | |
| 1 | Law_laplacian | S5 × R5 | Skewness | Peritumoral | 0.0289 | 0.0481 |
| 2 | Law | W5 × S5 | Kurtosis | Peritumoral | 0.0475 | 0.0337 |
| 3 | Law | E5 × W5 | Kurtosis | Intratumoral | 0.0313 | 0.0293 |
| 4 | Gabor | f = 8, θ = 0 | SD | Intratumoral | 0.0304 | 0.0446 |
| 5 | Tumor Shape | Area | Mean | Peritumoral | 0.0291 | 0.0238 |
| 6 | Law_Laplacian | W5 × S5 | Var | Peritumoral | 0.0209 | 0.0199 |
| 7 | Gabor | f = 8, θ = 0 | Median | Intratumoral | 0.05 | 0.056 |
| 8 | Law_Laplacian | E5 × W5 | Kurtosis | Intratumoral | 0.0403 | 0.0289 |
| 9 | Haralick | Inertia | SD | Intratumoral | 0.0755 | 0.1803 |
| 10 | Law_Laplacian | E5 × W5 | Skewness | Intratumoral | 0.05 | 0.0423 |
| 11 | Law_Laplacian | W5 × E5 | Var | Intratumoral | 0.0430 | 0.0477 |
| 12 | Gabor | f = 16, θ = 0 | SD | Intratumoral | 0.0384 | 0.0455 |
| 13 | Gabor | f = 8, θ = 0 | Skewness | Intratumoral | 0.0831 | 0.0779 |
3.3. Machine based Clustering and Classification of Top Ranked Features
Unsupervised clustering was done to identify differences between MPR and non-MPR without any knowledge about output (rather than prediction). The heat map shown in Figure 1.A illustrates an unsupervised hierarchal clustering feature expression heat map and dendrogram of the most discriminating features for responders and non-responders in training set. Consensus clustering approach was also employed to evaluate the discriminative ability of the combination of intratumoral and peritumoral features in the training set. Figure 1.B shows distinct response associated clusters obtained via a combination of intratumoral and peritumoral features. The two clusters respectively had a preponderance of non-responders (56%) and responders (89%) respectively. Clustering performed using only intratumoral features was less accurate compared to the corresponding clustering obtained via a combination of peritumoral and intratumoral clustering (52% non-responders and 78% responders in the two dominant clusters) and had noticeably weaker consensus within clusters, as shown in Figure 1.C.
Figure 1.
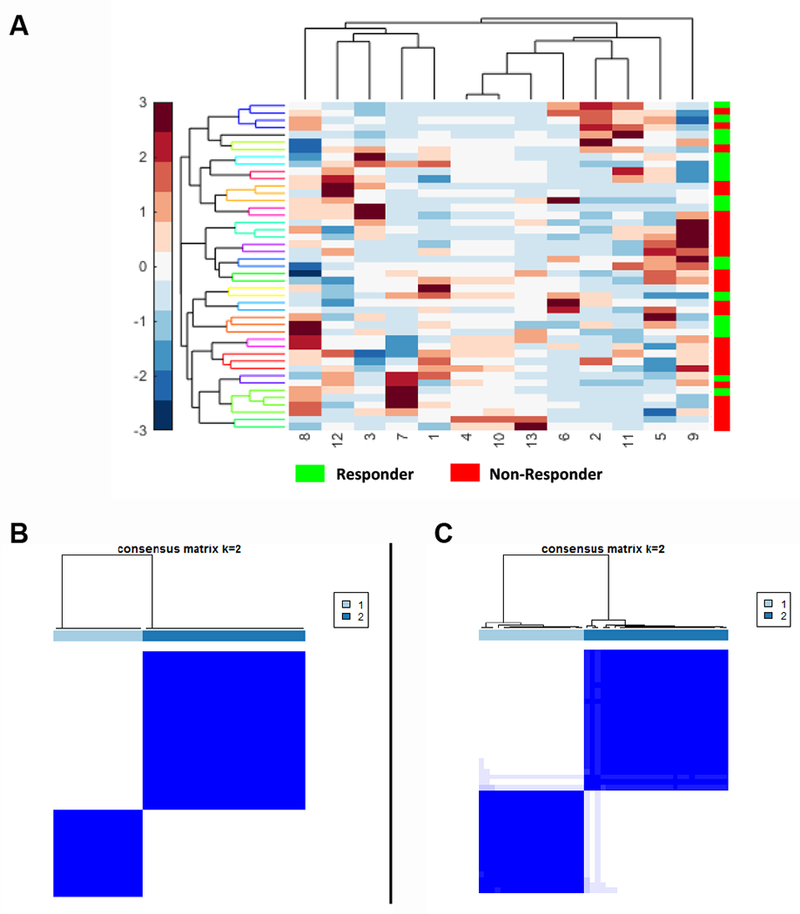
(A) Unsupervised hierarchal clustering feature expression heat map of the most discriminating features for responders and non-responders in the training set. The number on X-axis corresponds to each feature in Table 1. (B) Consensus clustering using combined intratumoral and peritumoral texture features. (C) intratumoral texture features alone.
Table 2 indicates the univariate regression analysis of radiomic features and clinicopathologic variables in discrimination of responders and non-responders in the training set. Features with p-value < 0.05 were used to train a logistic regression classifier in training set. This signature consists of four radiomic features (peritumoral Laws, area of lesion, peritumoral Law_Laplacian and intratumoral Gabor features) and one clinicopathologic biomarker (lymphatic invasion). The combined model yielded an AUC of 0.90 ± 0.025 on the training set and corresponding AUC of 0.86 for the test set. With radiomic features alone, the model achieved an AUC of 0.87 ± 0.045 on the training set and a corresponding AUC of 0.82 for the test set.
Table 2.
Univariate regression analysis in predicting MPR for combination of radiomic and clinicopathologic features in the training set.
| Covariate (Feature) | Odds Ratio (OR) | 95% CI | p-value | |
|---|---|---|---|---|
| Law_laplacian (per heterogeneity increase) | 0.631 | 0.33 | 1.1 | 0.126 |
| Law (per heterogeneity increase) | 2.498 | 1.24 | 6.01 | 0.0207 ** |
| Law (per heterogeneity increase) | 0.589 | 0.28 | 0.07 | 0.112 |
| Gabor (per density of lesion increase) | 2.017 | 1.08 | 4.38 | 0.0483 ** |
| Tumor area (per area of lesion increase) | 3.861 | 1.66 | 12.74 | 0.0089 ** |
| Law_Laplacian (per heterogeneity increase) | 1.833 | 1.01 | 3.8 | 0.0489 ** |
| Gabor (per density of lesion microenvironment increase) | 1.817 | 1.00 | 3.66 | 0.0645 |
| Law_Laplacian (per heterogeneity increase) | 0.684 | 0.33 | 1.21 | 0.237 |
| Haralick (per entropy increase) | 1.537 | 0.85 | 3.02 | 0.170 |
| Law_Laplacian (per heterogeneity increase) | 0.593 | 0.28 | 1.08 | 0.117 |
| Law_Laplacian (per heterogeneity increase) | 1.694 | 0.97 | 3.5 | 0.0956 |
| Gabor (per tumor micro environment increase) | 2.539 | 1.08 | 8.26 | 0.0818 |
| Gabor (per tumor micro environment increase) | 1.973 | 1.08 | 4.16 | 0.045 ** |
| Histology (adeno vs. SCC) | 1.312 | 0.27 | 6.34 | 0.728 |
| Vascular Invasion (invasive vs. non- invasive | 0.166 | 0.01 | 1.1 | 0.112 |
| Lymphatic Invasion (invasive vs. non-invasive) | 0.052 | 0.007 | 0.23 | 0.0006 ** |
| Tumor volume (per tumor volume increase) | 1.54 | 0.01 | 1.55 | 0.25 |
| Age (per year increase) | 1.002 | 0.94 | 1.06 | 0.941 |
| Sex (male vs. female) | 0.497 | 0.14 | 1.63 | 0.257 |
The trained regression classifier by volume of tumor from baseline CT images had a corresponding AUC of 0.68 ± 0.056 on the training set and AUC of 0.61 on the test set.
Since the CT scans employed in this study had a range of slice thicknesses (0.6 mm to 5 mm), the impact of slice thickness on the performance of the classifier was also evaluated (see Supplemental Data I and Table S.4). Additionally, differences in peritumoral radiomic patterns between normal and cancerous regions were compared (see Supplementary Data II Section 3 and Figure S.3).
The distribution statistics of the Laws and Law-Laplacian features, as captured by skewness and kurtosis, were found to be different between lesions that did and did not have response. Figure 2 (A & B) suggests the presence of a higher textural pattern disorder or heterogeneity within and around non-responder lesions compared to responder lesions on the CT scans.
Figure 2.
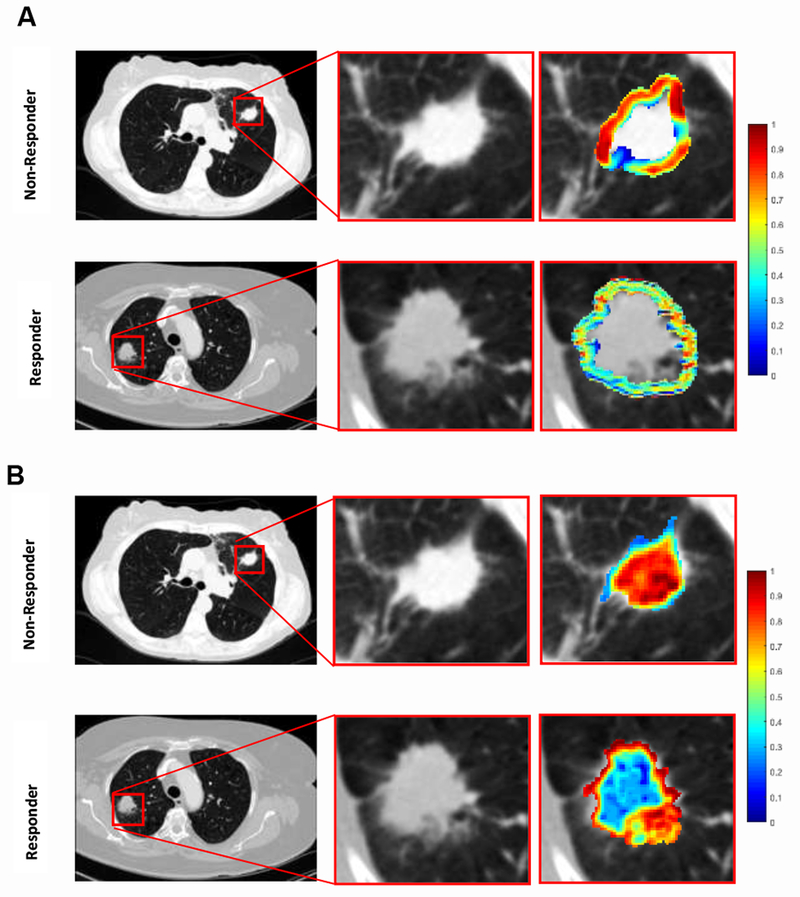
Radiomic feature maps showing differences between responders and nonresponders lesions on pretreatment CT. There appears to be overexpression of radiomic features ((A) peritumoral Law-Laplacian and (B) intratumoral laws shown here) in non-responder lesions compared to responder lesions. The distribution of the features shows significant differences between the two lesion categories; these differences are captured by the skewness and kurtosis statistics of the distribution.
3.4. Radiomic Prediction as a Function of Human Reader Segmentation Performance
The classifier performance based off the nodule segmentations by two radiologist readers was compared. The explicit goal of this experiment was to quantitatively evaluate the effect of contour variability on the corresponding extracted feature values and the resulting classifier performance. The Dice overlap and average surface distances between two radiologist readers were found to be 0.80 ± 0.045 and 4.47 ± 3.03, respectively. The over segmentation error between the two readers was 0.18 ± 0.09 and the corresponding under segmentation error was 0.14 ± 0.12. Furthermore, Figures S.4A and S.4B in Supplemental Data II illustrate inter-readers specific Dice values vs. volume of nodule and surface distances vs. Dice value for all 90 studies. The discord might arise because for some of the nodules the starting and ending slice numbers may differ between the readers. The performance of the logistic regression classifier was also evaluated on both sets of annotated CTs by two radiologists. The performance of classifier in training set for both two cohorts was the same 0.89 ± 0.075 but for one cohort, the classifier reached AUC of 0.86 in the testing set while for the other cohort segmented by the second radiologist, the AUC was 0.85. The average and variance ICC for 13 top selected features was 0.88 ± 0.027, suggesting a high inter-reader correlation between the top selected features.
3.5. Overall Survival analysis
The median follow-up for all 90 patients was 34.57 months (0.13 −114). Kaplan-Meier overall survival curves were not significantly different for gender (p-value = 0.95), vascular invasion (p-value = 0.62), tumor histology (adenocarcinoma, squamous cell carcinoma (SCC), p-value = 0.44), lymphatic invasion (p-value = 0.057), chemotherapy agent (carboplatin vs. cisplatin, p-value = 0.43) or surgery type (lobectomy vs. pneumonectomy, p-value = 0.098). Specially, patients with bone or brain metastasis demonstrated poorer survival. Figure S.5 (A – F) in Section 5 of Supplemental Data II illustrates the Kaplan-Meier curves for different clinical-pathologic parameters and the results of survival analysis. Table S.5 in Supplemental Data I shows the results of univariate Cox regression analysis for OS.
A multivariate Cox regression model to predict OS was developed by using Cox regression backward elimination. Radiomic features were iteratively deleted in order of low to high mRMR rank on the training set while the test set was used for independent validation. The combination that yielded the maximum CI on the training set was defined as the optimal radiomic signature (risk-score) for predicting OS. This signature comprised of radiomic features (peritumoral Laws W5 × S5, intratumoral low frequency Gabor, tumor area, and intratumoral Law_Laplacian W5 × E5). This optimal signature yielded CI = 0.84 and Wald p-value = 0.017 on the training set. The radiomics signature was associated with OS in the training (HR: 11.7, 95% CI: 2.95 – 46.5, p-value = 0.0004) and testing data sets (HR = 11.18, 95% CI = 3.17, 44.1; p-value = 0.008) respectively. Table S.6 in the Supplemental Data I shows the result of the multivariate Cox regression analysis for features that contributed to the radiomic risk-score for predicting OS. A multivariate Cox regression analysis identified the radiomics signature as an independent risk factor in OS (radiomics signature risk-score: HR: 12.58, 95% CI: 2.5, 63.5, p-value = 0.0022; histologic grade: HR: 1.06, 95% CI: 0.37, 3.08, p-value = 0.9; Vascular Invasion: HR: 1.36, 95% CI: 0.75, 2.48, p-value = 0.30; and Lymphatic Invasion: HR: 0.98, 95% CI: 0.48, 1.99, p-value = 0.96). The corresponding Kaplan Meier survival curves in Figure 3.A showed a significant difference in OS between patients with low and high risk-scores, determined based off the training set (testing set: p-value = 0.00048).
Figure 3.
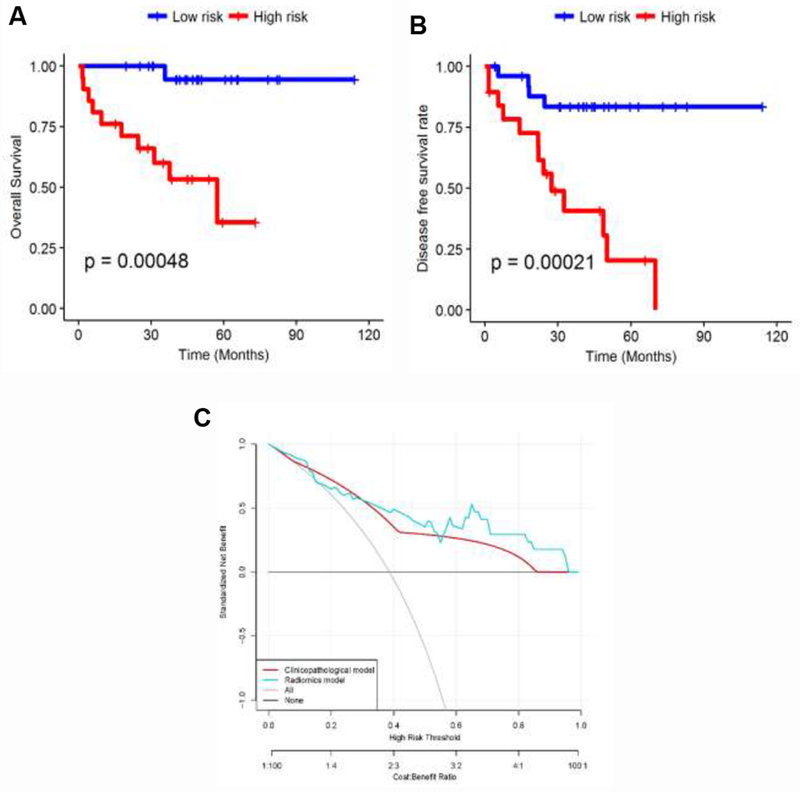
Kaplan Meier curves according to the (A) model predicting score to OS in test set. A significant difference appears between patients with low risk and high risk based on median risk-score (testing set: p-value = 0.00048) and (B) model predicting score to DFS rate. A significant difference appears between patients with low risk and high risk (testing set: p-value = 0.00021). (C) Decision curve analysis: the radiomics model had a higher net benefit in predicting which metastatic lung cancer patient should receive aggressive treatment, compared to a clinicopathologic model and simple strategies such as follow-up of all patients or no patients, across a full range of threshold probabilities at which a patient might be selected to undergo follow-up imaging.
3.6. Disease free survival analysis
The recurrence rate after surgery was 42.2% and the mean duration of recurrence after surgery was 20.28 ± 16.43 months and median was 17.95 months. Additional information about the location of loco-regional recurrence or systemic recurrence is available in Supplementary Data I in Table S.7. Most patients who experienced recurrence had either bone or brain metastasis. Mean survival for patients with bone and brain metastasis was 26.6 months and in patients with local metastasis was 38.7 months. Table 3 shows the univariate Cox regression analysis for DFS in the training set. A multivariate Cox regression model to predict DFS was developed by Cox regression backward elimination (Cl = 0.78, Wald p-value = 0.028). This radiomic signature comprised seven texture features (peritumoral Law_Laplacian S5 × R5, intratumoral Laws E5 × W5, peritumoral Law_Laplacian W5 × S5, intratumoral Haralick inertia, intratumoral Law_Laplacian E5 × W5, intratumoral Law_Laplacian W5 × E5 and intratumoral median frequency Gabor). The radiomics signature was associated with DFS in the training data set (HR: 2.71, 95% CI: 1.65 – 4.44, p-value = 7.4e-05), and this finding was confirmed in the testing data set (HR = 2.78, 95% CI = 1.11, 4.12; p-value = 0.0042). A multivariate Cox regression analysis identified the radiomics signature and Lymphatic Invasion as independent risk factors in DFS (radiomics signature risk-score: HR: 2.52, 95% CI: 1.43, 4.43, p-value = 0.0013; Lymphatic Invasion: HR: 1.71, 95% CI: 1.11,2.97, p-value = 0.048; histologic grade: HR: 0.53, 95% CI: 0.20, 1.48, p-value = 0.2; Vascular Invasion: HR: 1.07, 95% CI: 0.7, 1.62, p-value = 0.75).
Table 3.
Hazard ratios (HR) from univariate Cox Proportional Hazard model on DFS for combination of radiomic and clinicopathologic features.
| Covariate (Feature) | Hazard Ratio | 95% CI | p-value | |
|---|---|---|---|---|
| Law_Laplacian (per heterogeneity increase) | 1.96 | 0.93 | 4.17 | 0.078 |
| Law (per heterogeneity increase) | 0.73 | 0.41 | 1.29 | 0.28 |
| Law (per heterogeneity increase) | 1.53 | 0.97 | 2.42 | 0.068 |
| Gabor (per density of lesion increase) | 0.73 | 0.39 | 1.36 | 0.32 |
| Tumor area (per area of lesion increase) | 0.86 | 0.48 | 1.52 | 0.61 |
| Law_Laplacian (per heterogeneity increase) | 0.73 | 0.40 | 1.34 | 0.31 |
| Gabor (per density of lesion microenvironment increase) | 0.89 | 0.52 | 1.50 | 0.66 |
| Law_Laplacian (per heterogeneity increase) | 1.66 | 1.07 | 2.58 | 0.023 |
| Haralick (per entropy increase) | 0.71 | 0.41 | 1.25 | 0.24 |
| Law_Laplacian (per heterogeneity increase) | 1.52 | 0.96 | 2.42 | 0.073 |
| Law_Laplacian (per heterogeneity increase) | 1.00 | 0.51 | 1.96 | 0.99 |
| Gabor (per tumor micro environment increase) | 0.66 | 0.28 | 1.54 | 0.34 |
| Gabor (per tumor micro environment increase) | 1.01 | 0.57 | 1.77 | 0.97 |
| Histology (adeno vs. SCC) | 0.36 | 0.14 | 0.91 | 0.031 |
| Vascular Invasion (invasive vs. non- invasive) | 1.63 | 1.13 | 2.35 | 0.009 |
| Lymphatic Invasion (invasive vs. non- invasive) | 2.2 | 1.37 | 3.52 | 0.001 |
| Tumor volume (per tumor volume increase) | 0.97 | 0.62 | 1.53 | 0.92 |
| Age (per year increase) | 1.02 | 0.98 | 1.07 | 0.22 |
| Sex (male vs. female) | 1.57 | 0.60 | 4.09 | 0.35 |
Table S.8 in Supplemental Data I shows the result of the multivariate Cox regression analysis for features that contributed to the risk-score for predicting DFS. The corresponding Kaplan Meier curves in Figure 3.B showed a significant difference in DFS rate between patients with low and high risk-scores (testing set: p-value = 0.00021).
Additionally, a decision curve analysis showed that using the radiomics signature to predict disease metastases adds more benefit compared to the clinical-pathologic factors to make the decision of whether a patient should undergo aggressive treatment than the treat-all-patients scheme or the treat-none scheme (Figure 3.C).
3.7. The effect of image reconstruction convolution filters
The multivariate Cox proportional hazard model in predicting OS and DFS rates, as a function of different convolution filters (sharp and standard) on CT image reconstruction was evaluated. Extensive results are available in supplementary Data II in section 6 and Figures S.6.A and S.6.B.
4. Discussion
Tumoral heterogeneity is associated with a more aggressive tumor phenotype and poor clinical outcome [33, 34]. Stage IIIA NSCLC is a highly heterogeneous disease, the role of trimodality approach is somewhat controversial and outcome of neoadjuvant chemoradiotherapy (NAC) followed by surgery is variable. Patients who do not respond to neoadjuvant chemoradiation often do not benefit from such aggressive surgical approach due to early recurrence of disease. Thus, using a biomarker directed approach to identify patients for a more aggressive trimodality therapy could potentially yield better outcomes. Currently though there are no such biomarkers available in clinical practice and patients are selected for trimodality approach based on anatomic and physiologic parameters for surgical operability. A plethora of previous studies across different malignancies have attempted to investigate the role of radiomic features in distinguishing responders from non-responders for chemotherapy or radiation therapy on CT scans, with only a few focusing on non-small cell lung cancer [7, 21,27, 35, 36]. One limitation of these previous studies was the lack of testing dataset for model validation. In addition, most studies did not explore the surrounding tumor area that may offer unique radiomic signatures for discriminating responders and non-responders to treatment modalities.
In this study, we investigated the role of radiomic textural features extracted from the intratumoral and peritumoral regions of baseline pretreatment CT scans to predict response to chemoradiation prior to surgery. One of the objectives of this study was to use radiomic-based interrogation of peritumoral patterns on non-contrast enhanced CT scans for discriminating responders from non-responders to chemoradiation.
We identified that the most predictive markers based on stability for distinguishing responders from non-responders were Law_Laplacian and Laws features from the intratumoral and peritumoral compartments. These features appear to capture patterns of heterogeneous enhancement and disruption of textural patterns within and outside the nodules. We also extended the analysis of individual imaging texture features to survival estimation approach. A multi feature-based radiomics signature was identified to be an independent factor for recurrence in patients treated with chemotherapy, radiotherapy and surgery, with incremental value to the traditional staging system and other clinicopathologic risk factors for recurrence estimation after surgery. Multivariable Cox regression model revealed that a combination of radiomic texture features (intratumoral and peritumoral Laplacian Laws features that capture micro-gradients and patterns of heterogeneous enhancement) from a baseline non-contrast CT scan and lymphovascular invasion (LVI) status were predictive of DFS after trimodality therapy, although in clinical practice LVI status is determined in pathological specimens after surgery.
The previous study by Huang et al. showed that a combination of the radiomics signature and other clinicopathologic risk factors performed better than the traditional staging system and clinicopathologic factors alone, demonstrating the incremental value of the radiomic signature for recurrence association in early stage NSCLC patients underwent surgical resection [37].
Our study revealed that higher intratumoral Law Laplacian texture features that capture intratumoral heterogeneity were associated with non-responders, lower DFS rate and worse OS. While we will need to explore in future work whether the intratumoral heterogeneity assessed on imaging was associated with corresponding genomic or molecular heterogeneity, a few previous studies have suggested that increased expression of intratumoral heterogeneity could be a reflection of corresponding genomic heterogeneity, in turn indicating worse prognosis [38, 39]. Grove et al. showed that tumor shape complexity and intratumoral heterogeneity tended to associate with worse overall survival in lung adenocarcinoma [40].
Another recent study showed that in tumors with higher texture heterogeneity on CT scans, time to progression was significantly lower than those with lower peritumoral heterogeneity, in NSCLC patients treated with chemotherapy [41].
Our study showed that most predictive radiomic features that could discriminate responders from non-responders, could also predict overall survival and time to recurrence in NSCLC patients treated with trimodality therapy. To the best of our knowledge, our group is the first to highlight such an association and these results have not been previously reported. Although beyond the scope of this study, it would be interesting to probe the morphological and/or molecular basis for the identified peritumoral radiomic features. One plausible hypothesis could be that these features are reflective of patterns relating to hypoxic tumors that are known to be chemoresistant [42]. There is evidence suggesting that hypoxic tumor environment (suffering from oxygen deprivation) can cause irregularity in angiogenesis and blood vessels, which may be detected by texture analysis of nodules extracted from CT images [43 – 45]. It is also possible that radiomic features extracted from peritumoral regions capture microvessel density (MVD) and infiltration of tumor lymphocytes (TILs), which may predict response to chemotherapy [37, 46, 47, 48]. Vascular invasion and neovascularization may also result in diminished accessibility of the chemotherapeutic drugs to the tumor site and hence result in poor survival. It may be that the textural patterns within the peri-nodular regions reflect phenotypic changes associated with vascular invasion and neovascularization, but this association will need to be validated in a future study.
Additionally, our experiment showed that a standard convolution kernel-based radiomics signature had a better prognostic and diagnostic performance compared to a sharp convolution kernel-based CT, in the testing set.
We acknowledge the limitations of our study. Single institution design of our study raises the question of the generalizability of the classifier. In addition, relatively small cohort size and retrospective nature, limits its clinical applicability. Although the size of our cohorts, both training and testing set are equivalent to other recently published studies [20, 21], external validation in large, multi-site prospective cohorts is required. Further work is needed to perform an extensive stratified analyses for molecular and mutational status of the tumors.
Since the study was conducted over a period of 10 years, we realize that there is heterogeneity in the treatments delivered to the patient cohort. No association was however found between radiation dose, cycles of chemotherapy or other treatment characteristics and pathological response. Thus, we believe the data presented here remains valid despite treatment heterogeneity. Additionally, previous studies have investigated the influence of convolution kernels, reconstruction algorithms and slice thickness on radiomic features for characterization of CT lung nodules [49]. While we tried to study the effect of slice thickness and reconstruction kernels, we did not explicitly consider the influence of other parameters on the extracted texture features in the work presented. A very recent study also showed that deep learning networks may be used for mortality risk stratification based on standard-of-care CT images from NSCLC patients [50]. We hope to address these limitations in future works. Additional multi-site independent validation of these quantitative image-based biomarkers is warranted for better selection of patients for a more aggressive trimodality approach.
5. Conclusion
In conclusion, our study revealed that texture and shape features extracted from intratumoral and peritumoral region of lung tumors on CT images can identify patients with pathological response to chemoradiation. Our results point towards a promising role of radiomics in complementing existing clinical and radiological information in better patient selection, hopefully resulting in meaningful clinical benefit from trimodality approach in locally advanced NSCLC.
Supplementary Material
Highlights.
Tumoral heterogeneity is associated with more aggressive tumor phenotype.
Stage III N2 non-small cell lung cancer is a heterogeneous disease.
Major pathologic response is associated with amended overall survival, following NAC.
Compared to clinicopathologic variables, texture features are associated with MPR.
Predictive features to MPR are also associated with survival and time to recurrence.
6. Acknowledgements and Author contributions
Guarantor of integrity of entire study, A.M.; study concepts/study design or data acquisition or data analysis/interpretation, all authors; manuscript drafting or manuscript revision for important intellectual content, M.K., P.J.; manuscript final version approval, all authors; literature research, M.K., A.M.; clinical studies, V.V., P.J.; statistical analysis, M.K., P.F; and manuscript editing, all authors. M.K., P.J. contributed equally to this manuscript.
Funding
Research reported in this publication was supported by the National Cancer Institute of the National Institutes of Health under award numbers 1U24CA199374-01, R01CA202752-01A1, R01CA208236-01A1, R01CA216579-01A1 and R01 CA220581-01A1. National Center for Research Resources under award number 1 C06 RR12463-01. VA Merit Review Award IBX004121A from the United States Department of Veterans Affairs Biomedical Laboratory Research and Development Service, the DOD Prostate Cancer Idea Development Award (W81XWH-15-1-0558), the DOD Lung Cancer Investigator-Initiated Translational Research Award (W81XWH-18-1-0440), the DOD Peer Reviewed Cancer Research Program (W81XWH-16-1-0329), the Ohio Third Frontier Technology Validation Fund the Wallace H. Coulter Foundation Program in the Department of Biomedical Engineering and the Clinical and Translational Science Award Program (CTSA) at Case Western Reserve University.
The content is solely the responsibility of the authors and does not necessarily represent the official views of the National Institutes of Health, the U.S. Department of Veterans Affairs, the Department of Defense, or the United States Government.
Footnotes
Publisher's Disclaimer: This is a PDF file of an unedited manuscript that has been accepted for publication. As a service to our customers we are providing this early version of the manuscript. The manuscript will undergo copyediting, typesetting, and review of the resulting proof before it is published in its final citable form. Please note that during the production process errors may be discovered which could affect the content, and all legal disclaimers that apply to the journal pertain.
Conflict of interests
Vamsidhar Velcheti is a Consultant for Clovis Oncology, Genentech, Bristol-Myers Squibb, Merck, Celgene, Foundation Medicine, AstraZeneca/MedImmune and Genoptix. He has received research funding from Genentech, Trovagene, Eisai, OncoPlex Diagnostics, Alkermes, NantOmics, Genoptix, Altor BioScience, Merck, Bristol-Myers Squibb, Atreca, Heat Biologics and Leap Therapeutics.
Anant Madabhushi is an equity holder in Elucid Bioimaging and in Inspirata Inc. He is also a scientific advisory consultant for Inspirata Inc and also sits on its scientific advisory board. He is also an equity holder in Inspirata Inc. Additionally his technology has been licensed to Elucid Bioimaging and Inspirata Inc. He is also involved in a NIH U24 grant with PathCore Inc. Part of his research work is sponsored by Philips.
References
- 1.Albain KS, et al. , Radiotherapy plus chemotherapy with or without surgical resection for stage III non-small-cell lung cancer: a phase III randomised controlled trial. Lancet, 2009. 374(9687): p. 379–86. [DOI] [PMC free article] [PubMed] [Google Scholar]
- 2.Ettinger DS, et al. , Non-Small Cell Lung Cancer, Version 6.2015. J Natl Compr Canc Netw, 2015. 13(5): p. 515–24. [DOI] [PubMed] [Google Scholar]
- 3.van Meerbeeck JP, et al. , Randomized controlled trial of resection versus radiotherapy after induction chemotherapy in stage IIIA-N2 non-small-cell lung cancer. J Natl Cancer Inst, 2007. 99(6): p. 442–50. [DOI] [PubMed] [Google Scholar]
- 4.Pataer A, et al. , Histopathologic response criteria predict survival of patients with resected lung cancer after neoadjuvant chemotherapy. J Thorac Oncol, 2012. 7(5): p. 825–32. [DOI] [PMC free article] [PubMed] [Google Scholar]
- 5.Hellmann MD, et al. , Pathological response after neoadjuvant chemotherapy in resectable non-small-cell lung cancers: proposal for the use of major pathological response as a surrogate endpoint. Lancet Oncol, 2014. 15(1): p. e42–50. [DOI] [PMC free article] [PubMed] [Google Scholar]
- 6.Betticher DC, et al. , Prognostic factors affecting long-term outcomes in patients with resected stage IIIA pN2 non-small-cell lung cancer: 5-year follow-up of a phase II study. Br J Cancer, 2006. 94(8): p. 1099–106. [DOI] [PMC free article] [PubMed] [Google Scholar]
- 7.Coroller TP, et al. , Radiomic phenotype features predict pathological response in non-small cell lung cancer. Radiother Oncol, 2016. 119(3): p. 480–6. [DOI] [PMC free article] [PubMed] [Google Scholar]
- 8.Fried DV, et al. , Prognostic value and reproducibility of pretreatment CT texture features in stage III non-small cell lung cancer. Int J Radiat Oncol Biol Phys, 2014. 90(4): p. 834–42. [DOI] [PMC free article] [PubMed] [Google Scholar]
- 9.Ganeshan B, et al. , Tumour heterogeneity in non-small cell lung carcinoma assessed by CT texture analysis: a potential marker of survival. Eur Radiol, 2012. 22(4): p. 796–802. [DOI] [PubMed] [Google Scholar]
- 10.Lee G, et al. , Radiomics and its emerging role in lung cancer research, imaging biomarkers and clinical management: State of the art. Eur J Radiol, 2017. 86: p. 297–307. [DOI] [PubMed] [Google Scholar]
- 11.Parmar C, et al. , Radiomic feature clusters and prognostic signatures specific for Lung and Head & Neck cancer. Sci Rep, 2015. 5: p. 11044. [DOI] [PMC free article] [PubMed] [Google Scholar]
- 12.Song J, et al. , Non-small cell lung cancer: quantitative phenotypic analysis of CT images as a potential marker of prognosis. Sci Rep, 2016. 6: p. 38282. [DOI] [PMC free article] [PubMed] [Google Scholar]
- 13.Thawani R, et al. , Radiomics and radiogenomics in lung cancer: A review for the clinician. Lung Cancer, 2018. 115: p. 34–41. [DOI] [PubMed] [Google Scholar]
- 14.Yoon SM, Shaikh T, and Hallman M, Therapeutic management options for stage III non-small cell lung cancer. World J Clin Oncol, 2017. 8(1): p. 1–20. [DOI] [PMC free article] [PubMed] [Google Scholar]
- 15.Braman NM, et al. , Intratumoral and peritumoral radiomics for the pretreatment prediction of pathological complete response to neoadjuvant chemotherapy based on breast DCE-MRI. Breast Cancer Res, 2017. 19(1): p. 57. [DOI] [PMC free article] [PubMed] [Google Scholar]
- 16.Guo W, et al. , Prediction of clinical phenotypes in invasive breast carcinomas from the integration of radiomics and genomics data. J Med Imaging (Bellingham), 2015. 2(4): p. 041007. [DOI] [PMC free article] [PubMed] [Google Scholar]
- 17.Prasanna P, Tiwari P, and Madabhushi A, Co-occurrence of Local Anisotropic Gradient Orientations (CoLlAGe): A new radiomics descriptor. Sci Rep, 2016. 6: p. 37241. [DOI] [PMC free article] [PubMed] [Google Scholar]
- 18.Lubner MG, et al. , CT textural analysis of hepatic metastatic colorectal cancer: pre-treatment tumor heterogeneity correlates with pathology and clinical outcomes. Abdom Imaging, 2015. 40(7): p. 2331–7. [DOI] [PubMed] [Google Scholar]
- 19.Kickingereder P, et al. , Radiomic subtyping improves disease stratification beyond key molecular, clinical and standard imaging characteristics in patients with glioblastoma. Neuro Oncol, 2017. [DOI] [PMC free article] [PubMed] [Google Scholar]
- 20.Ravanelli M, et al. , Texture analysis of advanced non-small cell lung cancer (NSCLC) on contrastenhanced computed tomography: prediction of the response to the first-line chemotherapy. Eur Radiol, 2013. 23(12): p. 3450–5. [DOI] [PubMed] [Google Scholar]
- 21.Fave X, et al. , Delta-radiomics features for the prediction of patient outcomes in non-small cell lung cancer. Sci Rep, 2017. 7(1): p. 588. [DOI] [PMC free article] [PubMed] [Google Scholar]
- 22.Pelletier MP, et al. , Prognostic markers in resectable non-small cell lung cancer: a multivariate analysis. Can J Surg, 2001. 44(3): p. 180–8. [PMC free article] [PubMed] [Google Scholar]
- 23.Gabor S, et al. , Invasion of blood vessels as significant prognostic factor in radically resected T1-3N0M0 non-small-cell lung cancer. Eur J Cardiothorac Surg, 2004. 25(3): p. 439–42. [DOI] [PubMed] [Google Scholar]
- 24.Mohiuddin K, et al. , Relationship between margin distance and local recurrence among patients undergoing wedge resection for small (</=2 cm) non-small cell lung cancer. J Thorac Cardiovasc Surg, 2014. 147(4): p. 1169–75; discussion 1175-7. [DOI] [PubMed] [Google Scholar]
- 25.Wan T, Bolch BN, Plecha D, et al. A Radio-genomics Approach for Identifying High Risk Estrogen Receptor-positive Breast Cancers on DCE-MRI: Preliminary Results in Predicting OncotypeDX Risk Scores. Sci Rep. 2016; 6: 21394. [DOI] [PMC free article] [PubMed] [Google Scholar]
- 26.Beig N, Khorrami M, Alilou M, Perinodular and Intranodular Radiomic Features on Lung CT Images Distinguish Adenocarcinomas from Granulomas. Radiology. 2019. March;290(3):783–792. [DOI] [PMC free article] [PubMed] [Google Scholar]
- 27.Orooji Mahdi, Alilou Mehdi and et al. , “Combination of computer extracted shape and texture features enables discrimination of granulomas from adenocarcinoma on chest computed tomography,” J. Med. Imag. 5(2) 024501. [DOI] [PMC free article] [PubMed] [Google Scholar]
- 28.Zhao B, et al. , Evaluating variability in tumor measurements from same-day repeat CT scans of patients with non-small cell lung cancer. Radiology, 2009. 252(1): p. 263–72. [DOI] [PMC free article] [PubMed] [Google Scholar]
- 29.Coroller TP, et al. , Radiomic-Based Pathological Response Prediction from Primary Tumors and Lymph Nodes in NSCLC. J Thorac Oncol, 2017. 12(3): p. 467–476. [DOI] [PMC free article] [PubMed] [Google Scholar]
- 30.Aerts H, Grossmann P, et al. Defining a Radiomic Response Phenotype: A Pilot Study using targeted therapy in NSCLC. Scientific Reports volume 6, Article number: 33860 (2016). [DOI] [PMC free article] [PubMed] [Google Scholar]
- 31.Rios Velazquez E, Parmar C, Liu Y, et al. Somatic Mutations Drive Distinct Imaging Phenotypes in Lung Cancer. Cancer Res. 2017;77(14):3922–3930. [DOI] [PMC free article] [PubMed] [Google Scholar]
- 32.Vickers AJ, Elkin EB. Decision curve analysis: a novel method for evaluating prediction models. Med Decis Making 2006;26(6):565–574. [DOI] [PMC free article] [PubMed] [Google Scholar]
- 33.Lee CK, Kim S, et al. Next-generation sequencing reveals novel resistance mechanisms and molecular heterogeneity in EGFR-mutant non-small cell lung cancer with acquired resistance to EGFR-TKIs. Lung Cancer. 2017. November;113:106–114. [DOI] [PubMed] [Google Scholar]
- 34.McGranahan N, Swanton C. Clonal Heterogeneity and Tumor Evolution: Past, Present, and the Future. Cell. 2017. February 9;168(4):613–628. [DOI] [PubMed] [Google Scholar]
- 35.Mattonen SA, et al. , Detection of Local Cancer Recurrence After Stereotactic Ablative Radiation Therapy for Lung Cancer: Physician Performance Versus Radiomic Assessment. Int J Radiat Oncol Biol Phys, 2016. 94(5): p. 1121–8. [DOI] [PubMed] [Google Scholar]
- 36.Kozak MM, et al. , Tumor Volume as a Potential Imaging-Based Risk-Stratification Factor in Trimodality Therapy for Locally Advanced Non-small Cell Lung Cancer. Journal of Thoracic Oncology. 6(5): p. 920–926. [DOI] [PubMed] [Google Scholar]
- 37.Huang Y, et al. , Radiomics Signature: A Potential Biomarker for the Prediction of Disease-Free Survival in Early-Stage (I or II) Non-Small Cell Lung Cancer. Radiology, 2016. 281(3): p. 947–957. [DOI] [PubMed] [Google Scholar]
- 38.Campbell PJ, et al. , The patterns and dynamics of genomic instability in metastatic pancreatic cancer. Nature, 2010. 467(7319): p. 1109–13. [DOI] [PMC free article] [PubMed] [Google Scholar]
- 39.Lambin P, et al. , Radiomics: extracting more information from medical images using advanced feature analysis. Eur J Cancer, 2012. 48(4): p. 441–6. [DOI] [PMC free article] [PubMed] [Google Scholar]
- 40.Grove O, Berglund AE, Schabath MB, et al. Quantitative computed tomographic descriptors associate tumor shape complexity and intratumor heterogeneity with prognosis in lung adenocarcinoma. PLoS One. 2015;10(3):e0118261. [DOI] [PMC free article] [PubMed] [Google Scholar]
- 41.Khorrami M, Khunger M, Zagouras A, et al. Combination of Peri- and Intratumoral Radiomic Features on Baseline CT Scans Predicts Response to Chemotherapy in Lung Adenocarcinoma. Radiology AI. 2019. Vol. 1, No. 2 10.1148/ryai.2019180012. [DOI] [PMC free article] [PubMed] [Google Scholar]
- 42.Semenza GL, HIF-1 and tumor progression: pathophysiology and therapeutics. Trends Mol Med, 2002. 8(4 Suppl): p. S62–7. [DOI] [PubMed] [Google Scholar]
- 43.Jain RK, Normalization of tumor vasculature: an emerging concept in antiangiogenic therapy. Science, 2005. 307(5706): p. 58–62. [DOI] [PubMed] [Google Scholar]
- 44.Nelson DA, et al. , Hypoxia and defective apoptosis drive genomic instability and tumorigenesis. Genes Dev, 2004. 18(17): p. 2095–107. [DOI] [PMC free article] [PubMed] [Google Scholar]
- 45.Ganeshan B, et al. Non-small cell lung cancer: histopathologic correlates for texture parameters at CT. Radiology. 2013;266:326–336. doi: 10.1148/radiol.12112428. [DOI] [PubMed] [Google Scholar]
- 46.Geng Y, et al. , Prognostic Role of Tumor-Infiltrating Lymphocytes in Lung Cancer: a Meta-Analysis. Cellular Physiology and Biochemistry, 2015. 37(4): p. 1560–1571. [DOI] [PubMed] [Google Scholar]
- 47.Zhao YY, et al. , Predictive value of intratumoral microvascular density in patients with advanced non-small cell lung cancer receiving chemotherapy plus bevacizumab. J Thorac Oncol, 2012. 7(1): p. 71–5. [DOI] [PubMed] [Google Scholar]
- 48.Zhang BC, et al. , Peritumoral lymphatic microvessel density is related to poor prognosis in lung adenocarcinoma: A retrospective study of 65 cases. Exp Ther Med, 2012. 3(4): p. 636–640. [DOI] [PMC free article] [PubMed] [Google Scholar]
- 49.He L, Huang Y, Ma Z, Liang C, Liang C, Liu Z. Effects of contrast-enhancement, reconstruction slice thickness and convolution kernel on the diagnostic performance of radiomics signature in solitary pulmonary nodule. Sci Rep. 2016;6:34921 Published 2016 Oct 10. [DOI] [PMC free article] [PubMed] [Google Scholar]
- 50.Hosny A, Parmar C, Coroller TP, Deep learning for lung cancer prognostication: A retrospective multi-cohort radiomics study. PLoS Med. 2018. November 30;15(11):e1002711. [DOI] [PMC free article] [PubMed] [Google Scholar]
Associated Data
This section collects any data citations, data availability statements, or supplementary materials included in this article.