

Abstract
Background
Sirtuin 1 (SIRT1) is a NAD+ sensitive deacetylase that has been linked to longevity and has been suggested to confer beneficial effects that counter aging‐associated deterioration. Muscle repair is dependent upon satellite cell function, which is reported to be reduced with aging; however, it is not known if this is linked to an aging‐suppression of SIRT1. This study tested the hypothesis that Sirtuin 1 (SIRT1) overexpression would increase the extent of muscle repair and muscle function in older mice.
Methods
We examined satellite cell dependent repair in tibialis anterior, gastrocnemius, and soleus muscles of 13 young wild‐type mice (20–30 weeks) and 49 older (80+ weeks) mice that were controls (n = 13), overexpressed SIRT1 in skeletal muscle (n = 14), and had a skeletal muscle SIRT1 knockout (n = 12) or a satellite cell SIRT1 knockout (n = 10). Acute muscle injury was induced by injection of cardiotoxin (CTX), and phosphate‐buffered saline was used as a vector control. Plantarflexor muscle force and fatigue were evaluated before or 21 days after CTX injection. Satellite cell proliferation and mitochondrial function were also evaluated in undamaged muscles.
Results
Maximal muscle force was significantly lower in control muscles of older satellite cell knockout SIRT1 mice compared to young adult wild‐type (YWT) mice (P < 0.001). Mean contraction force at 40 Hz stimulation was significantly greater after recovery from CTX injury in older mice that overexpressed muscle SIRT1 than age‐matched SIRT1 knockout mice (P < 0.05). SIRT1 muscle knockout models (P < 0.05) had greater levels of p53 (P < 0.05 MKO, P < 0.001 OE) in CTX‐damaged tissues as compared to YWT CTX mice. SIRT1 overexpression with co‐expression of p53 was associated with increased fatigue resistance and increased force potentiation during repeated contractions as compared to wild‐type or SIRT1 knockout models (P < 0.001). Muscle structure and mitochondrial function were not different between the groups, but proliferation of satellite cells was significantly greater in older mice with SIRT1 muscle knockout (P < 0.05), but not older SIRT1 satellite cell knockout models, in vitro, although this effect was attenuated in vivo after 21 days of recovery.
Conclusions
The data suggest skeletal muscle structure, function, and recovery after CTX‐induced injury are not significantly influenced by gain or loss of SIRT1 abundance alone in skeletal muscle; however, muscle function is impaired by ablation of SIRT1 in satellite cells. SIRT1 appears to interact with p53 to improve muscle fatigue resistance after repair from muscle injury.
Keywords: Muscle atrophy, Skeletal muscle, Mitochondrial function, Satellite cells, Muscle force, Fatigue, Sarcopenia
Introduction
Sarcopenia is the age‐associated wasting of skeletal muscle which results in a loss of function.1 Sarcopenia is accompanied by an increased risk for physical disabilities, fall‐induced injuries, hospitalization/institutionalization, and mortality,2 and it is exacerbated by obesity and metabolic disorders.3 Mitochondria regulate muscle metabolism and mitochondrial dysfunction may play a role in sarcopenia.4 Indeed, altered size and granularity have been observed in aging mitochondria, 5, 6 as well as in the mitochondria of subjects diagnosed with type 2 diabetes mellitus.7 Concordantly, loss of mitochondrial function also occurs with aging and metabolic disorders,8 although some research suggests age‐associated alterations in mitochondrial morphology are independent of lifespan.9 It is interesting that the highly oxidative type I muscle fibres, which have ~6% mitochondria volume,10 are generally thought to be more resistant to sarcopenia‐related muscle wasting than type II fibres11 which have ~3% mitochondria volume density.10 This might be due in part to a greater sensitivity of mitochondria in type II fibres to oxidative stress.12 Preserving mitochondrial function is therefore a potential strategy for reducing sarcopenia in both fibre types.
Sirtuin 1 (SIRT1) is a class III histone deacetylase13 which is dependent on NADH to deacetylate its targets, making SIRT1 highly sensitive to changes in metabolism. SIRT1 has been identified as a link between caloric restriction and longevity, with the overexpression of SIRT1 linked to increased lifespans for several organism models.14 Furthermore, SIRT1 has also been shown to inhibit type I fibre atrophy during intermittent fasting, by deacetylating and inhibiting the transcription activity of FoxO1 and FoxO3.15 In addition, activating SIRT1 in muscle cells prevents the reduction in slower fibre type myosin heavy chain (MHC) gene expression and prevents myotube wasting after glucose.16, 17 Importantly, SIRT1 has been identified as a regulator of protein peroxisome proliferator activated receptor gamma coactivator 1α (PGC1α),18 which is a well‐established regulator of mitochondrial biogenesis and glycolytic‐to‐oxidative fibre type switching in mammalian skeletal muscle.19 PGC‐1α activation (i.e. deacetylation) occurs via AMPK activation of the deacetylase SIRT1.20 In fact, SIRT1 deacetylation of PGC‐1α increases the expression of key glucose and lipid metabolism genes.21 However, mitochondrial biogenesis in response to exercise is not impaired under SIRT1 knock out conditions, and therefore, SIRT1 deacetylation is thought to be via the control of acetyltransferase GCN5.22
Satellite cell dysfunction is another potential contributor to muscle loss in sarcopenia.23 Satellite cells are mononucleated muscle stem cells that are responsible for the majority of muscle regeneration after injury.24, 25 Both the expression of SIRT1 and satellite cell populations have been shown to decrease with aging,26 inviting the possibility that increasing SIRT1 expression in older muscle models might act as a countermeasure to preserve muscle regenerative capacity and therefore improve muscle function after muscle injury in aging. Consistent with this idea, resistance exercise coupled with consuming resveratrol, a known activator of SIRT1, increased satellite cell proliferation and improved muscle fibre size and function in muscles of older humans to a greater extent than resistance exercise alone.27 Furthermore, resveratrol also prevents cell death and increases differentiation of myotubes,28 whereas SIRT1 silencing evokes greater cell death and reduced differentiation.28 In addition, SIRT1 was reported to maintain pools of satellite cells in the state of quiescence, and SIRT1 loss of function was reported to invoke premature differentiation of muscle satellite cells.29 Strengthening this argument, mild endurance exercise which increased SIRT1 was shown to rescue an aging‐induced reduction in satellite cell numbers in rats.26, 30 However, other studies have shown differential patterns of SIRT1 expression according to age and tissue type,31 calling into question whether aging has universal effects on SIRT1. Thus, there is a need to further study the role of SIRT1 on mitochondrial function and satellite cell regulation of muscle repair in the context of muscle sarcopenia.
The purpose of this study was to investigate the role of SIRT1 in repairing muscle and restoring skeletal muscle function after acute muscle damage in older mice. Our hypothesis was that muscle overexpression of SIRT1 improves mitochondrial function and satellite cell activation, which improves muscle repair and function after acute injury, and in contrast, loss of SIRT1 in muscle or satellite cells of older mice reduces muscle repair and function after injury by suppressing satellite cell activation and reducing mitochondrial function. Contrary to our expectation, we found that muscle performance and the recovery of skeletal muscle after injury are largely unaffected by the abundance of SIRT1 in skeletal muscle, but ablation of SIRT1 in satellite cells impairs muscle repair and function. Nevertheless, SIRT1 abundance may work synergistically with p53 to reduce muscle fatigue after repair following muscle injury.
Materials and methods
Research design
Two separate experiments were conducted on the five groups of mice. Three to five mice were examined in each age group for each experimental comparison. In the first experiment, the plantarflexor muscles (gastrocnemius and soleus muscles) received an acute cardiotoxin (CXT)‐induced injury. Plantarflexor force and fatigue were measured before and then again after 21 days of recovery following CTX injury to assess the degree that manipulation of SIRT1 protein abundance had on muscle function and recovery/repair from muscle damage. In a separate study, the plantarflexor muscles and the dorsiflexor [tibialis anterior (TA)] muscles from mice in each of the five groups received a CTX injection to induce acute muscle injury. These muscles were used to assess the role of SIRT1 on muscle structure solely. As there was the potential that electrical stimulation to induce evoked contractions could affect muscle fibre size or structure acutely, we did not assess muscle function in this second study.
Animal models
Five mouse models were examined. These included (i) young wild‐type (YWT) mice that were 20–30 weeks of age, (ii) older wild‐type mice that were 80–120 weeks of age (WT‐80), (iii) SIRT1 overexpressor older mice that were 80–120 weeks of age (OE‐80), (iv) SIRT1 older adult skeletal‐muscle knockout mice that were 80–120 weeks of age (MKO‐80), and (v) SIRT1 satellite cell knockout mice that were 80–120 weeks of age (SKO‐80). As ~50% of the animals died before they were 120 weeks of age, we chose to include older animals that were 80 weeks of age in our oldest group because this is at a point where muscle signalling changes and muscle atrophy and function begins to deteriorate.32, 33 While these animals could not yet be considered to be old, this group had mice that ranged in age from 80–120 weeks, and the oldest animals in this group would be considered old. Therefore, we have chosen to describe this combined group as ‘older’. All wild‐type mice were generated from C57BL/6J background mice purchased from Jackson Laboratories, USA. MKO‐80 and SKO‐80 mice were generated using the cre‐lox system by crossing B6;129‐Sirt1tm1Ygu/J mice containing loxP sites directing the removal of exon 4 of SIRT1 with MCK‐cre expressing B6.FVB(129S4)‐Tg (Ckmm‐cre)5Khn/J and PAX7‐cre expressing Pax7tm1(cre)Mrc/J mice, respectively. Mice that overexpressed SIRT1 were generated from B6.Cg‐Tg (SIRT1)ASrn/J mice containing a wild‐type mouse SIRT1 gene promoted by an endogenous bacterial artificial chromosome (BAC) transgene.
Cardiotoxin‐induced acute muscle injury
Acute muscle injury was induced by injecting the gastrocnemius, soleus, and TA muscles with 10 μM CTX (Naja mosambica; Sigma, St. Louis MO, USA)34 in 150 μL of phosphate‐buffered saline (PBS). The contralateral limb was injected with 150 μL of PBS as a vehicle control. Cage control recovery occurred for 21 days post‐injection. During recovery, mice were given water containing 0.8 mg/mL of 5‐bromo‐2′‐deoxyuridine (BrdU) (MP Biomedicals) to identify satellite cells that achieved DNA synthesis over the recovery period as previously used in our lab.24 Post‐recovery, the experimental groups were euthanized by myocardial extraction under heavy anaesthesia. The muscles were then immediately collected and frozen in 2‐methylbutane (ThermoFisher Scientific, Pittsburgh PA, USA) chilled by liquid nitrogen. Frozen tissue sections were mounted on corkboard with Tissue Tek O.C.T. compound (ThermoFisher Scientific, Pittsburgh PA, USA).
BrdU immunohistochemistry
Frozen tissue sections of control and post‐CTX injured muscles were obtained with a Leica model CM3050S cryostat, and the tissue was mounted on charged glass slides (ThermoFisher Scientific, Pittsburgh PA, USA). The frequency of muscle nuclei that were BrdU positive were measured as previously described by our lab.24 Briefly, the slides were fixed at room temperature with 1:1 methanol:acetone (ThermoFisher Scientific, Pittsburgh PA, USA) and then permeabilized with PBS in 0.4% Triton X‐100. Slides were then washed with PBS and allowed to incubate in 2 M hydrochloric acid (ThermoFisher Scientific, Pittsburgh PA, USA) for 1 h at room temperature, followed by neutralization in 0.1 M Borate Buffer (pH 8.5). The tissue sections were blocked with 10% normal goat serum (Vector Laboratories, Burlingame, CA, USA) and incubated overnight in primary antibodies targeting BrdU (1:100, Developmental Studies Hybridoma Bank, Iowa City, IA, USA). Secondary antibodies targeting IgG1 (AlexaFluor‐488, Invitrogen‐ThermoFisher Scientific, Carlsbad CA, USA) were used for fluorescent imaging of BrdU+ nuclei. Images were captured with a Nikon E800 microscope. BrdU+ cells were quantified using ImageJ software (National Institutes of Health, Bethesda, Maryland). BrdU+ labelled nuclei were quantified if they could be clearly associated with either the periphery or interior of a muscle fibre. All of the nuclei from six nonoverlapping fields were quantified with light microscopy at an objective magnification of 40×. There were two repeats for each biological section and the data averaged for each section. The BrdU labelling index was expressed as a percent of the total nuclei and determined by: (the number of BrdU‐positive nuclei associated with muscle fibres)/(labelled unlabelled nuclei associated with muscle fibres). Data are presented as mean ± standard deviation.
Fibre‐type immunohistochemistry
Muscle fibre types were identified using antibodies to MHCs as previously reported by Bloemberg and Quadrilatero,35 with slight modifications as reported by our lab.24 Briefly, isolated muscles were flash frozen in 2‐methylbutane chilled by liquid nitrogen and mounted on corkboard with Tissue Tek O.C.T. compound (ThermoFisher Scientific, Pittsburgh PA, USA). Muscle tissue cross sections were obtained at −20°C with a Leica model CM3050S cryostat. Tissue sections were blocked with normal goat serum (Vector Labs, Burlingame, CA, USA) and stained with primary antibodies targeting MHC I (BA‐F8S), MHC IIa (SC‐71), and MHC IIb (BF‐F3), at a 1:100 dilution overnight at 4°C in a humidified chamber. Primary antibodies were obtained from the Developmental Studies Hybridoma Bank, Iowa City, IA USA. After washing with PBS, the slides were incubated in secondary antibodies at a 1:500 dilution for 2 h at room temperature. Secondary antibodies targeting IgG2b (AlexaFluor‐647), IgGM (AlexaFluor‐546), and IgG1 (AlexaFluor‐488) were obtained from Invitrogen‐ThermoFisher Scientific, Carlsbad CA, USA, and were used for fluorescent imaging. Images were captured with a Nikon E800 microscope. Fibre cross‐sectional areas (CSA) were determined by planimetry from a minimum of 500 fibres taken from 8–12 randomly selected fields from the tissue cross sections. All the fibres encompassed in a field were traced. Mean fibre area was calculated using ImageJ software (National Institutes of Health, Bethesda, Maryland). The cross‐sectional images were captured with a Nikon E800 microscope. Whole muscle CSA was determined by tracing the entire circumference of the muscle section if the section could be captured as a single image, or otherwise as the summation of total muscle area traced from a composite picture. Type I fibre CSA was determined by individually tracing all fluorescently labelled fibres within a given section, with (n = 3) muscle sections per group.
Satellite cell isolation
To evaluate the role of SIRT1 on the potential for repair during aging, mononuclear muscle cells were isolated from the combined muscle mass of control non‐CTX injured mouse TA and quadriceps muscles from both hindlimbs using the protocol of Pasut, and colleagues36 with some modifications. Briefly, muscle samples were cut into small sections and incubated in 1500 U collagenase type II (Worthington Biochemical, USA) in Dulbecco's modified Eagle's medium (DMEM) +10% horse serum, followed by incubation in 300 U collagenase type II with 6 U dispase (Gibco, Invitrogen, Gaithersburg, MD, USA) in DMEM +10% horse serum. After trituration, muscle supernatants were collected and filtered through 40 μm cell strainers (ThermoFisher Scientific, Pittsburgh PA, USA). Aliquots of isolated mononuclear cells were then washed in PBS‐azide and blocked in 10% normal goat serum (Vector Labs, Burlingame, CA, USA). Satellite cells were separated from the muscle mononuclear cells by labelling the cells with fluorophore‐conjugated primary antibodies as modified from methods described by Liu et al.37 Briefly, isolated mononuclear cells were labelled with fluorophore‐conjugated primary antibodies for the following cell surface markers: CD31 (‐APC), Sca‐1 (‐PacBlue), CD45 (‐PE‐Cy7), and VCAM‐1 (‐Biotin) (BioLegend, San Diego, CA, USA). A second incubation was used to bind Rhodamine‐conjugated avidin (Vector Labs, Burlingame, CA, USA) to the biotin‐conjugated antibody. After washing, the fluorophore‐conjugated cells were resuspended in foetal bovine serum and VCAM+/CD31−/CD45−/Sca‐1− satellite cells were isolated by a FACSCalibur flow cytometer equipped with a 15‐molecular weight (MW) 488 nm argon laser and 633 nm red diode laser (Becton and Dickinson). All flow cytometric measurements were performed in conjunction with the West Virginia University Flow Cytometry Core Facility.
Protein immunoprecipitation assays
Immunoprecipitation of selected proteins from cell lysates was conducted as previously reported.38 Briefly, muscle cells were fractionated by the method described by Rothermel et al.39 Protein isolates from skeletal muscles were incubated for 1 h at 4°C with 25 μL of Pierce Protein A/G magnetic beads (ThermoFisher Scientific, Pittsburgh PA, USA) to reduce non‐specific binding. Clean antigen solutions were then incubated for 2 h at 4°C with an anti‐PGC1α primary antibody (Santa Cruz Biotech. Sant Cruz, CA, USA). Pre‐cleaned Protein A/G beads were next added to the antigen/antibody mixture and allowed to incubate overnight at 4°C. After the incubation, the Protein A/G beads were collected with a magnetic apparatus and the supernatant was discarded. After washing, the magnetic beads were again collected, and the precipitated proteins were eluted with a 1× NuPAGE LDS sample buffer (ThermoFisher Scientific, Pittsburgh PA, USA) for 20 min at room temperature. Protein concentrations of samples were determined by the Lowry method, and the purity of each fraction was confirmed as reported previously.40 Forty micrograms of protein were loaded into each well of a 4–12% gradient polyacrylamide gel (Invitrogen, Carlsbad, CA) and separated by routine sodium dodecyl sulfate‐polyacrylamide gel electrophoresis for 1 h at 120 V. The proteins were transferred to a nitrocellulose membrane for 1.5 h at 25 V. Non‐specific protein binding was blocked by incubating the membranes in 5% nonfat milk in Tris‐buffered saline containing 0.05% Tween 20.24, 41, 42
Mitochondrial isolation
To evaluate the effect of SIRT1 on mitochondria, right and left non‐CTX injured hindlimb plantar flexor muscles were collected from YWT and older SIRT1 variant‐expression models, with both hindlimb flexor groups were pooled into a single sample. Collected tissues were washed in PBS (pH 7.4). Subsarcolemmal mitochondria (SSM) and interfibrillar mitochondria (IFM) were isolated as previously described.43, 44 Mitochondrial pellets were resuspended in KME buffer (100 mM KCl, 50 mM MOPS, and 0.5 mM EDTA; pH 7.4) for analysis of mitochondrial enzymatic activity.45, 46
Mitochondrial size, internal complexity, and membrane potential
The size, internal complexity/granulation, and membrane potential of isolated mitochondria were analysed with a FACSCalibur flow cytometer equipped with a 15‐MW 488 nm argon laser and 633 nm red diode laser (Becton and Dickinson, Franklin Lakes, NJ, USA), as previously described.43, 45 The ratiometric dye 5,5′,6,6′‐tetrachloro‐1,1′,3,3′‐tetraethylbenzimidazol carbocyanine iodide (JC‐1; Molecular Probes, Carlsbad, CA) was used to selectively probe and gate for respiring mitochondria47 using 488 nm excitation with 530 and 590 nm bandpass emission filters. A greater concentration of JC‐1 aggregates form as a result of greater mitochondrial uptake, which increases the orange fluorescent emission signal, as opposed to the green fluorescent monomer of JC‐1. The resultant ratio of orange fluorescence (polarized mitochondrial membrane) to green fluorescence (depolarized mitochondrial membrane) was used to characterize membrane potential for isolated mitochondrial subpopulations.
Size and internal complexity/granularity were determined for mitochondrial populations with forward‐scatter (absolute particle size) and side‐scatter (refracted light proportional to mitochondrial granularity) detectors, respectively. All flow cytometric measurements were performed in conjunction with the West Virginia University Flow Cytometry Core Facility.
Mitochondrial electron transport chain complex activities
The activities of mitochondrial complex I, III, and IV and ATP synthase were determined as previously described.43 Complex I and ATP synthase activities were determined separately by measuring the oxidation of NADH at 340 nm, while complex III and complex IV activities were determined separately by measuring the reduction and oxidation of cytochrome c at 550 nm, respectively. Protein content was determined with the Bradford method, and all complex activities were expressed in nanomoles of oxygen consumed per minute per milligram protein.
Muscle force and fatigue
Young wild‐type (YWT) and older SIRT1 variant‐expression mouse models underwent measures to determine plantar flexor force and fatigability to assess the role of SIRT1 on muscle recovery post‐CTX injection. Functional measures were obtained via indirect electric stimulation of the plantar flexor muscles through the tibial nerve and measured with a custom‐built dynamometer (Aurora Scientific, Aurora, Ontario, Canada) as previously described24, 38 with the mice anaesthetised under 2–3% isoflurane.
Electrically evoked contractions (200 μs pulse width) were measured with the mice on a heated plate to maintain body temperature under anaesthesia. Hindlimb ankles were positioned at 90° flexion. The functional assessment began with a three electrically evoked muscle twitches, followed by a 120 s rest. A second stimulation of 75 Hz was then applied to induce tetanus followed by a 300 s rest. This was repeated three times. Finally, a single series of 180 contractions were performed at 40 Hz (330 ms of activation followed by 670 ms of rest) over a span of 180 s. All stimulations were applied to the common peroneal nerve with subcutaneous platinum electrons with 200 μs pulse width, via commercially available stimulator and controlling software provided by Aurora Scientific (Aurora, Ontario, Canada). Mice were checked continually for vitality and responsiveness. After the functional evaluation, the right hindlimb gastrocnemius and soleus muscles were each injected with 100 μL of 10 μM CTX (Naja mosambica) to induce muscle damage34 as described earlier. An equal volume of PBS was injected into the contralateral leg as a vector control. Muscle recovery/repair occurred for 21 days after CTX injection, and then, the plantar flexors were examined using the same physiological evaluation. Immediately following the functional measures, the mice were euthanized by myocardial extraction under heavy anaesthesia, and the hindlimb muscles were collected for analysis.
Proliferation analysis
The proliferation potential of isolated populations of satellite cells was quantified from CTX‐injected and control TA muscles using Click‐iT EdU Alexa Fluor 488 (Invitrogen‐ThermoFisher Scientific, Carlsbad CA, USA). Briefly, satellite cells were isolated from TA muscles as described earlier. The isolated cells were then resuspended in growth medium DMEM (high glucose, L‐glutamine) with 20% foetal bovine serum, 10% horse serum, and 1% antibiotic/antimycotic (Gibco, Invitrogen, Gaithersburg, MD, USA) and plated overnight on glass coverslips coated in 0.2% gelatin. Plated satellite cells were then incubated for 1 h in 10 μM EdU in DMEM. After incubation, the cells were fixed in 1 mL of 3.7% formaldehyde in PBS for 15 min at room temperature and then washed twice with 1 mL of 3% bovine serum albumin in PBS. The cells were then permeabilized in 1 mL of 0.5% Triton X‐100 in PBS for 20 min. After a second wash in PBS +3% bovine serum albumin, cells were treated with 500 μL of reaction buffer, consisting of copper sulfate, the Alexa Fluor‐conjugated azide, and sodium ascorbate, and then allowed to incubate for 30 min at room temperature, protected from light. The cells then underwent a final wash and were transferred to microscope slides for analysis with a Nikon E800 microscope. Coefficients of proliferation were calculated as the number of illuminated cells counted on nine separate fields divided by the number of cells plated. Experiments were run in triplicate and are presented as the mean ± standard deviation.
Western blot analysis
Skeletal muscle lysates were analysed with Western immunoblots as previously described,24, 38, 41, 42 with slight modifications. Sodium dodecyl sulfate‐polyacrylamide gel electrophoresis was run on 4–12% gradient NuPAGE Bis‐Tris gels (ThermoFisher Scientific, Pittsburgh PA, USA) at 120 V for 2 h in NuPAGE MES SDS buffer (ThermoFisher Scientific, Pittsburgh PA, USA). Proteins were transferred to a nitrocellulose membrane for 1 h at 15 V with a Trans‐Blot SD semi‐dry transfer cell (Bio‐Rad). All proteins were probed at the same time from the same samples, requiring only GAPDH loading control. Membranes were then carefully cut to separate the proteins based on protein MW to allow for the simultaneous probing of multiple different proteins for each treatment group. The MW for the proteins were: FoxO3a (80kDA), p53 (53kDA), and GAPDH (35.8kDA). After blocking with TBST +5% nonfat dry milk, membranes were incubated overnight at 4°C in 1:1000 dilutions of primary antibodies for SIRT1 (Millipore), PGC1α (Santa Cruz), GAPDH (Cell Signaling, Danvers, MA, USA), p53 (Cell Signaling, Danvers, MA, USA), Acetyl‐Lysine (Cell Signaling, Danvers, MA, USA), and FOXO3a (Cell Signaling, Danvers, MA, USA). Membranes were then incubated in linked anti‐mouse and anti‐rabbit secondary antibodies at 1:5000 dilutions (Cell Signaling, Danvers, MA, USA). Horseradish peroxidase (HRP) signals were developed with an enhanced chemiluminescent substrate (ThermoFisher Scientific, Pittsburgh PA, USA) with a G:Box Bioimaging System (Syngene, Fredrick, MD, USA). Band intensity was normalized to GAPDH.
Verification of antibody specificity
The antibodies which were used in our experiments were validated prior to utilization. We obtained antibodies that were supplied from vendors which were able to provide validation, maintenance testing, and production validation to ensure that lots of the antibodies remained constant over the study duration. In addition, validation of the antibodies included testing on appropriate positive protein controls or mouse models (deficient in gene/protein) by immunoblot and immunostaining. Western blots were conducted to validate band sizes, and immunohistochemistry on each antibody to check for non‐specific staining in tissue sections. Several different antibodies to the same protein were used to confirm staining patterns and/or location of the protein band on a western blot. Negative controls were conducted without the primary antibody or without the secondary antibody to confirm that there was no inappropriate cross‐labelling by the antibodies.
Statistical analysis
Quantitative analysis was performed on experiments performed at least in triplicate. Statistically significant differences between groups were determined using GraphPad Prism 6 software (La Jolla, CA, USA) performing a two‐way analysis of variance (ANOVA) (age group × condition) with corrections made for multiple comparisons against a baseline control group by the Dunnett's test. Fatigue analysis was performed using two‐way repeated ANOVA with corrections for multiple comparisons against the baseline control. Statistical differences between right and left hindlimb pretreatment groups for each genotype were compared using paired t‐tests for muscle force, indicating the difference between hindlimbs was not significant from zero. Multiple unpaired t‐tests for contractile force as a function of the number of muscle contractions was also performed between the left and right hindlimb pretreatment groups for each genotype, also indicating no significant difference between hindlimb function within the individual models. As such, data for the left hindlimb pretreatment groups were expressed as baseline data for each model. Unpaired t‐tests were also used, when appropriate, to determine statistical significance between two groups, such as treatment and control groups within each genotype, with significant differences noted when present. Effect sizes were reported using the Cohen's d statistic and were calculated as the difference in means over the pooled standard deviation. The results were expressed as mean ± standard deviation (SD) (P < 0.05).
Results
Animal model characteristics
Mouse models were categorized into five groups, based on age and SIRT1 expression. Young wild‐type (YWT) mice were 20–30 weeks of age, while older mice were 80–120 weeks of age. The older mice included wild‐type mice (WT‐80), SIRT1 overexpressor mice (OE‐80), SIRT1 adult skeletal‐muscle knockout mice (MKO‐80), and SIRT1 satellite cell knockout mice (SKO‐80). Each group included both male and female mice. Although the older mouse groups showed no significant differences in body weight between males and females, YWT females were significantly smaller than corresponding YWT males (P ≤ 0.05) (Table 1).
Table 1.
Characteristics of study animals
| YWT | OWT | OE | MKO | SKO | |
|---|---|---|---|---|---|
| Age (weeks) | 24.8 ± 0.7 | 83.7 ± 0.5 | 86.9 ± 1.5 | 90.1 ± 2.9 | 84.2 ± 4.2 |
| Mass (g)—total | 28.4 ± 1.4 | 35.8 ± 2.1 | 31.7 ± 0.8 | 34.9 ± 1.5 | 31.2 ± 1.7 |
| Mass (g)—males | 32.1 ± 1.1* | 37.3 ± 2.6 | 32.7 ± 0.7 | 34.9 ± 2.0 | 34.5 ± 2.1 |
| Mass (g)—female | 24.0 ± 0.9* | 33.5 ± 3.6 | 29.6 ± 1.7 | 34.8 ± 2.5 | 31.4 ± 2.1 |
| Male (%) | 53.9 | 61.6 | 66.7 | 58.3 | 30 |
| Female (%) | 46.2 | 38.5 | 33.3 | 41.7 | 70 |
| n | 13 | 13 | 14 | 12 | 10 |
Mass of each group was recorded immediately prior to euthanasia. Experimental groups consisted of randomly distributed males and females. Young wild‐type (YWT) males differed significantly in body mass only from YWT females (*P < 0.05). Data are expressed as means ± SD.
SIRT1 protein abundance in the mouse models
To characterize differences in SIRT1 protein abundance between animal groups, the hindlimb muscles were collected from young wild‐type (YWT, n = 3) and older (80+ weeks) wild‐type (WT‐80, n = 3), SIRT1 overexpressor (OE‐80, n = 3), SIRT1 skeletal muscle knockout (MKO‐80, n = 3), and SIRT1 satellite cell knockout (SKO‐80, n = 3) mice, 21 days after PBS or CTX injection. The mice were examined prior to and 2 h after exercise (‐ex) because exercise is a known inducer of SIRT1.48 As expected, SIRT1 was greater in the OE muscles and lowest in the muscles from SKO and MKO mice (Figure 1B). These data indicate that SIRT1 protein levels were as anticipated based on the crosses of the respective animal models. SIRT1 was not absent in SKO‐80 mice muscles, although the SIRT1 protein abundance was significantly lower in PBS‐injected, but not CTX‐injected hindlimb muscles from SKO‐80 relative to YWT mice. Interestingly, ANOVA analyses showed significant differences between the OE‐80 PBS and SKO‐80 PBS groups as compared to wild‐type controls, but not the MKO‐80 PBS groups. However, the OE‐80, SKO‐80, and MKO‐80 muscle SIRT1 abundances were significantly different from the wild‐type controls when compared with individual t‐tests (P < 0.05, data not shown). Only the muscles from SKO‐80 mice showed a significant increase in SIRT1 abundance in CTX‐injected muscles relative to their own PBS group (P < 0.05).
Figure 1.
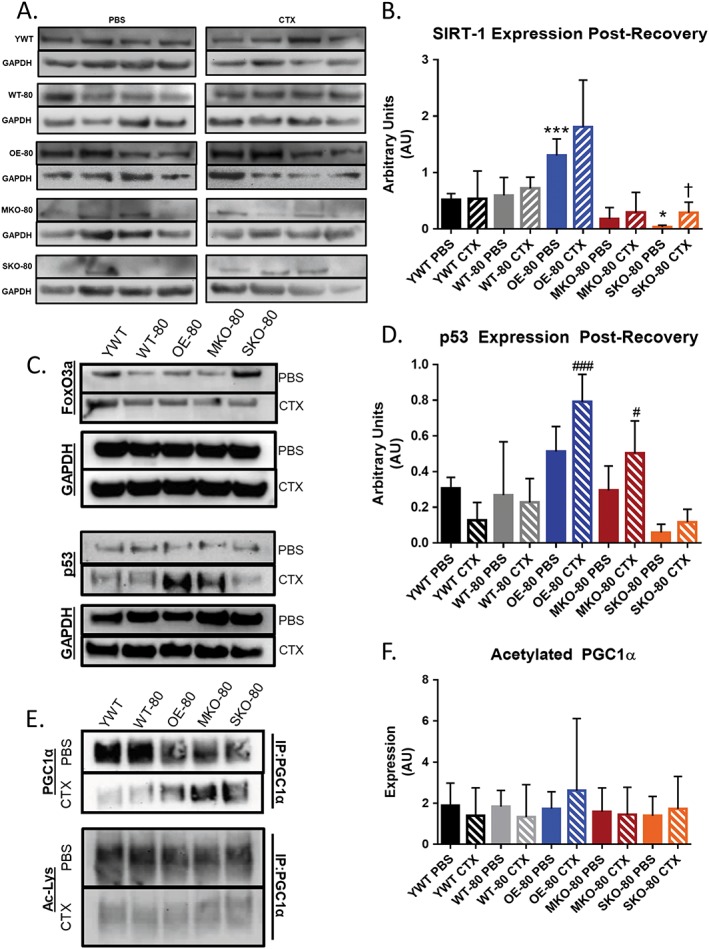
Protein expression in young wild‐type and older variant SIRT1 expressing mice. (A) SIRT1 protein expression collected from 12‐week‐old wild‐type (WT), overexpressor (OE), satellite cell knockout (SKO), and skeletal muscle knockout (MKO) mice prior to and 2 h after exercise (‐ex). (B) Densitometric and immunoblot analysis of SIRT1 protein expression measured in young wild‐type (YWT, n = 3) and older (80+ weeks) wild‐type (WT‐80, n = 3), SIRT1 overexpressor (OE‐80, n = 3), SIRT1 skeletal muscle knockout (MKO‐80, n = 3), and SIRT1 satellite cell knockout (SKO‐80, n = 3) mice hindlimbs 21 days after phosphate‐buffered saline (PBS) or cardiotoxin (CTX) injection. Basal SKO‐80 SIRT1 expression was significantly reduced relative to YWT mice (*P < 0.05), while OE‐80 PBS SIRT1 expression was significantly increased (***P < 0.001) relative to YWT PBS. Only SKO‐80 mice showed a significant increase in SIRT1 abundance for CTX injected muscles relative to their own PBS injected hindlimbs (†P < 0.05). (C) Representative immunoblots of SIRT1 downstream targets FoxO3a and p53 and loading control GAPDH for SIRT1 variant expressers after PBS/CTX injection and recovery. Densitometric analysis of the immunoblots revealed no significant differences in protein expression. (D) Densitometric analysis of the immunoblots revealed significant differences in the abundance of p53 protein for OE‐80 CTX (### P < 0.001) and MKO‐80 CTX (# P < 0.05) groups relative to YWT CTX mice. (E) Representative immunoprecipitation immunoblots for SIRT1 downstream target PGC1α and its acetylation state. (F) Densitometric analysis of relative PGC1α acetylation. No significant difference was discovered between groups versus the YWT control when using one‐way analysis of variance with corrections for multiple comparisons.
We next measured FoxO3a and p53 protein abundance because they are downstream targets of SIRT1 (Figure 1C). Protein abundance was not markedly different for FoxO3a among the groups. Abundance of p53 followed a similar distribution to the SIRT1 protein expression, although a significant difference in p53 protein abundance was not detected between the OE‐80 groups and the YWT PBS control (Figure 1D). Interestingly, while a significant increase in p53 protein abundance was not detected between injury‐recovered muscles and muscles treated with the saline control for either the OE‐80 or MKO‐80 groups, the relative abundance of p53 for those groups was significantly greater than the p53 abundance detected in muscles from the YWT CTX‐injected mice (comparison denoted by #). Even though the muscle protein abundance of p53 in the YWT CTX mice differed significantly from the protein abundance levels in muscles from the OE‐80 CTX and the MKO‐80 CTX groups, p53 protein abundance in muscles from YWT CTX‐injected mice did not differ significantly from the levels found in muscles from the WT‐80 CTX and the SKO‐80 CTX groups (Figure 2C–2H).
Figure 2.
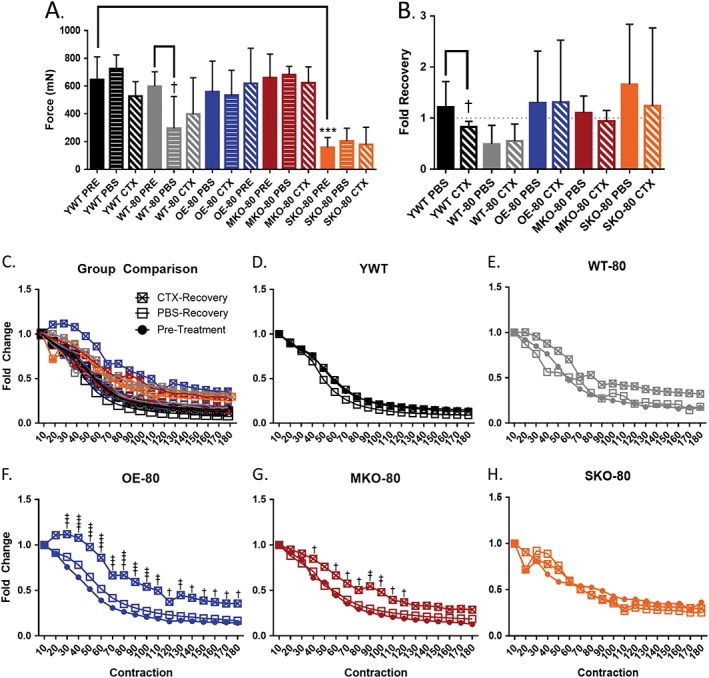
The effects of SIRT1 expression on hindlimb skeletal muscle function in young wild‐type and older mice. Young wild‐type (YWT, 20–30 weeks, n = 8) and older (80+ weeks) wild‐type (WT‐80, n = 8), SIRT1 overexpressor (OE‐80, n = 9), SIRT1 skeletal muscle knockout (MKO‐80, n = 7), and SIRT1 satellite cell knockout (SKO‐80, n = 4) mice were anaesthetised with 2–3% isoflurane and electrically stimulated once at 75 Hz (A, B) and 180 times at 40 Hz (C‐H) to produce muscle contractions (pretreatment, PRE) prior to injection with snake cardiotoxin (CTX) and vehicle control (PBS). Twenty‐one days post‐injection, muscle force was re‐examined. Data are presented as the mean force at 75 Hz ± SD (***P < 0.01; †P < 0.05) (* denotes a significant difference from the YWT control and † denotes a significant difference between a genotype's control and treatment). (B) Force recovery was measured by normalizing PBS/CTX data to the same limb pretreatment. Data presented as fold change ± SD. (C) Comparison of all and individual (C–H) fatigue profiles for experimental groups normalized to earliest maximum force. Data are presented as fold change (†P < 0.05, ††P < 0.01, †††P < 0.01, ††††P < 0.001).
We also evaluated the acetylation status of PGC1α, another downstream target of SIRT1 to assess SIRT1 activity (Figure 1E). Although we expected to see decreased acetylation of PGC1α in muscles from the SIRT1 overexpressor mouse model and increased acetylation in the muscles from SIRT1 knockout mice, qualitative analysis of immunoblots showed no apparent change in acetylation state, regardless of apparent PGC1α expression in the various mouse genotypes (Figure 1F).
Skeletal muscle function
Muscle force
We tested whether SIRT1 protein abundance had a role in regulating skeletal muscle function in muscles of older mice after acute injury induced by CTX. Before treatment, average, evoked maximal plantar flexion contractile force at 75 Hz stimulation was significantly lower in the older SKO‐80 mice as compared to YWT PRE, indicating a lower basal contraction force in older mice deficit of SIRT1 in satellite cell (Figure 2A). Next, contractile force was assessed in each group following a 21‐day recovery from acute injury by CTX or treatment with PBS to determine if SIRT1 abundance in skeletal muscle had an effect on the recovery of contractile function. Mean maximal contractile force in YWT mice generated at a stimulation frequency of 75 Hz had recovered to control levels by 21 days after CTX treatment. The maximal contractile force was significantly lower in the PBS‐injected, vector control hindlimb for WT‐80 compared to the WT‐80 PRE baseline, suggesting that the older muscles in the WT‐80 animals may have been susceptible to injection injury (Figure 2A). As expected, aging per se resulted in a lower plantar flexion maximal force production in wild‐type mice, as seen by the lower force production in the muscles of the WT‐80 PBS group relative to the WT‐80 PRE group.
We next compared the percent recovery of contractile force in hindlimb muscles 21 days post‐recovery from CTX injection (Figure 2B). The maximal post PBS‐injection or CTX‐injection plantar flexion force was normalized to the respective pretreatment force output for each animal. The aged mice were expected to show decreased force recovery in PBS control hindlimbs relative to the young wild‐type mice. However, despite the WT‐80 having a force recovery under one‐fold, no older group showed significantly altered, basal force recovery in control PBS injected hindlimbs relative to the YWT PBS group. This suggests that aging did not impair recovery after injury. Contrary to our original expectations, only the youngest group of mice (YWT) showed decreased recovery in maximal hindlimb force from muscles that had been acutely injured by CTX as compared to PBS treated muscles. Although the overall plantar flexion force output for SKO‐80 hindlimb muscles was significantly lower than YWT mice, the SKO‐80 mice appeared to recover to pretreatment levels after 21 days of recovery. The relative force produced 21 days after CTX‐induced injury was not diminished in the older SKO‐80 animals as compared to young animals although the absolute levels of force was also depressed in the SKO‐80 animals as compared to other groups.
Muscle fatigue
Muscle fatigability was examined in hindlimb plantar flexor muscles from young and older mice by inducing a series of 180 electrically evoke contractions at 40 Hz over a period of 3 min. While the mean force output over time shows the amount of fatigue occurring in a contracting muscle group, it does not necessarily mimic resistance to fatigue for those muscles. Therefore, we examined fatigue resistance by looking at the depletion of muscle contractile force as a function of consecutive electrically evoked contractions by normalizing the force of each 40 Hz contraction to the force of the initial 40 Hz contraction (Figure 2C–2H). The baseline fatigability of the young pretreatment wild‐type mice (YWT PRE) mice did not differ significantly from the fatigability of the WT‐80 PRE, OE‐80 PRE, MKO‐80 PRE, or SKO‐80 PRE groups (Figure 2D and 2H). Neither acute muscle injury from CTX nor injection with the PBS vector control had significant effects on muscle fatigability in YWT, WT‐80, or SKO‐80 mice post‐recovery (Figure 2D, 2E, and 2H). Surprisingly, muscles that underwent repair after CTX injury had greater fatigue resistance in both the aged SIRT1 overexpression and skeletal muscle knockout models of SIRT1 (Figure 2F and 2G). The OE‐80 CTX group showed the greatest magnitude and most consistent attenuation of fatigue following recovery from acute muscle injury, and the OE‐80 CTX was also the only group to show signs of post‐activation potentiation, so that muscle contractile force increases with time rather than diminishing. Although the effect was smaller for the MKO‐80 CTX group compared to the OE‐80 CTX mice, protection from fatigue was present only in muscles that had recovered from acute CTX injury (Figure 2E–2G), which would have required activation of satellite cells to induce repair. Interestingly, when compared to the fatigability of YWT CTX mice, the OE‐80 CTX and MKO‐80 CTX groups still showed significant protective fatigue resistance, albeit to a lesser degree, and were the only groups to do so. Furthermore, the fatigue resistance seen in the OE‐80 CTX and MKO‐80 CTX models coincides with the increased abundance of p53 after repair from CTX as seen in Figure 1C.
Fibre cross‐sectional area
Given the greater susceptibility of type II fibres to aging‐induced atrophy49 and the general resistance of type I fibres to sarcopenic changes,50 we decided to investigate the effect of SIRT1 expression on these two primary muscle fibre types in the gastrocnemius muscle of older mice. Although the exact fibre type distribution of the mouse gastrocnemius can vary between strains, the gastrocnemius muscle typically contains a mixture of types I and II muscle fibres although it is predominantly composed of type II fibres.51 To determine the effects of SIRT1 expression on gastrocnemius muscle structure after acute injury, we used immunofluorescence techniques to determine the CSA of whole muscles, and types I and II fibres from PBS‐injected and CTX‐injected gastrocnemius muscles of the YWT and older groups (Figure 3F–3H). As expected, the CSA for the gastrocnemius muscle was lower in older mice 21 days after PBS‐injection or CTX‐injection CSA relative to muscles in YWT mice 21 days after PBS (Figure 3F). However, we did not find a significant difference between any older group and the YWT control. Given that the Cohen's d test shows effect sizes greater than 2 standard deviations for two groups (WT‐80 PBS and WT‐80 CTX), it is likely that the absence of significance may have been due to a low sample size.
Figure 3.
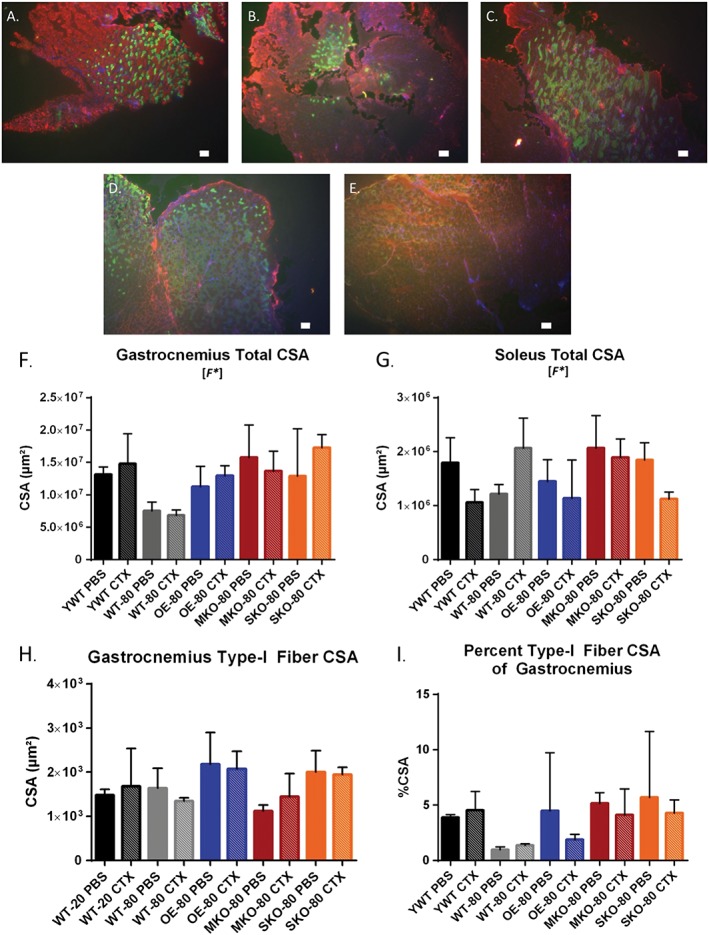
The effects of SIRT1 expression on hindlimb skeletal muscle structure in young wild‐type and older mice (A–E). Gastrocnemius and soleus muscles for YWT (A), WT‐80 (B), OE‐80 (C), MKO‐80 (D), and SKO‐80 (E) were dissected after physiological evaluation and flash frozen in methyl‐butane chilled by liquid nitrogen. Cross sections were cut at 16 μm, stained for MHC I (green) or MHC IIa/b and dystrophin (red), and then mounted with DAPI hardset (blue). Total cross‐sectional area (CSA) of gastrocnemius cross sections (F), soleus cross sections (G), and type I fibre cross sections (H) were calculated by fibre tracing with the ImageJ software package on images captured at 4x resolution. Data are presented as mean ± SD compared to YWT PBS, (n = 3). [F*] denotes that a significant difference was observed for the global one‐way analysis of variance tests, but not for specific comparisons. (I) The gastrocnemius type I percentage was calculated by dividing the summed type I fibre CSA for each section by the total CSA of the respective gastrocnemius (n = 3). Scale bar = 100 μm.
Similarly, the CSA in the soleus muscle (Figure 3G) had a significant F statistical main effect from one‐way ANOVA with corrections for multiple comparisons; however, no significant differences were found between the YWT PBS control group and other groups. Groups of mice showing a large effect size (>1 standard deviation) were YWT CTX, WT‐80 PBS, OE‐80 CTX, and SKO‐80 CTX groups. Next, we calculated mean type I fibre CSA from each gastrocnemius section (Figure 3A–3E), from which we calculated the percent type I CSA standardized to the total CSA of the gastrocnemius muscle (Figure 3H). Despite the apparent difference of the percent of type I fibres, this did not reach a statistically significant difference when represented as a percentage of the entire gastrocnemius muscle CSA or the specific comparisons of the treatment groups to the YWT PBS control.
Regenerative capacity
Loss of function in aging skeletal muscle is characterized by reduced capacity for muscle satellite cells to regenerate damaged tissue.52 Previously, our lab has used 5‐bromo‐2′‐deoxyuridine (BrdU) administered in water supplied ad libitum to gauge satellite cell proliferation to an experimental intervention.24 Therefore, to examine satellite cell division in response to skeletal muscle regeneration, we injected the TA muscles of older WT, OE, MKO, and SKO mice with CTX or PBS as a control and supplied the recovering mice with 0.8 mg/mL of BrdU for 21 days post‐injury. After recovery, the mice were sacrificed, and BrdU expression was identified in the TA or gastrocnemius muscles by immunohistochemically. The number of BrdU+ nuclei in CTX‐recovery hindlimb muscles were then counted (Figure 4A–4D) and normalized to the CSA of their respective muscles. In contrast to the plantar flexor muscle group, the TAs showed no significant difference between PBS and CTX‐recovery groups for mean muscle CSA or effect size (Figure 4E). No significant difference was seen between the MKO‐80 and WT‐80 groups, while a significantly lower number of BrdU+ nuclei/μm2 was found for the OE‐80 and the SKO‐80 CTX‐recovery groups (Figure 4F). Nevertheless, all animal groups showed effect sizes larger than 1 standard deviation (P ≤ 0.05).
Figure 4.
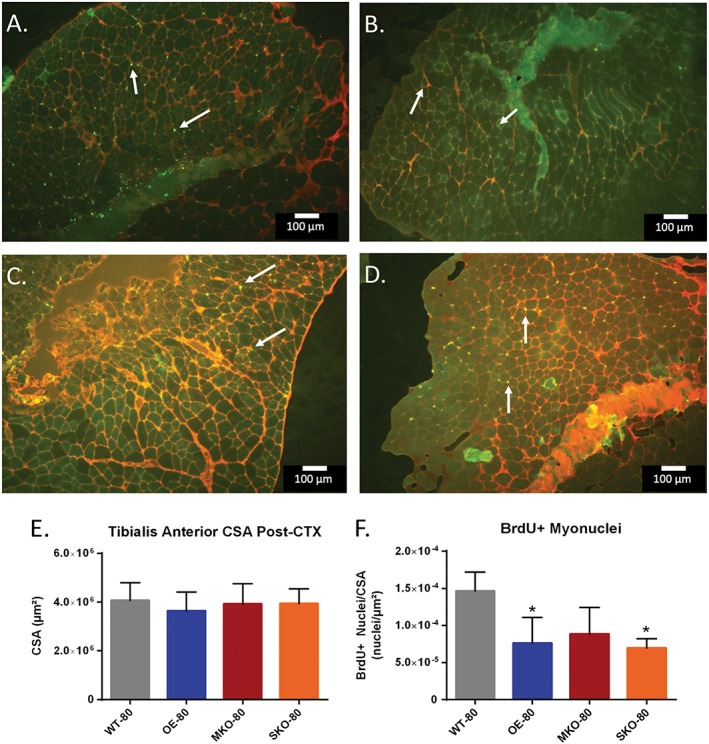
The effects of SIRT1 expression on cell replication in older murine skeletal muscle after recovery from injury. (A–D) Tibialis anterior (TA) cross sections were taken for WT‐80 (A), OE‐80 (B), MKO‐80 (C), and SKO‐80 (D) mice 21 days after CTX injury at 4x resolution. Sections were stained against BrdU (green, indicated by white arrows) and dystrophin (red). (E) Total CSAs of TA cross sections were calculated and presented as mean CSA (μm2) ± SD (n = 3). (F) BrdU positive nuclei (A–D) were quantified and normalized to their respective TA CSA. Data are presented as mean ± SD (n = 3); (*P < 0.05). Scale bar = 100 μm. CSA, cross‐sectional area
Next, to determine the regenerative capacity of satellite cells from the older SIRT1 expression variable mouse models, we isolated satellite cells by FACS and used them in proliferation analysis. Isolated satellite cells were diluted so that 10000 cells could be plated in triplicate onto a gelatin‐coated coverslip in a 24 well plate. Cells were allowed to recover overnight before treatment with 5‐ethynyl‐2′‐deoxyuridine (EdU) prior to fixation and permeabilization. Similar to BrdU, EdU is incorporated into DNA from proliferating cells. Thereafter, images from nine fields from each coverslip were captured and the total number of EdU+ cells were counted (Figure 5A–5D). The proliferation factor was calculated and expressed as the number of EdU+ cells in nine image fields over the number of cells initially plated. Satellite cells that were isolated from muscles of MKO‐80 mice showed a significant increase in proliferation relative to WT‐80 mice, with an effect size greater than 3 standard deviations (Figure 5E).
Figure 5.
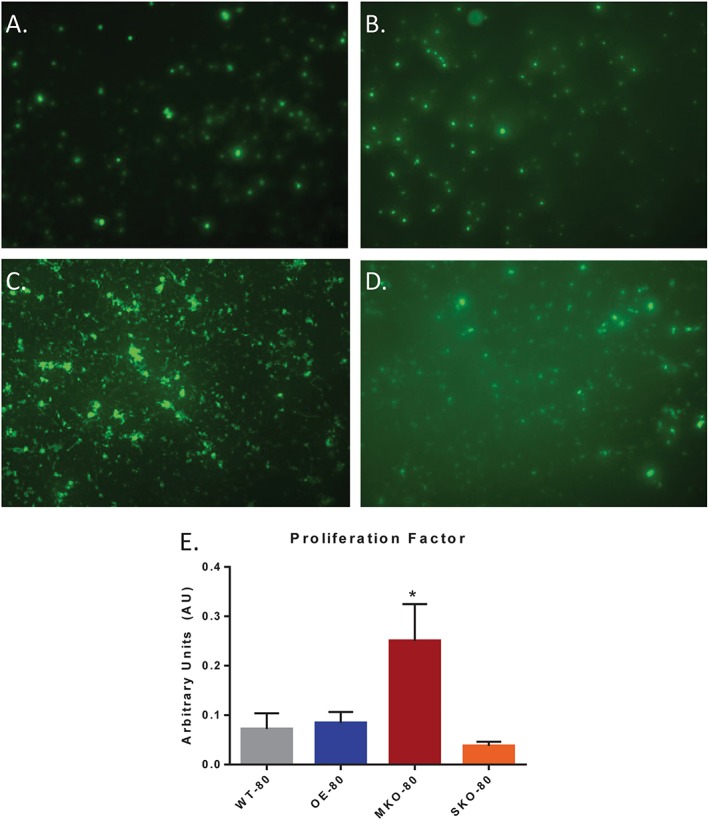
The effects of SIRT1 expression on satellite cell proliferation in older murine skeletal muscle. (A–D) EdU+ cells were identified from FACS‐isolated satellite cell populations from TA muscles of WT‐80 (A), OE‐80 (B), MKO‐80 (C), and SKO‐80 (D) mice. (E) The proliferation factor was determined by the total of EdU+ cells counted from nine fields, normalized to the total number of cells in the plate. Experiments were repeated in triplicate, and data are presented as mean ± SD (n = 3); (*P < 0.05).
Mitochondrial structure and function
There is likely a link between mitochondrial dysfunction and aging53 including sarcopenia.4 As SIRT1 is a known regulator of PGC1α which in turn regulates mitochondria biogenesis, we next decided to investigate the effects that SIRT1 expression levels had on mitochondrial activity in the skeletal muscle of older mice. To determine changes in mitochondrial size and complexity/granularity, freshly isolated IFM and SSM subpopulations were analysed in control mice by forward‐scattering and side‐scattering light, respectively.44, 54 Mitochondria were isolated from the same mice that were used for satellite cell isolation experiments, and therefore, it was not possible to evaluate mitochondria after CTX experiments in these mice. Older mice had greater mitochondrial size for both SSM and IFM relative to YWT control mice for both SIRT‐1 overexpressor and knockout groups (Figure 6A and 6D). No significant difference was found for the internal complexities of IFM or SSM; however, a significant F ratio was found for the SSM internal complexity, despite having no significant differences among the groups relative to the YWT control (Figure 6B and 6E).
Figure 6.
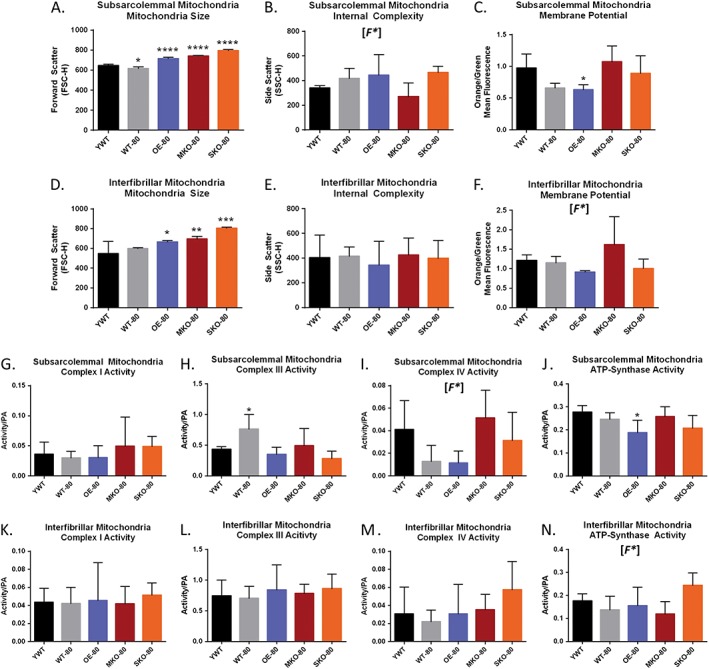
Characteristics of mitochondria in young wild‐type and older SIRT1‐expression models of murine skeletal muscle. Plantar flexor muscle groups (gastrocnemius, soleus, and plantaris) were obtained from YWT and older SIRT1‐expressor mice prior to isolation of interfibrillar mitochondria (IFM) and subsarcolemmal mitochondria (SSM) subpopulations. Significant differences were found in the sizes of older mitochondria relative to YWT mitochondria for both SSM (A) and IFM (D). No significant differences were found for specific comparisons of internal complexity in SSM (B) or in IFM (E). OE‐80 showed a significantly lower mitochondrial membrane potential (ΔΨm) than YWT mice mitochondria as reflected in the lower ratio of orange/green mitochondria relative to YWT in SSM (C) and IFM (D) [F*]. MKO‐80 mice and OE‐80 mice show the potential for having inversely affected ΔΨm (F). The shift from green to orange occurs as the JC‐1 dye forms aggregates upon membrane polarization causing shifts in emitted light from 530 (green) to 590 nm (orange). Addition of 200 μM dinitrophenol, which collapses the ΔΨm was used as an assay control. Data are expressed as the mean orange fluorescence divided by the mean green fluorescence of 20000 mitochondrial events per individual mitochondrial sample. The activity for mitochondrial electron transport chain complexes was calculated for SSM (G–J) and IFM (K–N). OWT‐80 showed increased complex III activity in SSM (H), while OE‐80 mice showed decreased ATP synthase activity (J). Complex IV activity is depressed in older WT and OE models in SSM, but not SIRT1 knockout models (I). Data are presented as mean ± SD (n = 5). (*P < 0.05, **P < 0.01, ***P < 0.001). [F*] denotes that a significant difference was observed for the global one‐way analysis of variance tests, but not for specific comparisons.
Changes in mitochondrial membrane potential (ΔΨm) typically occur in tangent with diseases like diabetes45, 54 and also in aging.55 Isolated mitochondria were incubated with 5,5′,6,6′‐etrachloro‐1,1′,3,3′‐tetraethylbenzimidazol carbocyanine iodide (JC‐1). A shift from JC‐1 green to red fluorescence indicated an increase in the ΔΨm. Previous studies have shown mitochondria from diabetic animals or humans had a greater orange/green ratio as compared to control mitochondria.45, 54 A significantly lower ΔΨm was found in SSM populations for OE‐80 mice relative to YWT control mice as reflected by a lower orange/green fluorescent ratio (Figure 6C). A similar decrease in ΔΨm was seen for the IFM mitochondria in OE‐80 mice, although statistical significance was not achieved (Figure 6F). While significant differences for ΔΨm were not found between groups, a one‐way ANOVA with corrections for multiple variances with the Dunnett's test (P = 0.05), the global analyses revealed a statistical difference between the group means. Given the large effect sizes for some of the groups (>1 SD), it is possible that the marginally non‐significant pairwise contrasts in (Figure 6F) may have produced a significant difference if there the experimental sample size had been larger.
Mitochondrial complex activity and muscle repair
To further examine the effects of variant SIRT1 expression coupled with aging on mitochondria, we next assessed the relative activity of the mitochondrial electron transport chain complexes in control muscles. These same mice were used for satellite cell isolation experiments, and therefore, it was not possible to evaluate mitochondria following CTX injury in these mice. Significant differences were found for activities of the SSM complexes, specifically a greater complex III activity for WT‐80 mice (Figure 6H) and a reduced ATP synthase activity for OE‐80 mice (Figure 6J). No significant change was seen for SSM complex I activity (Figure 6G) or SSM complex IV activity (Figure 6I), although the one‐way ANOVA global test did suggest there was a significance in differences between the means. No significant group differences were found for IFM complex I activity (Figure 6K), complex III activity (Figure 6L), or complex IV activity (Figure 6M); however, the global analysis did show that a significant difference existed for the IFM ATP synthase activity (Figure 6N).
Discussion
In skeletal muscle, SIRT1 has been established as a regulator of PGC1α and consequently, mitochondria,21, 56 which are important for generating ATP during muscle repair. SIRT1 is generally high in type I fibres and promoted by endurance exercise.48 Because type I oxidative fibres are generally though to resist aging‐related atrophy, SIRT1 has become a target of interest in studies of sarcopenia with a potential role in preventing muscle wasting. Support for this idea came from studies that show overexpression of SIRT1 prevented type I fibre atrophy under conditions of long‐term caloric deficit.15 Furthermore, SIRT1 overexpression also improved the pathophysiology of muscle wasting including Duchenne muscular dystrophy.50 The data in the present study show that SIRT1 is important for proper muscle function in older mice, with loss of function most impactful to muscle satellite cells. This suggests that SIRT1 may have a role in satellite cell regulated muscle repair. Unexpectedly, both our SIRT1 overexpressing model (OE‐80) and skeletal muscle‐specific SIRT1 knockout model (MKO‐80) demonstrated increased resistance to muscle fatigue after recovering from acute CTX‐induced muscle damage. Although knocking out SIRT1 in satellite cells impairs muscle contraction in aged mice, ablation of SIRT1 from skeletal muscle promotes satellite cell proliferation and therefore the muscle's regenerative capacity, suggesting that the most beneficial or detrimental effects of SIRT1 may be determined by its site of localization within muscle cells.
Muscle and satellite cell loss of SIRT1
Interestingly, the MKO and SKO models showed differential effects for SIRT1 knockout. The MKO mice had a greater resistance to fatigue after repair following CTX injury but a similar level of regenerative capacity as compared to the older models. In contrast to the SKO model, the cre protein in the MKO model is induced by the MCK promoter, so SIRT1 is only expressed in mature skeletal muscle. In contrast, the SKO model's cre protein is promoted by PAX7 so that SIRT1 is inactive in only satellite cells, but not in skeletal muscle when PAX7 is downregulated.
Satellite cell but not muscle loss of SIRT1 reduces maximal force production
Muscles from older MKO mice did not have a loss of muscle force production when compared to age‐matched or 20‐week‐old and wild‐type control mice. This suggests that loss or gain of SIRT1 does not affect the muscle's ability to generate maximal muscle force (presumably by not affecting the number or general function of the myosin cross bridges). In contrast, SKO mice that have a satellite cell specific loss of SIRT1 had lower overall plantarflexion force than young or older wild type or SIRT1 overexpressor mice, although gastrocnemius and soleus muscles were not markedly smaller in this group. This suggests that loss of SIRT1 in satellite cells did not change overall cross bridge number in the muscle's CSA, but interestingly, it did affect muscle function. While it is possible that SIRT1 could affect force per cross bridge, we think a more likely possibility is that the lower force output in muscles from SKO mice may indicate a neural problem which resulted in an incomplete activation of muscle in the old mice. This could potentially occur at the level of the neuromuscular junction perhaps as an accelerated aging loss of dystrophin.57 However, this study was not designed to evaluate the role of SIRT1 in neural regulation of force.
SIRT1 expression may improve but is not necessary for recovery of muscle function after injury
Muscle repair is dependent upon satellite cell activation and satellite cell function thought to be depressed with aging.23, 52 In elderly humans, SIRT1 activation by resveratrol was shown to be associated with increased satellite cell activation in response to loading exercise.27 Although the MKO‐80 and OE‐80 aged models in our study vary with respect to their levels of SIRT1 expression in skeletal muscle, both groups showed some improvement in fatigue resistance in response to repeated contractions of muscles in hindlimbs previously injured by CTX as compared to uninjured control muscles. This fatigue resistance was not reproduced in CTX‐injured hindlimbs for the YWT, WT‐80, or SKO‐80 models after a 21‐day recovery period that was observed in the other groups. Furthermore, none of the five animal groups experienced a loss of function during the fatigue testing in hindlimbs injured by CTX or injected with the PBS control, indicating that functional recovery of skeletal muscle is not influenced by loss or gain of SIRT1 abundance in skeletal muscle. The gain of function after injury in both SIRT1 overexpressor and SIRT1 knockout models suggests a common repair‐induced modification in muscle function may exist as long as some SIRT1 is present in satellite cells (even if it does not exist in the muscle cells per se).
SIRT1 loss in muscle increases acute, but not long‐term proliferation of satellite cell
Ryall and colleagues reported that knocking SIRT1 out of satellite cells caused premature differentiation of satellite cells,29 and therefore, we expected SIRT1 loss or overexpression would induce different satellite cell proliferation responses after CTX injury.
In vitro analysis of cell proliferation within 24 h of culturing isolated satellite cells showed that a muscle knockout of SIRT1 had the greatest potential for satellite cell proliferation among the experimental groups. Of the five experimental groups, only the MKO model lacked expression of SIRT1 in skeletal muscle (despite PAX7 not being expressed in skeletal muscle, western blots showed reduced or ablated bands for SKO mice, which should only lack SIRT1 in satellite cells). However, because the SKO muscles showed a comparatively blunted level of proliferation compared to the MKO model, muscle loss of SIRT1 while maintaining satellite cell SIRT1 appeared to increase satellite cell proliferation. However, this potential was not realized in vivo in response to repair following CTX injury.
In vivo proliferation was assessed 21 days after acute CTX injury in muscles of older mice and was reflected by the frequency of BrdU+ nuclei present in muscle sections post‐repair. As 21 days represents a point where recovery from acute injury should be complete, this experiment reflected long‐term satellite cell proliferation following an acute injury and not the rate of cell proliferation. After 21 days, the MKO model no longer had the greatest proliferation capacity but instead was the only SIRT1‐expressor variant that did not differ significantly in the number of BrdU+ nuclei quantified in the older, WT‐80 group. Both OE‐80 and SKO‐80 showed significantly fewer BrdU+ cells relative to the WT‐80 and MKO‐80 models. This indicates that factors outside of the satellite cells (potentially crosstalk between muscle and satellite cells) in vivo limited satellite cell proliferation in muscles of old animals, and one of those could be muscle SIRT1.
Mitochondrial function and SIRT1 in muscle
As SIRT1 has a role in regulating oxidative metabolism and connecting global metabolism to longevity and regeneration, we also examined mitochondrial subpopulations to identify potential differences in these subpopulations resulting from variant SIRT1 expression. Mitochondrial dysfunction may be a fundamental component that regulates aging responses along several pathways.27, 58 Previous work has suggested that IFM and SSM subpopulations are affected differently in cardiac muscle by diabetes.54 Furthermore, SIRT1 is a regulator of PGC1α which moderates mitochondrial proliferation.59
As a reduced mitochondrial membrane potential has been characterized as an effect of aging and correlates with increased reactive oxygen species (ROS) production,55, 60 we had expected that mitochondrial membrane potential (ΔΨm) would be improved when SIRT1 was overexpressed in muscles of older mice, but this was not the case. Interestingly, we saw that muscles from older mice overexpressing SIRT1 had a significantly lower ΔΨm and ATP synthase activity in the SSM subpopulation. While we found a significant F ratio for IFM ΔΨm by one‐way ANOVA, there was no significance difference in mitochondrial function between animal groups (denoted in our figures by F*), for IFM‐ΔΨm and IFM ATP synthase activity. The IFM results may have been a function of significant differences in activity that were masked by the low sample sizes of the experiments. While it is possible that the decrease in ΔΨm in muscle mitochondria from SIRT1 overexpressor mice may extend to the IFM subpopulation as well, we cannot verify this in the current study.
Despite loss of SIRT1 function, there was no significant differences in muscle mitochondrial characteristics among MKO‐80, SKO‐80, and YWT mice aside from significantly increased size in the older mice (perhaps as a function of decreased mitochondrial fission or increased fusion). Because analysis of these mitochondria was performed on isolated skeletal muscle and not isolated satellite cells, some differences in mitochondrial characteristics may be present during the repair process in satellite cells that could contribute to a reduced maximal contraction force in muscles of SKO‐80 mice, or the increase in proliferation of satellite cells seen in MKO‐80 mice. However, the similarities between the experimental models for the majority of the mitochondrial factors closely reflects the physiological data that showed little change between muscle fatigability between pretreatment and saline‐injected control groups. The reduced ΔΨm and ATP synthase activity in SSM from OE‐80 mice, coupled with the significantly reduced number of proliferating BrdU+ cells detected after injury, support the idea that mitochondria dysfunction may impair the recovery of muscle injury in aging.61 The force and fatigue data collected before and after injury suggest that alterations in mitochondria characteristics did not impair muscle function after repair from CTX‐induced injury.
One explanation for the increased satellite cell proliferation seen in MKO‐80 mice after injury and the blunted satellite cell response seen in the OE‐80 model might be related to the mitochondrial related ROS concentration in the relative cellular environments. For example, attenuation of muscle regeneration in satellite cells from old mice was shown to decrease when aged satellite cells were paired to young circulatory environments,23 indicating that repair can be influenced by the local cellular environment. Several studies have suggested that excess ROS generated from mitochondrial respiration can damage cellular structures and may contribute to cellular aging.62 It is possible, although speculative, that skeletal muscle containing high levels of SIRT1 may release more mitochondrial‐associated ROS than SIRT1 knockout models during injury and repair and thereby impair the proliferation capacity in satellite cells during muscle repair. Although our study was not designed to measure ROS levels, we did see a reduction in SSM‐ΔΨm and in ATP synthase activity for the OE‐80 model. Reduced NAD+ and SIRT1 activity has been observed in aged tissues, concurrent with reduced mitochondrial respiratory chain activity and decreased expression of proteins that protect against oxidative damage.63 Conversely, treatment with nicotinamide, the precursor to the SIRT1 cofactor nicotinamide adenine dinucleotide (NAD+), has been shown to increase mitochondrial membrane potential and decrease ROS concentration through pathways utilizing,64 and pathways independent of SIRT1.65 It is possible that the OE‐80 model, which has increased expression of SIRT1 and a decreased SSM‐ΔΨm, is depleting NAD+ more than wild‐type or knockout models. If this was the case, nicotinamide abundance would be decreased and ROS abundance would be increased, which in turn would be expected to reduce satellite cell proliferation as a result of greater oxidative damage.
As resveratrol‐mediated SIRT1 activation was shown to be protective against ROS‐induced mitochondrial‐mediated apoptotic signalling in muscle,41 and SIRT1 increases antioxidant production in muscle,27, 32 we had expected that mitochondrial function would be improved in muscles that overexpressed SIRT1 after repair following CTX injury mice. However, muscles from OE‐80 animals had the lowest SSM‐ΔΨm and SSM ATP synthase activity. As SSM lie close to satellite cells, we would have expected this mitochondrial subpopulation to have the greatest impact on proliferating satellite cells if mitochondria were important for this process. Nevertheless, the abundance of BrdU positive satellite cell nuclei were not different in muscles among OE‐80, MKO‐80, or SKO animals after repair from CTX‐injury. Thus, the potential for SIRT1 abundance to alter mitochondria did not appear to affect the potential for satellite cell‐proliferation during repair after CTX injury.
p53 protein abundance is increased in SIRT1 variant models that gained improved muscle function after recovery from cardiotoxin‐induced injury
Tumour suppressor p53 is a well‐characterized downstream target of SIRT1. While SIRT1 deacetylation usually inhibits p53 activity, p53 can be upregulated through several pathways, especially in response to cellular stress or damage.66 Indeed, p53 was only found to be significantly increased in the CTX‐injured muscle of the OE‐80 and MKO‐80 models, but only when compared to basal levels of p53 in control muscles that have also recovered from CTX injury. Because one of the main functions of p53 is to repair DNA in response to injury, the presence of p53 in the CTX‐injured muscles provides a plausible explanation as to why our OE‐80 and MKO‐80 mouse models that have opposite protein abundances of SIRT1 could paradoxically both benefit from CTX‐induced injury. Furthermore, p53 has recently begun to emerge as an important factor in exercise metabolism, as genetic knockouts of p53 reduce IFM and SSM mitochondrial yield, inhibit mitochondrial respiration, and reduce exercise capacity during fatiguing exercises in rodent models.67 Interestingly, although the expression of p53 coincides with improved fatigue resistance in the SIRT1 muscle knockout, the improvement in muscle function after CTX‐recovery is markedly greater in the OE‐80 model, indicating high synergy between the abundances of the SIRT1 and the p53 proteins during muscle recovery.
Expression of p53 may underlie the attenuation of MKO‐induced satellite cell proliferation
Previous work has established that SIRT1 expression in satellite cells helps to maintain the quiescence of satellite cells and that eliminating SIRT1 in satellite cells causes premature proliferation.29 Normal downregulation of SIRT1 in satellite cells precedes a metabolic shift from fatty acid metabolism to glycolysis, which is a necessary step for the transition between quiescence and proliferation. Because the metabolic profile of stem cells also acts to regulate proliferation and differentiation,68 it is possible that the increased satellite cell proliferation seen in the MKO mouse model is due to the absence of SIRT1 in muscle that disrupts the necessary metabolic change required to end satellite cell proliferation. This possibility is strengthened by evidence showing that there is an increased abundance of p53 in the CTX‐injected hindlimb muscles of the MKO mouse model and that there is an attenuation of satellite proliferation that was identified by BrdU+ 21‐day post‐CTX injury. This is because overload‐induced muscle growth increases nuclear p5369 and ablating p53 activity reduces myoblast differentiation.70 A likely scenario is that in the absence of SIRT1 in MKO muscle causes satellite cells to undergo increased proliferation (a reduced proliferation ‘off‐signal’), while the overexpression of SIRT1 would inhibit proliferation, which corresponds to a lower number of BrdU+ cells in the OE‐80 model when compared to WT‐80. Ironically, CTX‐induced muscle damage that should promote satellite cell proliferation to stimulate repair also increased p53 expression, which would be expected to inhibit proliferation and promote differentiation in satellite cells of the repairing muscles in MKO‐80 mice and potentially lead to muscle growth/repair. This is consistent with the observation that cell proliferation was attenuated in isolated satellite cells from MKO‐80 mice in vitro after 24 h by EdU analysis.
The synergistic effects of SIRT1 and p53 that improve fatigue resistance after injury may also protect type I fibres from sarcopenic wasting
Although the expression of p53 in the CTX‐recovery hindlimbs of the MKO‐80 mice provides a possible explanation as to why the MKO‐80 mice have attenuated satellite cell proliferation after CTX injury and why injury may induce a protective effect against fatigue, the inhibitory effect that SIRT1 exerts on p53 suggests that co‐expression in muscle fibres should ablate the protective effects of p53 on fatigability. To the contrary, our data show that the OE‐80 mice gain a strong protective effect against fatigue when p53 is upregulated in hindlimbs following CTX injury and even show signs of improving muscle function following injury through post‐activation potentiation.71, 72 One possible explanation is that the inhibition of p53 by SIRT1 only inhibits p53 activity detrimental to oxidative fibres, but not mitochondrial function or DNA repair activity crucial to preventing metabolic ROS damage. Furthermore, p53 is an established upregulator of immobilization‐induced skeletal muscle atrophy.73 Selective inhibition of this activity could explain why type I muscle fibres are resistant to sarcopenic wasting while type II fibres selectively undergo atrophy. It will be interesting to determine in future studies if co‐expression of SIRT1 and p53 selectively inhibit atrophy‐related activity but not the DNA repair functions, thereby ensuring that p53 cannot promote atrophy in oxidative fibres, where SIRT1 is highly expressed.
Study limitations
The loss of older mice which died at old ages prior to conducting these studies and removal of mice due to deteriorating health conditions at old ages limited the number of animals that were available to complete the experiments and therefore reduced the power of the study. The low number of older animals available for this study prevent us from obtaining mitochondrial measures in muscles after repair from CTX. The lower than ideal number of animals may also have contributed to several experiments which had significant differences in their global one‐way ANOVA analyses but failed to detect significant between group differences. Due to the large effect sizes for some of the values calculated by the respective Cohen's d statistics, the likelihood that some differences were masked by the sample size numbers is high. Increasing the power of these experiments and expanding the scope of the mitochondrial aspects of the study to include ROS production and mitochondrial respiration could potentially elucidate a secondary external role of SIRT1 in modifying satellite cell viability through oxidative damage and/or mitochondrial dysfunction.
Conclusions
The expression of SIRT1 in satellite cells is important for the functional development of skeletal muscle both initially and for full muscle regeneration. However, despite its functional significance in immature skeletal muscle, SIRT1 shows modest benefit on muscle mass or muscle function when it is expressed in the older skeletal muscle of C57BL6/j‐background mice after acute injury. Our data suggest that there is little benefit for the physiological force or fatigue responses by overexpression of SIRT1 in vivo in the repaired older skeletal muscle of mice in the absence of any other interventions. However, SIRT1 may synergistically improve the effect of beneficial proteins like p53 after injury, improving muscle adaptability and functionality. Ablation of basal SIRT1 expression in satellite cells, however, critically impacts future/mature muscle function, resulting in lower force production. The MCK‐driven knockout of SIRT1 in the skeletal muscle of older mice showed an improved satellite cell dependent muscle regeneration potential, but this regeneration is possibly attenuated by the expression of p53 after muscle injury. Future work is needed to identify the synergistic effects between SIRT1 and p53 in muscle repair. We speculate that the beneficial effects produced by co‐expression of SIRT1 and p53 may also underlie important mechanisms related to longevity, potentially including the mechanism behind type I fibre preservation during sarcopenia.
Conflict of Interest
M.J.M., D.L.S., A.J.D., D.S.S., J.S.M., J.M.H., and S.E.A. declare that they have no conflict of interest.
Acknowledgements
This project has been funded in part by the National Institutes of Health from the National Heart, Lung and Blood Institute grant HL128485 and the WVU CTSI grant U54GM104942, both awarded to J.M.H., and through funds from the University of Tennessee Health Science Center awarded to S.E.A. This work was also supported by the Community Foundation for the Ohio Valley and the Whipkey Trust, WV‐INBRE (NIH grant P20 GM103434) to the Genomics Core Facility, and the WV Program to Stimulate Competitive Research (PSCoR). We would also like to acknowledge the West Virginia University Microscope Imaging Facility, which is supported by the Mary Babb Randolph Cancer Center and National Institutes of Health grants P20 RR016440, P30 RR032138/GM103488, P20 RR016477, and P20 GM109098. The antibodies BA‐F8, SC‐71, and BF‐F3 were developed by Dr. S. Schiaffino. These antibodies were obtained from the Developmental Studies Hybridoma Bank developed under the auspices of the NICHD and maintained by The University of Iowa, Department of Biology, Iowa City, IA 52242. The authors certify that they comply with the ethical guidelines for authorship and publishing of the Journal of Cachexia, Sarcopenia and Muscle.74
Myers M. J., Shepherd D. L., Durr A. J., Stanton D. S., Mohamed J. S., Hollander J. M., and Alway S. E. (2019) The role of SIRT1 in skeletal muscle function and repair of older mice, Journal of Cachexia, Sarcopenia and Muscle, 10, 929–949, doi: 10.1002/jcsm.12437.
References
- 1. Evans WJ. What is sarcopenia? J Gerontol A Biol Sci Med Sci 1995;50 Spec No:5–8. [DOI] [PubMed] [Google Scholar]
- 2. Cruz‐Jentoft AJ, Landi F, Schneider SM, Zúñiga C, Arai H, Boirie Y, et al. Prevalence of and interventions for sarcopenia in ageing adults: a systematic review. Report of the International Sarcopenia Initiative (EWGSOP and IWGS). Age Ageing 2014;43:748–759. [DOI] [PMC free article] [PubMed] [Google Scholar]
- 3. Stenholm S, Harris TB, Rantanen T, Visser M, Kritchevsky SB, Ferrucci L. Sarcopenic obesity: definition, cause and consequences. Curr Opin Clin Nutr Metab Care 2008;11:693–700. [DOI] [PMC free article] [PubMed] [Google Scholar]
- 4. Alway SE, Mohamed JS, Myers MJ. Mitochondria Initiate and regulate sarcopenia. Exerc Sport Sci Rev 2017;45:58–69. [DOI] [PMC free article] [PubMed] [Google Scholar]
- 5. Bua EA, McKiernan SH, Wanagat J, McKenzie D, Aiken JM. Mitochondrial abnormalities are more frequent in muscles undergoing sarcopenia. J Appl Physiol (1985 2002;92:2617–2624. [DOI] [PubMed] [Google Scholar]
- 6. Thomsen K, Yokota T, Hasan‐Olive MM, Sherazi N, Fakouri NB, Desler C, et al. Initial brain aging: heterogeneity of mitochondrial size is associated with decline in complex I‐linked respiration in cortex and hippocampus. Neurobiol Aging 2018;61:215–224. [DOI] [PubMed] [Google Scholar]
- 7. Jarosz J, Ghosh S, Delbridge LMD, Petzer A, Hickey AJR, Crampin EJ, et al. Changes in mitochondrial morphology and organization can enhance energy supply from mitochondrial oxidative phosphorylation in diabetic cardiomyopathy. Am J Physiol Cell Physiol 2017;312:C190–C197. [DOI] [PubMed] [Google Scholar]
- 8. Marzetti E, Calvani R, Cesari M, Buford TW, Lorenzi M, Behnke BJ, et al. Mitochondrial dysfunction and sarcopenia of aging: from signaling pathways to clinical trials. Int J Biochem Cell Biol 2013;45:2288–2301. [DOI] [PMC free article] [PubMed] [Google Scholar]
- 9. Regmi SG, Rolland SG, Conradt B. Age‐dependent changes in mitochondrial morphology and volume are not predictors of lifespan. Aging (Albany NY) 2014;6:118–130. [DOI] [PMC free article] [PubMed] [Google Scholar]
- 10. Alway SE, MacDougall JD, Sale DG, Sutton JR, McComas AJ. Functional and structural adaptations in skeletal muscle of trained athletes. J Appl Physiol (1985) 1988;64:1114–1120. [DOI] [PubMed] [Google Scholar]
- 11. Demontis F, Piccirillo R, Goldberg AL, Perrimon N. Mechanisms of skeletal muscle aging: insights from Drosophila and mammalian models. Dis Model Mech 2013;6:1339–1352. [DOI] [PMC free article] [PubMed] [Google Scholar]
- 12. Lustgarten MS. MnSOD deficiency results in elevated oxidative stress and decreased mitochondrial function but does not lead to muscle atrophy during aging. Aging Cell 2011;10:493–505. [DOI] [PMC free article] [PubMed] [Google Scholar]
- 13. Haigis MC, Sinclair DA. Mammalian sirtuins: biological insights and disease relevance. Annu Rev Pathol 2010;5:253–295. [DOI] [PMC free article] [PubMed] [Google Scholar]
- 14. Houtkooper RH, Pirinen E, Auwerx J. Sirtuins as regulators of metabolism and healthspan. Nat Rev Mol Cell Biol 2012;13:225–238. [DOI] [PMC free article] [PubMed] [Google Scholar]
- 15. Lee D, Goldberg AL. SIRT1 protein, by blocking the activities of transcription factors FoxO1 and FoxO3, inhibits muscle atrophy and promotes muscle growth. J Biol Chem 2013;288:30515–30526. [DOI] [PMC free article] [PubMed] [Google Scholar]
- 16. Brandon AE, Tid‐Ang J, Wright LE, Stuart E, Suryana E, Bentley N, et al. Overexpression of SIRT1 in rat skeletal muscle does not alter glucose induced insulin resistance. PLoS ONE 2015;10:e0121959. [DOI] [PMC free article] [PubMed] [Google Scholar]
- 17. Dugdale HF, Hughes DC, Allan R, Deane CS, Coxon CR, Morton JP, et al. The role of resveratrol on skeletal muscle cell differentiation and myotube hypertrophy during glucose restriction. Mol Cell Biochem 2018;444:109–123. [DOI] [PMC free article] [PubMed] [Google Scholar]
- 18. Purushotham A, Schug TT, Xu Q, Surapureddi S, Guo X, Li X. Hepatocyte‐specific deletion of SIRT1 alters fatty acid metabolism and results in hepatic steatosis and inflammation. Cell Metab 2009;9:327–338. [DOI] [PMC free article] [PubMed] [Google Scholar]
- 19. Rasbach KA, Gupta RK, Ruas JL, Wu J, Naseri E, Estall JL, et al. PGC‐1alpha regulates a HIF2alpha‐dependent switch in skeletal muscle fiber types. Proc Natl Acad Sci U S A 2010;107:21866–21871. [DOI] [PMC free article] [PubMed] [Google Scholar]
- 20. Canto C, Gerhart‐Hines Z, Feige JN, Lagouge M, Noriega L, Milne JC, et al. AMPK regulates energy expenditure by modulating NAD+ metabolism and SIRT1 activity. Nature 2009;458:1056–1060. [DOI] [PMC free article] [PubMed] [Google Scholar]
- 21. Nemoto S, Fergusson MM, Finkel T. SIRT1 functionally interacts with the metabolic regulator and transcriptional coactivator PGC‐1{alpha}. J Biol Chem 2005;280:16456–16460. [DOI] [PubMed] [Google Scholar]
- 22. Philp A, Chen A, Lan D, Meyer GA, Murphy AN, Knapp AE, et al. Sirtuin 1 (SIRT1) deacetylase activity is not required for mitochondrial biogenesis or peroxisome proliferator activated receptor‐{gamma} coactivator‐1{alpha} (PGC‐1{alpha}) deacetylation following endurance exercise. J Biol Chem 2011;286:30561–30570. [DOI] [PMC free article] [PubMed] [Google Scholar]
- 23. Conboy IM, Rando TA. Aging, stem cells and tissue regeneration: lessons from muscle. Cell Cycle 2005;4:407–410. [DOI] [PubMed] [Google Scholar]
- 24. Brooks MJ, Hajira A, Mohamed JS, Alway SE. Voluntary wheel running increases satellite cell abundance and improves recovery from disuse in gastrocnemius muscles from mice. J Appl Physiol (1985 2018;124:1616–1628. [DOI] [PMC free article] [PubMed] [Google Scholar]
- 25. Hwang AB, Brack AS. Muscle stem cells and aging. Curr Top Dev Biol 2018;126:299–322. [DOI] [PubMed] [Google Scholar]
- 26. Day K, Shefer G, Shearer A, Yablonka‐Reuveni Z. The depletion of skeletal muscle satellite cells with age is concomitant with reduced capacity of single progenitors to produce reserve progeny. Dev Biol 2010;340:330–343. [DOI] [PMC free article] [PubMed] [Google Scholar]
- 27. Alway SE, McCrory JL, Kearcher K, Vickers A, Frear B, Gilleland DL, et al. Resveratrol enhances exercise‐induced cellular and functional adaptations of skeletal muscle in older men and women. J Gerontol A Biol Sci Med Sci 2017;72:1595–1606. [DOI] [PMC free article] [PubMed] [Google Scholar]
- 28. Saini A, Al‐Shanti N, Sharples AP, Stewart CE. Sirtuin 1 regulates skeletal myoblast survival and enhances differentiation in the presence of resveratrol. Exp Physiol 2012;97:400–418. [DOI] [PubMed] [Google Scholar]
- 29. Ryall JG, Dell'Orso S, Derfoul A, Juan A, Zare H, Feng X, et al. The NAD(+)‐dependent SIRT1 deacetylase translates a metabolic switch into regulatory epigenetics in skeletal muscle stem cells. Cell Stem Cell 2015;16:171–183. [DOI] [PMC free article] [PubMed] [Google Scholar]
- 30. Shefer G, Rauner G, Yablonka‐Reuveni Z, Benayahu D. Reduced satellite cell numbers and myogenic capacity in aging can be alleviated by endurance exercise. PLoS ONE 2010;5:e13307. [DOI] [PMC free article] [PubMed] [Google Scholar]
- 31. Kwon Y, Kim J, Lee CY, Kim H. Expression of SIRT1 and SIRT3 varies according to age in mice. Anat Cell Biol 2015;48:54–61. [DOI] [PMC free article] [PubMed] [Google Scholar]
- 32. Jackson JR, Ryan MJ, Alway SE. Long‐term supplementation with resveratrol alleviates oxidative stress but does not attenuate sarcopenia in aged mice. J Gerontol A Biol Sci Med Sci 2011;66:751–764. [DOI] [PMC free article] [PubMed] [Google Scholar]
- 33. Del Campo A, Contreras‐Hernández I, Castro‐Sepúlveda M, Campos CA, Figueroa R, Tevy MF, et al. Muscle function decline and mitochondria changes in middle age precede sarcopenia in mice. Aging (Albany NY) 2018;10:34–55. [DOI] [PMC free article] [PubMed] [Google Scholar]
- 34. Ohno Y, Matsuba Y, Hashimoto N, Sugiura T, Ohira Y, Yoshioka T, et al. Suppression of myostatin stimulates regenerative potential of injured antigravitational soleus muscle in mice under unloading condition. Int J Med Sci 2016;13:680–685. [DOI] [PMC free article] [PubMed] [Google Scholar]
- 35. Bloemberg D, Quadrilatero J. Rapid determination of myosin heavy chain expression in rat, mouse, and human skeletal muscle using multicolor immunofluorescence analysis. PLoS ONE 2012;7:e35273. [DOI] [PMC free article] [PubMed] [Google Scholar]
- 36. Pasut A, Chang NC, Gurriaran‐Rodriguez U, Faulkes S, Yin H, Lacaria M, et al. Notch signaling rescues loss of satellite cells lacking Pax7 and promotes brown adipogenic differentiation. Cell Rep 2016;16:333–343. [DOI] [PMC free article] [PubMed] [Google Scholar]
- 37. Liu L, Cheung TH, Charville GW, Rando TA. Isolation of skeletal muscle stem cells by fluorescence‐activated cell sorting. Nat Protoc 2015;10:1612–1624. [DOI] [PMC free article] [PubMed] [Google Scholar]
- 38. Mohamed JS, Wilson JC, Myers MJ, Sisson KJ, Alway SE. Dysregulation of SIRT‐1 in aging mice increases skeletal muscle fatigue by a PARP‐1‐dependent mechanism. Aging (Albany NY) 2014;6:820–834. [DOI] [PMC free article] [PubMed] [Google Scholar]
- 39. Rothermel B, Vega RB, Yang J, Wu H, Bassel‐Duby R, Williams RS. A protein encoded within the Down syndrome critical region is enriched in striated muscles and inhibits calcineurin signaling. J Biol Chem 2000;275:8719–8725. [DOI] [PubMed] [Google Scholar]
- 40. Siu PM, Pistilli EE, Butler DC, Alway SE. Aging influences cellular and molecular responses of apoptosis to skeletal muscle unloading. Am J Physiol Cell Physiol 2005;288:C338–C349. [DOI] [PubMed] [Google Scholar]
- 41. Haramizu S, Asano S, Butler DC, Stanton DA, Hajira A, Mohamed JS, et al. Dietary resveratrol confers apoptotic resistance to oxidative stress in myoblasts. J Nutr Biochem 2017;50:103–115. [DOI] [PMC free article] [PubMed] [Google Scholar]
- 42. Takahashi H, Suzuki Y, Mohamed JS, Gotoh T, Pereira SL, Alway SE. Epigallocatechin‐3‐gallate increases autophagy signaling in resting and unloaded plantaris muscles but selectively suppresses autophagy protein abundance in reloaded muscles of aged rats. Exp Gerontol 2017;92:56–66. [DOI] [PMC free article] [PubMed] [Google Scholar]
- 43. Croston TL, Thapa D, Holden AA, Tveter KJ, Lewis SE, Shepherd DL, et al. Functional deficiencies of subsarcolemmal mitochondria in the type 2 diabetic human heart. Am J Physiol Heart Circ Physiol 2014;307:H54–H65. [DOI] [PMC free article] [PubMed] [Google Scholar]
- 44. Dabkowski ER, Williamson CL, Bukowski VC, Chapman RS, Leonard SS, Peer CJ, et al. Diabetic cardiomyopathy‐associated dysfunction in spatially distinct mitochondrial subpopulations. Am J Physiol Heart Circ Physiol 2009;296:H359–H369. [DOI] [PMC free article] [PubMed] [Google Scholar]
- 45. Nichols CE, Shepherd DL, Knuckles TL, Thapa D, Stricker JC, Stapleton PA, et al. Cardiac and mitochondrial dysfunction following acute pulmonary exposure to mountaintop removal mining particulate matter. Am J Physiol Heart Circ Physiol 2015;309:H2017–H2030. [DOI] [PMC free article] [PubMed] [Google Scholar]
- 46. Ryan MJ, Jackson JR, Hao Y, Leonard SS, Alway SE. Inhibition of xanthine oxidase reduces oxidative stress and improves skeletal muscle function in response to electrically stimulated isometric contractions in aged mice. Free Radic Biol Med 2011;51:38–52. [DOI] [PMC free article] [PubMed] [Google Scholar]
- 47. Wang Y, Mohamed JS, Alway SE. M‐cadherin‐inhibited phosphorylation of B‐catenin augments differentiation of mouse myoblasts. Cell Tissue Res 2013;351:183–200. [DOI] [PMC free article] [PubMed] [Google Scholar]
- 48. Suwa M, Nakano H, Radak Z, Kumagai S. Endurance exercise increases the SIRT1 and peroxisome proliferator‐activated receptor gamma coactivator‐1alpha protein expressions in rat skeletal muscle. Metabolism 2008;57:986–998. [DOI] [PubMed] [Google Scholar]
- 49. Nilwik R, Snijders T, Leenders M, Groen BB, van Kranenburg J, Verdijk LB, et al. The decline in skeletal muscle mass with aging is mainly attributed to a reduction in type II muscle fiber size. Exp Gerontol 2013;48:492–498. [DOI] [PubMed] [Google Scholar]
- 50. Chalkiadaki A, Igarashi M, Nasamu AS, Knezevic J, Guarente L. Muscle‐specific SIRT1 gain‐of‐function increases slow‐twitch fibers and ameliorates pathophysiology in a mouse model of duchenne muscular dystrophy. PLoS Genet 2014;10:e1004490. [DOI] [PMC free article] [PubMed] [Google Scholar]
- 51. Rodgers JT, Lerin C, Gerhart‐Hines Z, Puigserver P. Metabolic adaptations through the PGC‐1 alpha and SIRT1 pathways. FEBS Lett 2008;582:46–53. [DOI] [PMC free article] [PubMed] [Google Scholar]
- 52. Sousa‐Victor P, Munoz‐Canoves P. Regenerative decline of stem cells in sarcopenia. Mol Asp Med 2016;50:109–117. [DOI] [PubMed] [Google Scholar]
- 53. Herbst A, Pak JW, McKenzie D, Bua E, Bassiouni M, Aiken JM. Accumulation of mitochondrial DNA deletion mutations in aged muscle fibers: evidence for a causal role in muscle fiber loss. J Gerontol A Biol Sci Med Sci 2007;62:235–245. [DOI] [PMC free article] [PubMed] [Google Scholar]
- 54. Williamson CL, Dabkowski ER, Baseler WA, Croston TL, Alway SE, Hollander JM. Enhanced apoptotic propensity in diabetic cardiac mitochondria: influence of subcellular spatial location. Am J Physiol Heart Circ Physiol 2010;298:H633–H642. [DOI] [PMC free article] [PubMed] [Google Scholar]
- 55. Parihar MS, Brewer GJ. Simultaneous age‐related depolarization of mitochondrial membrane potential and increased mitochondrial reactive oxygen species production correlate with age‐related glutamate excitotoxicity in rat hippocampal neurons. J Neurosci Res 2007;85:1018–1032. [DOI] [PubMed] [Google Scholar]
- 56. Canto C, Auwerx J. Caloric restriction, SIRT1 and longevity. Trends Endocrinol Metab 2009;20:325–331. [DOI] [PMC free article] [PubMed] [Google Scholar]
- 57. Hughes DC, Marcotte GR, Marshall AG, West DW, Baehr LM, Wallace MA, et al. Age‐related differences in dystrophin: impact on force transfer proteins, membrane integrity, and neuromuscular junction stability. J Gerontol A Biol Sci Med Sci 2017;72:640–648. [DOI] [PMC free article] [PubMed] [Google Scholar]
- 58. Picca A, Lezza AMS, Leeuwenburgh C, Pesce V, Calvani R, Bossola M, et al. Circulating mitochondrial DNA at the crossroads of mitochondrial dysfunction and inflammation during aging and muscle wasting disorders. Rejuvenation Res 2018;21:350–359. [DOI] [PMC free article] [PubMed] [Google Scholar]
- 59. Amat R, Planavila A, Chen SL, Iglesias R, Giralt M, Villarroya F. SIRT1 controls the transcription of the peroxisome proliferator‐activated receptor‐gamma co‐activator‐1alpha (PGC‐1alpha) gene in skeletal muscle through the PGC‐1alpha autoregulatory loop and interaction with MyoD. J Biol Chem 2009;284:21872–21880. [DOI] [PMC free article] [PubMed] [Google Scholar]
- 60. Marzetti E, Csiszar A, Dutta D, Balagopal G, Calvani R, Leeuwenburgh C. Role of mitochondrial dysfunction and altered autophagy in cardiovascular aging and disease: from mechanisms to therapeutics. Am J Physiol Heart Circ Physiol 2013;305:H459–H476. [DOI] [PMC free article] [PubMed] [Google Scholar]
- 61. Sun N, Youle RJ, Finkel T. The mitochondrial basis of aging. Mol Cell 2016;61:654–666. [DOI] [PMC free article] [PubMed] [Google Scholar]
- 62. Seo DY, Lee SR, Kim N, Ko KS, Rhee BD, Han J. Age‐related changes in skeletal muscle mitochondria: the role of exercise. Integr Med Res 2016;5:182–186. [DOI] [PMC free article] [PubMed] [Google Scholar]
- 63. Braidy N, Guillemin GJ, Mansour H, Chan‐Ling T, Poljak A, Grant R. Age related changes in NAD+ metabolism oxidative stress and SIRT1 activity in wistar rats. PLoS ONE 2011;6:e19194. [DOI] [PMC free article] [PubMed] [Google Scholar] [Retracted]
- 64. Jang SY, Kang HT, Hwang ES. Nicotinamide‐induced mitophagy: event mediated by high NAD+/NADH ratio and SIRT1 protein activation. J Biol Chem 2012;287:19304–19314. [DOI] [PMC free article] [PubMed] [Google Scholar]
- 65. Song SB, Jang SY, Kang HT, Wei B, Jeoun UW, Yoon GS, et al. Modulation of mitochondrial membrane potential and ROS generation by nicotinamide in a manner independent of SIRT1 and mitophagy. Mol Cells 2017;40:503–514. [DOI] [PMC free article] [PubMed] [Google Scholar]
- 66. Williams AB, Schumacher B. p53 in the DNA‐damage‐repair process. Cold Spring Harb Perspect Med 2016;6: 10.1101/cshperspect.a026070. [DOI] [PMC free article] [PubMed] [Google Scholar]
- 67. Bartlett JD, Close GL, Drust B, Morton JP. The emerging role of p53 in exercise metabolism. Sports Med 2014;44:303–309. [DOI] [PubMed] [Google Scholar]
- 68. Pala F, Di Girolamo D, Mella S, Yennek S, Chatre L, Ricchetti M, et al. Distinct metabolic states govern skeletal muscle stem cell fates during prenatal and postnatal myogenesis. J Cell Sci 2018;131:jcs212977. [DOI] [PMC free article] [PubMed] [Google Scholar]
- 69. Siu PM, Alway SE. Subcellular responses of p53 and Id2 in fast and slow skeletal muscle in response to stretch‐induced overload. J Appl Physiol (1985 2005;99:1897–1904. [DOI] [PubMed] [Google Scholar]
- 70. Porrello A, Cerone MA, Coen S, Gurtner A, Fontemaggi G, Cimino L, et al. p53 regulates myogenesis by triggering the differentiation activity of pRb. J Cell Biol 2000;151:1295–1304. [DOI] [PMC free article] [PubMed] [Google Scholar]
- 71. Alway SE, Hughson RL, Green HJ, Patla AE, Frank JS. Twitch potentiation after fatiguing exercise in man. Eur J Appl Physiol 1987;56:461–466. [DOI] [PubMed] [Google Scholar]
- 72. Lorenz D. Postactivation potentiation: an introduction. Int J Sports Phys Ther 2011;6:234–240. [PMC free article] [PubMed] [Google Scholar]
- 73. Siu PM, Alway SE. Id2 and p53 participate in apoptosis during unloading‐induced muscle atrophy. Am J Physiol Cell Physiol 2005;288:C1058–C1073. [DOI] [PubMed] [Google Scholar]
- 74. von Haehling S, Morley JE, Coats AJS, Anker SD. Ethical guidelines for publishing in the journal of cachexia, sarcopenia and muscle: update 2017. J Cachexia Sarcopenia Muscle 2017;8:1081–1083. [DOI] [PMC free article] [PubMed] [Google Scholar]