

Abstract
Background
Body composition assessment, measured using single‐slice computed tomography (CT) image at L3 level, and aerobic physical fitness, objectively measured using cardiopulmonary exercise testing (CPET), are each independently used for perioperative risk assessment. Sarcopenia (i.e. low skeletal muscle mass), myosteatosis [i.e. low skeletal muscle radiation attenuation (SM‐RA)], and impaired objectively measured aerobic fitness (reduced oxygen uptake) have been associated with poor post‐operative outcomes and survival in various cancer types. However, the association between CT body composition and physical fitness has not been explored. In this study, we assessed the association of CT body composition with selected CPET variables in patients undergoing hepatobiliary and pancreatic surgery.
Methods
A pragmatic prospective cohort of 123 patients undergoing hepatobiliary and pancreatic surgery were recruited. All patients underwent preoperative CPET. Preoperative CT scans were analysed using a single‐slice CT image at L3 level to assess skeletal muscle mass, adipose tissue mass, and muscle radiation attenuation. Multivariate linear regression was used to test the association between CPET variables and body composition. Main outcomes were oxygen uptake at anaerobic threshold ( O2 at AT), oxygen uptake at peak exercise ( O2 peak), skeletal muscle mass, and SM‐RA.
Results
Of 123 patients recruited [77 men (63%), median age 66.9 ± 11.7, median body mass index 27.3 ± 5.2], 113 patients had good‐quality abdominal CT scans available and were included. Of the CT body composition variables, SM‐RA had the strongest correlation with O2 peak (r = 0.57, P < 0.001) and O2 at AT (r = 0.45, P < 0.001) while skeletal muscle mass was only weakly associated with O2 peak (r = 0.24, P < 0.010). In the multivariate analysis, only SM‐RA was associated with O2 peak (B = 0.25, 95% CI 0.15–0.34, P < 0.001, R 2 = 0.42) and O2 at AT (B = 0.13, 95% CI 0.06–0.18, P < 0.001, R 2 = 0.26).
Conclusions
There is a positive association between preoperative CT SM‐RA and preoperative physical fitness ( O2 at AT and at peak). This study demonstrates that myosteatosis, and not sarcopenia, is associated with reduced aerobic physical fitness. Combining both myosteatosis and physical fitness variables may provide additive risk stratification accuracy and guide interventions during the perioperative period.
Keywords: Body composition, Cardiopulmonary exercise testing, Physical fitness, Sarcopenia, Myosteatosis, Oxygen uptake
Background
Despite improvement in surgical techniques, multimodal cancer therapies and perioperative care, morbidity, and mortality after major hepatobiliary and pancreatic (HPB) cancer surgery still pose substantial challenges. Accurate perioperative risk assessment prior to major cancer surgery is not personalized and is still substantially variable in the precision of outcome prediction. Identifying patients who are at risk of poor outcomes is a priority in order to facilitate shared decision making, inform prehabilitation and co‐morbidity management initiatives before surgery, and guide intra‐operative and post‐operative care. Various scoring systems exist for the risk stratification of these patients; however, few are objective. The importance of objectively measured aerobic physical fitness [using cardiopulmonary exercise testing (CPET)]1 and objectively defined body composition variables such as sarcopenia2, 3, 4, 5 or myosteatosis6 [using routinely performed abdominal computed tomography (CT) scanning] as major contributors to poor post‐operative outcomes and death has so far been studied separately.
CPET provides an objective assessment of physical fitness through evaluating cardio‐respiratory function under the stress of exercise mimicking the stress of major surgery. This has been widely adopted in the UK as a preoperative test to objectively evaluate perioperative risk,7 and international guidelines for CPET conduct have recently been published.8 The ability of CPET to identify patients at risk of poor outcomes is used clinically to guide perioperative care and clinical decision making, and it informs about the shared decision‐making process.1, 9 We have previously reported that selected CPET variables such as oxygen uptake at estimated lactate threshold or anaerobic threshold ( O2 at AT) and at peak exercise ( O2 peak) are associated with worse outcome following colorectal surgery10, 11, 12 and neoadjuvant cancer treatments.13, 14 Poor physical fitness is highly prevalent in HPB cancer patients and associated with poor post‐operative outcomes and survival.15, 16, 17, 18, 19
Body composition analysed by using a single‐slice CT image at the third lumbar vertebra (L3) is strongly correlated with total body skeletal muscle mass.20 The area of visceral adipose tissue (VAT) and subcutaneous adipose tissue (SAT) can also be accurately estimated using this methodology. In addition, CT scans contain information about the radio density of a specific tissue type in Hounsfield unit (HU), which is referred to as radiation attenuation (RA). Low muscle RA is considered a surrogate of increased intramyocellular triglycerides, increased water content (i.e. muscle oedema), change in muscle structure, and dysregulated host systemic inflammatory response.21, 22, 23 A recent review showed that skeletal muscle RA, referred to as myosteatosis (SM‐RA), is highly prevalent in cancer patients.23 Sarcopenia and myosteatosis have been found to be independent prognostic factors of reduced survival and poor outcome after surgery or neoadjuvant treatments in various cancers including pancreatic,4, 24 colorectal,25, 26 gastric,27 esophageal,28, 29 and ovarian cancers.30 This relationship was less evident in colorectal liver metastasis patients.31, 32, 33, 34 It is hypothesized that changes in muscle tissue composition such as low SM‐RA (myosteatosis) results in diminished muscle function phenotypically expressed as poor resilience that may potentially be reversed by improving activity levels or exercise interventions.5, 35 Therefore, low SM‐RA is often reported as an indicator of ‘poor muscle quality’. However, the association between low SM‐RA and physical fitness has not previously been evaluated. We therefore aimed to assess the association of low SM‐RA (i.e. myosteatosis), low skeletal muscle mass (i.e. sarcopenia), and selected CPET variables (i.e. aerobic physical fitness) in a representative HPB population.
Methods
Subjects and data collection
All consecutive patients undergoing CPET and HPB surgery between January 2014 and January 2018, at the University Hospital Southampton NHS Foundation Trust HPB Unit, UK, were included in a prospective cohort and were eligible for inclusion. The study was reviewed and approved by the South East Scotland Research Ethics Committee (16/SS/0188) and is registered with clinicaltrials.gov (NCT03641118). All patients had a histological or radiological diagnosis of operable liver metastases (melanoma, colorectal, breast), periampullary carcinoma, hepatocellular carcinoma, or benign disease necessitating major liver or pancreas resections. A minority of patients underwent neoadjuvant cycles of capecitabine and oxaliplatin prior to colorectal liver metastasis surgery. This represented a pragmatic prospectively collected patient cohort reflecting a busy tertiary HPB referral centre. All patients underwent CPET before surgery. Body composition was assessed using a preoperative single‐slice CT image at the level of the third lumbar vertebra (L3). Patients without a good‐quality preoperative abdominal CT scan were excluded. CT scans were defined as poor quality if they had large radiation artefacts or profound muscle oedema. Preoperative plasma levels of haemoglobin, creatinine, albumin, and C‐reactive protein were assessed within 7 days of the planned surgery. The albumin and C‐reactive protein levels were used to calculate the modified Glasgow prognostic score (mGPS).36 Additional data collection included sex, age, body mass index (BMI), American Society of Anesthesiologists (ASA) classification, type of surgery, and histopathology diagnosis. Primary outcomes were O2 at AT and O2 peak (mL·kg−1·min−1). Secondary outcomes included 1 year all‐cause mortality and length of hospital stay; both were measured from day of surgery.
Cardiopulmonary exercise testing
CPET was conducted according to standardized methods published elsewhere by the Perioperative Exercise Testing and Training Society and endorsed by the Association for Respiratory Technology & Physiology in the UK.8 In short, after resting spirometry (flow‐volume loops), CPET on an electromagnetically braked cycle ergometer (Ergoselect 200; Ergoline, Bitz, Germany) comprised 3 min resting (to allow gas exchange variables to stabilize), 3 min freewheel pedalling, and then a ramped incremental protocol until volitional termination followed by 5 min recovery data collection. Ventilation and gas exchange were measured using a metabolic cart. Heart rate, full disclosure 12‐lead electrocardiogram, blood pressure, and pulse oximetry were monitored throughout. Ramp gradient was based on a calculation using predicted freewheel O2, predicted O2 peak, height, and age with the aim of achieving a 10 min ramp stage. All CPETs were analysed by experienced accredited perioperative CPET practitioners (D. Z. H. L./M. R. E.) who were blinded to CT scan variables and clinical outcome variables.
Computed tomography scan analysis
The preoperative CT scan performed nearest to the date of surgery was selected for analysis (max 4 weeks before surgery and after completion of neoadjuvant chemotherapy). Abdominal CT scans were analysed in an anonymized and blinded format by one researcher trained in body composition analysis (D. P. J. V. D.) as described before.24 Briefly, a single‐slice CT image at the level of the third lumbar vertebra (L3) was selected. CT scans were assessed with sliceOmatic 5.0 (TomoVision, Magog, Canada) for Microsoft Windows®. With the use of predefined HU ranges, the cross‐sectional areas (cm2) of skeletal muscle (SM; −29 to 150 HU), VAT (−150 to −50 HU), and SAT (−190 to −30 HU) were assessed. The cross‐sectional area was then adjusted for height squared to calculate the L3 index (cm2·m−2), which is strongly correlated with total body SM and adipose tissue mass.20 In addition, the average RA in HU was assessed for all tissues (SM‐RA, VAT‐RA, and SAT‐RA). A low RA is associated with increased tissue triglyceride content.23 Analyses were blinded to CPET and outcome variables.
Statistical analysis
Data were analysed using IBM SPSS Statistics 23 for Microsoft Windows. Continuous data were compared using an independent t‐test, the Mann–Whitney U‐test was used for non‐parametric variables, and the χ 2 test was used for categorical variables. As the cohort size was too small for cut‐point finding approaches such as optimum stratification, gender‐specific cut points were set at the median for each CT body composition and CPET variable.37 The association of body composition and other clinical variables on CPET derived O2 at AT and O2 peak was assessed using linear regression. First, all clinical variables were tested separately in an unadjusted univariate model (Model 1). Then, variables were ordered from lowest to highest P‐value from Model 1 and were added one by one to the multivariate linear regression model (Model 2). After each addition, an F‐test was performed to test whether the added variables significantly improved the model fit. If the F‐test P‐value was <0.05, the variable was kept in the model; otherwise, it was removed. Univariate and multivariate Cox regression and logistic regression were used for, respectively, overall survival and 1 year survival. Variables with a P < 0.1 in the univariate analysis were included into the multivariate analysis. For correlations, Pearson's correlation coefficient was used (r) for normally distributed data and the Spearman correlation coefficient (r s) for non‐normally distributed data.
Results
Patients
One hundred twenty‐three patients were included during the study. Liver resections consisted of liver metastases (39 patients; 1 benign and 15 neoadjuvant chemotherapy), hepatocellular carcinoma (5 patients), and other major liver resections (median 2 liver segments resected; 15 patients; 9 patients benign). Pancreatic resections consisted of pancreatic neoplasms (29 patients; 5 benign), ampullary carcinoma (16 patients), cholangiocarcinoma (16 patients; 3 benign), and intraductal papillary mucinous neoplasm (3 patients). Ten patients were excluded for CT scan analysis because they did not have a suitable preoperative CT scan available. Patient characteristics are shown in Table 1, including the distribution among skeletal muscle mass, SM‐RA, and the main CPET parameters split into high and low groups at the gender‐specific medians for men and women, respectively: SM mass, 50.7 and 38.4 cm2·m−2; SM‐RA, 37.1 and 30.4 HU; O2 at AT, 9.4 and 9.3 mL·kg−1·min−1; and O2 peak, 16.0 and 14.3 mL·kg−1·min−1. Patients with low skeletal muscle mass, SM‐RA, low O2 at AT, and low O2 peak were significantly older. No significant differences could be detected in body composition or fitness variables when comparing benign vs. malignant or liver vs. pancreas groups. Significantly lower haemoglobin was seen in the low O2 at AT and O2 peak groups; however, no difference was found in skeletal muscle mass and SM‐RA. No significant differences could be detected in C‐reactive protein, GPS, and white cell counts. However, there were weak correlations between SM‐RA and both acute phase proteins C‐reactive protein (r s = −0.22, P = 0.02) and albumin (r s = 0.19, P = 0.04).
Table 1.
Patient characteristics according to several computed tomography body composition and cardiopulmonary exercise testing variables
| Patient characteristics | Overall | SM‐RA | O2 at AT (mL·kg−1·min−1) | O2 peak (mL·kg−1·min−1) | ||||||
|---|---|---|---|---|---|---|---|---|---|---|
| Low | High | P‐value | Low | High | P‐value | Low | High | P‐value | ||
| Age (years) | 66.9 ± 11.7 | 71.1 ± 8.5 | 63.0 ± 13.4 | <0.001* | 70.2 ± 10.1 | 63.6 ± 12.3 | 0.002* | 71.4 ± 8.8 | 62.3 ± 12.5 | <0.001* |
| Male (n, %) | 77 (63%) | 36 (63%) | 35 (63%) | 0.942 | 39 (63%) | 38 (62%) | 0.944 | 39 (63%) | 38 (62%) | 0.944 |
| BMI (kg·m−2) | 27.3 ± 5.2 | 29.1 ± 4.6 | 26.1 ± 4.3 | 0.001* | 28.1 ± 5.9 | 26.5 (4.3) | 0.082 | 28.1 ± 5.8 | 26.5 ± 4.4 | 0.097 |
| ASAa | ||||||||||
| 2 | 80 (65%) | 36 (63%) | 37 (66%) | 0.699 | 36 (58%) | 44 (72%) | 0.093 | 34 (55%) | 46 (75%) | 0.015* |
| 3 | 42 (34%) | 20 (35%) | 19 (34%) | 25 (40%) | 17 (28%) | 27 (44%) | 15 (25%) | |||
| 4 | 1 (1%) | 1 (2%) | — | 1 (2%) | — | 1 (2%) | — | |||
| Organ (n, %) | ||||||||||
| Liver | 59 (48%) | 28 (49%) | 29 (52%) | 0.777 | 31 (50%) | 28 (46%) | 0.649 | 32 (52%) | 27 (44%) | 0.415 |
| Pancreas | 64 (52%) | 29 (51%) | 27 (48%) | 31 (50%) | 33 (54%) | 30 (48%) | 34 (56%) | |||
| Malignant (n, %) | 103 (84%) | 49 (86%) | 47 (84%) | 0.762 | 52 (84%) | 51 (84%) | 0.968 | 50 (81%) | 53 (87%) | 0.348 |
| Haemoglobin (g·L−1) | 127.8 ± 17.7 | 128.0 ± 17.0 | 128.2 ± 19.6 | 0.963 | 124.1 ± 17.8 | 131.5 ± 17.0 | 0.019* | 123.7 ± 18.1 | 132.0 ± 16.4 | 0.009* |
| Creatinine (μmol·L−1) | 77.9 ± 22.6 | 81.1 ± 26.1 | 74.4 ± 19.2 | 0.123 | 81.8 ± 26.0 | 74.0 ± 17.9 | 0.057 | 82.9 ± 26.0 | 72.9 ± 17.3 | 0.014* |
| White blood count (10 × 9 L−1) | 8.1 ± 5.5 | 7.7 ± 1.8 | 8.5 ± 7.9 | 0.428 | 9.0 ± 7.3 | 7.2 ± 2.2 | 0.068 | 8.8 ± 7.3 | 7.4 ± 2.4 | 0.154 |
| C‐reactive protein (mg·L−1)a , b | 12.1 ± 19.9 | 13.8 ± 20.4 | 11.7 ± 20.9 | 0.073 | 9.6 ± 12.7 | 14.6 ± 24.8 | 0.623 | 11.7 ± 15.1 | 12.6 ± 23.9 | 0.063 |
| Albumin (g·L−1)b | 36.2 ± 4.7 | 35.7 ± 4.2 | 36.5 ± 5.2 | 0.348 | 36.0 ± 4.7 | 36.3 ± 4.8 | 0.790 | 35.6 ± 4.7 | 36.8 ± 4.7 | 0.170 |
| mGPS (n, %)a , b | 0.851 | |||||||||
| 0 | 79 (67%) | 37 (69%) | 34 (63%) | 0.736 | 39 (69%) | 40 (67%) | 0.900 | 39 (67%) | 40 (68%) | |
| 1 | 16 (14%) | 5 (9%) | 10 (19%) | 7 (12%) | 9 (15%) | 7 (12%) | 9 (15%) | |||
| 2 | 22 (19%) | 12 (22%) | 10 (19%) | 11 (19%) | 11 (18%) | 12 (21%) | 10 (17%) | |||
| Hospital stay (days)a | 12.3 ± 10.3 | 12.8 ± 11.3 | 11.9 ± 10.1 | 0.822 | 12.8 ± 10.4 | 11.8 ± 10.3 | 0.487 | 13.9 ± 11.0 | 10.6 ± 9.3 | 0.048* |
| 1 year mortality (n, %) | 18 (14.6%) | 11 (19%) | 7 (13%) | 0.323 | 11 (18%) | 7 (12%) | 0.326 | 13 (21%) | 5 (8%) | 0.045* |
Cut‐offs for low and high groups were set at the gender‐specific median for SM‐RA, O2 at AT (mL·kg−1·min−1), and O2 peak (mL·kg−1·min−1).
ASA, American Society of Anesthesiologists; BMI, body mass index; mGPS, modified Glasgow prognostic score; SM‐RA, skeletal muscle radiation attenuation; O2 at AT, oxygen uptake at anaerobic threshold; O2 peak, oxygen uptake at peak exercise.
Mann–Whitney U‐test.
Missing data: C‐reactive protein (n = 6), albumin (n = 1), and mGPS (n = 7).
Significant P‐value < 0.05.
All 123 patients underwent CPET, of which six patients were not able to achieve an anaerobic threshold (all six died at 1 year follow‐up). No CPET‐related adverse events occurred. For both CT and CPET assessments, there were significant differences between genders. In short, men had higher SM (P < 0.001), VAT (P < 0.001), SM‐RA (P = 0.001), and SAT‐RA (P = 0.048), while women had higher SAT (P < 0.001); see Figure 1. For CPET results, men had higher O2 at AT (P < 0.001), oxygen pulse ( O2/Heart RateR) at AT (P < 0.001), ventilatory equivalent for carbon dioxide at AT ( E/ CO2 at AT) (P < 0.001), work rate at AT (P < 0.001), O2 peak in litres per minute (P < 0.001), O2 peak adjusted for weight (P = 0.033), O2/Heart Rate at peak (P < 0.001), and work rate at peak (P < 0.001). Table 2 shows gender‐specific comparisons for all CPET variables according to SM‐RA. Weight‐adjusted O2 at AT for men (P = 0.019) but not for women (P > 0.05) was significantly higher in the high SM‐RA group. Weight‐adjusted O2 peak was higher in the high SM‐RA grouped for both men and women (men, P = 0.002; women, P = 0.008). A higher work rate at AT and peak was also seen in both groups at high SM‐RA values, with significant differences in women (AT P = 0.030 and peak P = 0.016). Furthermore, a significantly lower E/ CO2 slope for both men and women (men, P = 0.014 and women, P = 0.005) and E/ CO2 at AT and peak (P = 0.018 and P = 0.025) for men were observed in the higher SM‐RA groups.
Figure 1.
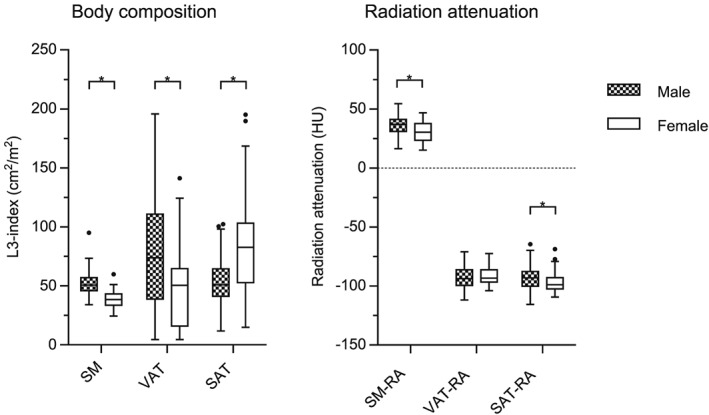
Gender‐specific CT body composition. Boxes represent median and inter‐quartile range. Whiskers are set at either the 25th or 75th percentiles + 1.5 times the inter‐quartile range (Tukey method). Dots represent outliers. *Significant P‐value < 0.05. CT, computed tomography; RA, radiation attenuation; SAT, subcutaneous adipose tissue; SM, skeletal muscle; VAT, visceral adipose tissue.
Table 2.
Gender‐specific cardiopulmonary exercise testing results according to skeletal muscle radiation attenuation
| Male | Female | |||||||
|---|---|---|---|---|---|---|---|---|
| Overall | Low SM‐RA | High SM‐RA | P‐value | Overall | Low SM‐RA | High SM‐RA | P‐value | |
| O2 at AT (L·min−1) | 0.87 ± 0.28 | 0.82 ± 0.22 | 0.90 ± 0.34 | 0.261 | 0.70 ± 0.19 | 0.70 ± 0.21 | 0.70 ± 0.18 | 0.970 |
| O2 at AT (mL·kg−1·min−1) | 10.3 ± 3.1 | 9.4 ± 2.2 | 11.1 ± 3.6 | 0.019* | 10.0 ± 2.5 | 9.2 ± 2.0 | 10.6 ± 2.9 | 0.100 |
| O2/Heart Rate at AT (mL per beat) | 8.6 ± 2.2 | 8.7 ± 2.1 | 8.5 ± 2.4 | 0.782 | 6.8 ± 1.7 | 6.9 ± 1.9 | 6.7 ± 1.7 | 0.618 |
| E/ CO2 at AT | 37.2 ± 6.1 | 39.0 ± 6.1 | 35.6 ± 5.7 | 0.018* | 37.2 ± 6.9 | 39.5 ± 8.1 | 35.2 ± 5.6 | 0.067 |
| Work rate at AT (W) | 62.9 ± 27.9 | 56.1 ± 22.3 | 68.5 ± 31.1 | 0.060 | 45.4 ± 23.7 | 38.5 ± 23.4 | 54.0 ± 21.3 | 0.030* |
| O2 peak (L·min−1) | 1.41 ± 0.50 | 1.29 ± 0.34 | 1.50 ± 0.60 | 0.074 | 1.05 ± 0.28 | 1.01 ± 0.32 | 1.09 ± 0.26 | 0.359 |
| O2 peak (mL·kg−1·min−1) | 16.9 ± 5.4 | 14.8 ± 3.6 | 18.9 ± 6.3 | 0.002* | 15.0 ± 3.6 | 13.5 ± 2.5 | 16.4 ± 4.1 | 0.008* |
| O2/Heart Rate at peak (mL per beat) | 10.7 ± 2.6 | 10.6 ± 2.6 | 10.8 ± 2.8 | 0.780 | 8.1 ± 2.2 | 8.4 ± 2.7 | 7.9 ± 1.7 | 0.458 |
| Work rate at peak (W) | 126.1 ± 48.7 | 113.5 ± 36.3 | 135.9 ± 56.4 | 0.052 | 89.4 ± 35.3 | 75.9 ± 32.6 | 102.4 ± 35.7 | 0.016* |
| E/ CO2 at peak | 36.1 ± 5.6 | 37.6 ± 5.6 | 34.6 ± 5.4 | 0.025* | 36.1 ± 6.5 | 38.1 ± 7.4 | 34.7 ± 5.6 | 0.104 |
| O2/work rate slope (mL·min−1·W−1) | 9.4 ± 1.4 | 9.2 ± 1.5 | 9.6 ± 1.4 | 0.206 | 9.3 ± 1.6 | 9.5 ± 1.6 | 9.3 ± 1.7 | 0.812 |
| E/ CO2 slope | 32.0 ± 5.6 | 33.7 ± 5.8 | 30.4 ± 5.1 | 0.014* | 32.2 ± 6.8 | 35.1 ± 7.3 | 29.4 ± 4.7 | 0.005* |
Cut‐offs for low and high groups were set at the gender‐specific median for SM‐RA.
SM‐RA, skeletal muscle radiation attenuation; O2 at AT, oxygen uptake at anaerobic threshold; O2 peak, oxygen uptake at peak exercise; O2/Heart R at AT/peak, oxygen pulse at the anaerobic threshold/peak exercise; E/ CO2 at AT/peak, ventilatory equivalent for carbon dioxide at the anaerobic threshold/peak exercise; O2/work rate slope, oxygen uptake over work rate slope; E/ CO2 slope, ventilation over ventilatory equivalent for carbon dioxide.
Significant P‐value < 0.05.
Relationship between computed tomography body composition and cardiopulmonary exercise testing variables
Univariate and multivariate linear regression results are shown in Table 3. Of the CT body composition parameters, SM‐RA had the strongest association with both weight‐adjusted O2 at AT and O2 peak in the univariate analysis (R 2 = 0.20 and 0.33, respectively; correlations, r = 0.45 and 0.57, respectively, P < 0.001; Figure 2). Skeletal muscle mass only showed a weak association with O2 peak (R 2 = 0.06; correlation, r = 0.24, P = 0.010). Other significant variables in the univariate analysis were age, BMI, ASA > 2, VAT, and SAT. However, in the multivariate analysis, only SM‐RA and age were added to the model because adding additional variables did not result in a significant F change (P > 0.05). In the multivariate analysis, SM‐RA was significantly associated with both weight‐adjusted O2 at AT (B = 0.12, 95% CI 0.06–0.18, P < 0.001, R 2 = 0.26) and O2 peak (B = 0.25, 95% CI 0.15–0.34, P < 0.001, R 2 = 0.42); see Table 3. Other body composition variables such as sarcopenia were excluded from the model after the addition of age.
Table 3.
Univariate and multivariate linear regression analysis for O2 at anaerobic threshold (mL·kg−1·min−1) and O2 peak (mL·kg−1·min−1)
| O2 at AT (mL·kg−1·min−1) | O2 peak (mL·kg−1·min−1) | |||||||||||
|---|---|---|---|---|---|---|---|---|---|---|---|---|
| Univariate | Multivariate | Univariate | Multivariate | |||||||||
| B | 95% CI | P‐value | B | 95% CI | P‐value | B | 95% CI | P‐value | B | 95% CI | P‐value | |
| Age | −0.10 | −0.14 to −0.58 | <0.001* | −0.07 | −0.11 to −0.02 | 0.004 | −0.22 | −0.28 to −0.15 | <0.001* | −0.14 | −0.21 to −0.07 | <0.001* |
| Male | 0.33 | −0.77 to 1.43 | 0.549 | — | — | — | 1.95 | 0.16 to 3.73 | 0.033* | — | — | — |
| BMI | −0.10 | −0.20 to −0.01 | 0.041* | — | — | — | −0.14 | −0.30 to 0.03 | 0.115 | — | — | — |
| ASA > 2 | −1.17 | −2.26 to −0.77 | 0.036* | — | — | — | −2.96 | −4.74 to −1.19 | 0.001* | — | — | — |
| Pancreas | 0.41 | −0.64 to 1.46 | 0.442 | — | — | — | 0.14 | −1.62 to 1.90 | 0.876 | — | — | — |
| Malignant | 0.49 | −0.97 to 1.96 | 0.506 | — | — | — | 0.56 | −1.83 to 2.94 | 0.645 | — | — | — |
| mGPS | — | — | — | — | — | — | ||||||
| 0 (ref) | — | — | — | — | — | — | — | — | — | — | — | — |
| 1 | −0.64 | −2.22 to 0.95 | 0.428 | — | — | — | −1.45 | −4.14 to 1.25 | 0.289 | — | — | — |
| 2 | −1.38 | −2.80 to 0.04 | 0.056 | — | — | — | −1.55 | −3.92 to 0.82 | 0.197 | — | — | — |
| SM | 0.03 | −0.02 to 0.08 | 0.252 | — | — | — | 0.11 | 0.03 to 0.19 | 0.010* | — | — | — |
| VAT | −0.02 | −0.04 to 0.01 | <0.001* | — | — | — | −0.04 | −0.06 to −0.02 | 0.001* | — | — | — |
| SAT | −0.03 | −0.04 to −0.01 | 0.001* | — | — | — | −0.05 | −0.07 to −0.02 | <0.001* | — | — | — |
| SM‐RA | 0.16 | 0.10 to 0.22 | <0.001* | 0.12 | 0.06 to 0.18 | <0.001* | 0.33 | 0.24 to 0.42 | <0.001* | 0.25 | 0.15 to 0.34 | <0.001* |
| VAT‐RA | 0.06 | −0.00 to 0.12 | 0.057 | — | — | — | 0.09 | −0.01 to 0.20 | 0.071 | — | — | — |
| SAT‐RA | 0.02 | −0.04 to 0.08 | 0.507 | — | — | — | 0.03 | −0.06 to 0.13 | 0.496 | — | — | — |
Variables were added to multivariate analysis starting with the lowest P‐value in univariate analysis. Variables were only added to multivariate analysis if they significantly improved the model fit (F change: P < 0.05). For the multivariate models, R 2 = 0.20 [ O2 at AT (mL·kg−1·min−1)] and R 2 = 0.42 [ O2 peak (mL·kg−1·min−1)].
ASA, American Society of Anesthesiologists; BMI, body mass index; mGPS, modified Glasgow prognostic score; RA, radiation attenuation; SAT, subcutaneous adipose tissue; SM, skeletal muscle; VAT, visceral adipose tissue; WBC, white blood cell count.
Significant P‐value < 0.05.
Figure 2.
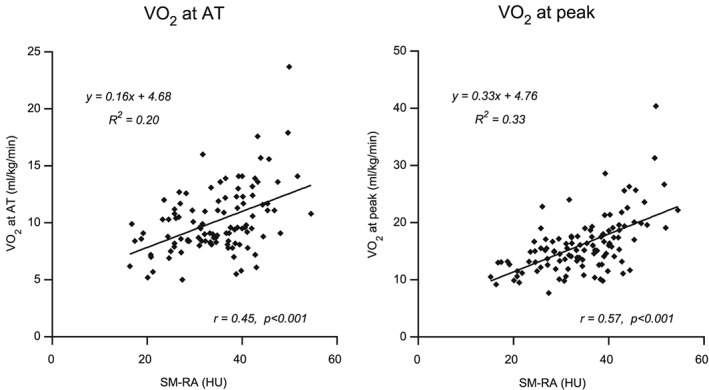
Correlations and regression plots of skeletal muscle radiation attenuation with O2 at AT (mL·kg−1·min−1) and O2 peak (mL·kg−1·min−1). Five patients did not reach their anaerobic threshold, and these patients were excluded from this analyses. HU, Hounsfield unit; SM‐RA, skeletal muscle radiation attenuation.
Overall survival, mortality, and length of hospital stay
Low‐weight‐adjusted O2 peak was associated with increased 1 year mortality (21% vs. 8%, P = 0.045) and increased length of hospital stay (13.9 ± 11.0 vs. 10.6 ± 9.3 days, P = 0.048) in the univariate analysis (Table 1). One patient (<1%) died within 30 days, and three patients (2%) within 90 days (all with low SM‐RA). However, in the multivariate analysis, there was only a trend (odds ratio 2.99, 95% CI 0.92–9.74, p=0.070). In the multivariate Cox regression analysis, there was also a trend for low‐weight‐adjusted O2 peak and overall survival [hazard ratio (HR) 2.10, 95% CI 0.98–4.51, P = 0.056]. As there was an association between O2 peak and SM‐RA, we wanted to test whether a combination of low physical performance and myosteatosis would be a better predictor of overall survival and mortality. We therefore identified three patient phenotypes based on O2 peak and SM‐RA: (i) high O2 peak, (ii) low O2 peak only, and (iii) low O2 peak and myosteatosis (low SM‐RA). Indeed, patients with both low O2 peak and myosteatosis had significantly lower survival in the multivariate Cox regression analysis (HR 2.42, 95% CI 1.04–5.63, P = 0.040); see Table 4. There was no significant association with 1 year mortality. The only other variable associated with lower survival was an elevated mGPS (≥1) (HR 2.37, 95% CI 1.14–4.93, P = 0.021).
Table 4.
Univariate and multivariate Cox regression and logistic regression analysis for overall survival and 1 year mortality
| Overall survival | 1 year mortality | |||||||||||
|---|---|---|---|---|---|---|---|---|---|---|---|---|
| Univariate | Multivariate | Univariate | Multivariate | |||||||||
| HR | 95% CI | P‐value | HR | 95% CI | P‐value | OR | 95% CI | P‐value | OR | 95% CI | P‐value | |
| Age | 1.02 | 0.98–1.05 | 0.341 | 1.01 | 0.97–1.06 | 0.673 | ||||||
| Male | 0.66 | 0.30–1.45 | 0.303 | 0.81 | 0.28–2.34 | 0.700 | ||||||
| BMI | 1.02 | 0.95–1.09 | 0.618 | 1.04 | 0.94–1.15 | 0.462 | ||||||
| ASA > 2 | 1.64 | 0.79–3.37 | 0.182 | 3.59 | 1.27–10.1 | 0.016* | 3.08 | 0.99–9.54 | 0.051 | |||
| Pancreas | 1.62 | 0.78–3.37 | 0.201 | 2.28 | 0.92–8.27 | 0.071 | 3.29 | 0.97–11.2 | 0.057 | |||
| Malignant | 3.53 | 0.84–14.9 | 0.085 | 3.32 | 0.79–14.0 | 0.103 | — | — | —† | |||
| mGPS ≥ 1 | 2.39 | 1.17–4.88 | 0.017* | 2.37 | 1.14–4.93 | 0.021* | 2.41 | 0.87–6.70 | 0.090 | 1.84 | 0.58–5.84 | 0.304 |
| Low SM | 1.34 | 0.64–2.82 | 0.435 | 0.75 | 0.27–2.07 | 0.580 | ||||||
| Low SM‐RA | 1.60 | 0.76–3.40 | 0.219 | 1.67 | 0.60–4.69 | 0.327 | ||||||
| Low O2 at AT | 1.31 | 0.64–2.70 | 0.465 | 1.66 | 0.60–4.62 | 0.329 | ||||||
| Low O2 peak | 2.04 | 0.95–4.36 | 0.066 | 2.10 | 0.98–4.51 | 0.056 | 2.97 | 0.99–8.93 | 0.052 | 2.99 | 0.92–9.74 | 0.070 |
| Patient phenotype | ||||||||||||
| High O2 peak (reference) | — | — | — | — | — | — | — | — | — | — | — | — |
| Low O2 peak only | 1.80 | 0.64–5.07 | 0.265 | 2.01 | 0.71–5.68 | 0.187 | 2.50 | 0.60–10.5 | 0.209 | 2.65 | 0.51–13.7 | 0.246 |
| Low O2 peak and myosteatosis | 2.31 | 0.99–5.35 | 0.050* | 2.42 | 1.04–5.63 | 0.040* | 3.10 | 0.95–10.2 | 0.061 | 3.21 | 0.90–11.5 | 0.073 |
Variables with P < 0.1 in univariate analysis were added to the multivariate analysis. Multivariate analysis for patient phenotypes was performed separately without including low SM, low SM‐RA, low O2 at AT, and low O2 peak variables.
ASA, American Society of Anesthesiologists; AT, anaerobic threshold; BMI, body mass index; mGPS, modified Glasgow prognostic score; RA, radiation attenuation; SM, skeletal muscle.
Significant P‐value <0.05.
Could not be included as the benign patients had 0% 1 year mortality.
Discussion
In this study, myosteatosis (low SM‐RA) was associated with reduced fitness ( O2 at AT, O2 peak, and E/ CO2 slope) in both men and women, while sarcopenia (low skeletal muscle mass) was not. SM‐RA was associated with both weight‐adjusted O2 at AT and O2 peak in the multivariate analysis. Furthermore, combining low O2 peak with myosteatosis (low SM‐RA) was found to be a better predictor of overall survival than was low O2 peak or low SM‐RA alone. Additionally, an elevated mGPS was associated with lower overall survival. This novel finding demonstrates that CT‐derived SM‐RA data are associated not only with SM structure but also with SM functioning.
Sarcopenia in a cancer population is multifactorial, and while tumour burden may be one of the contributing factors, poor physical fitness is a major factor. In addition, several studies in HPB populations demonstrated that particularly myosteatosis is associated with poor overall survival and increased surgical complications.24, 38, 39 In the present study, the relationship between similar body composition and survival was not observed, as the present cohort was too heterogeneous for survival analysis. The approach of using a heterogeneous cohort provided a pragmatic snapshot capture of the HPB patient population that lends itself easily to external validation in other patient cohorts. In a series of 1473 consecutive patients with lung and abdominal cancer, the presence of low SM‐RA was a significant negative predictor. These data were corroborated in a study by Rollins et al.,40 where the prevalence of myosteatosis in patients with unresectable pancreaticobiliary cancers was found to be 55.3%. Furthermore, myosteatosis but not sarcopenia was significantly associated with a reduction in overall survival and systemic inflammation. In the present study, we were able to link myosteatosis with a high BMI and low fitness, but we only found a weak correlation between myosteatosis and both C‐reactive protein and albumin levels.
Although the relationship between myosteatosis, sarcopenia, and poor fitness was assumed, no study had ever set out to test this hypothesis. Interestingly, we observed that sarcopenia was only significantly associated with weight‐adjusted O2 peak in the univariate analysis but was excluded from the multivariate model after addition of age, suggesting that the association was age related rather than disease related. In addition, while sarcopenia can be a result of muscle loss that occurred over time, a single time point assessment of a patient's muscle mass was previously shown not to be associated with actual muscle loss over time.30 Indeed, skeletal muscle mass at a single time point is also affected by age, sex, race, build, and disease and hence might not fully correspond with muscle strength/function.41 Myosteatosis, on the other hand, was associated with reduced fitness ( O2 at AT, O2 peak, and E/ CO2 slope) in both multivariate analyses. Myosteatosis is generally regarded as the result of a pathologic process involving systemic inflammation and insulin resistance in disease states such as cancer cachexia or obesity.23 SM insulin resistance, redox dysfunction, and oxidative stress are associated with decreased glucose uptake and mitochondrial dysfunction, possibly leading to decreased muscle function and fitness.42, 43, 44
Lack of physical activity and fitness is a major modifiable risk factor of ill health45 and premature death. There is a large epidemiological body of evidence supporting the notion that physical fitness has benefits in almost every context of health and disease, advocating better outcomes for fitter people.46 Furthermore, physical inactivity is one of the leading public health issues we face,47, 48 and its association with cancer risk is quite clear.49 The biological bases underlying the associations between physical activity, fitness, and cancer risk are incompletely defined.50 The reliability and predictive value of perioperative objectively measured physical fitness using CPET in cancer patients are well established,1, 51, 52 with emerging evidence in pancreatic and hepatobiliary cohorts.15, 18, 19, 53 In this study, we found that O2 peak was the strongest predictor of adverse outcome (1 year mortality and length of hospital stay). Combining CPET with CT data could provide a better prediction of clinical outcome compared with either of them alone, as we found that patients with both low O2 peak and myosteatosis had significantly lower overall survival while low O2 peak only was not significantly associated with overall survival. Evidence has shown that a higher physical activity and fitness after a cancer diagnosis and its treatments reduce perioperative risk and improve quality of life and post‐operative outcomes including survival.11, 13, 14, 50, 54, 55
Such data raise the obvious hypothesis: Can health outcomes be improved by perioperative interventions targeted at improving body composition and physical fitness? Body composition and fitness modulation as a concept in surgical risk prediction is attractive due its potential reversibility. In elective surgical patients, there is a small window of opportunity from contemplation of surgery and tumour staging to the date of surgery. Tailored programmes during this period should be multi‐faceted and targeted at individual patients' needs. A combination of strategies targeting poor muscle function, reduced physical fitness, secondary anorexia, inflammation, psychological health, and poor nutrition has been suggested in the context of multimodal prehabilitation prior to cancer and major intra‐abdominal surgery.56, 57, 58, 59, 60, 61 A large body of evidence exists utilizing exercise to reverse loss of muscle mass and strength with ageing.62 In addition, physical exercise improves muscular strength and ameliorates systemic inflammation in cancer patients.63 Evidence relating to improving fitness with exercise in the perioperative period is also gaining momentum. While reduced length of stay, post‐operative morbidity, and critical care dependency have been observed in cardiothoracic64 patients undergoing prehabilitation programmes, there are limited data examining its subsequent impact on post‐operative outcomes following abdominal surgery.59, 65, 66 Moreover, understanding the underlying molecular mechanisms of muscle loss and interrogating distinct muscle phenotypes67 and their relationship to cancer surgery morbidity and survival are urgently needed. This is key to inform the development of interventions and treatment strategies to mitigate against poor outcomes.35
In conclusion, we found that myosteatosis and not sarcopenia (assessed by CT scan) was associated with physical fitness (assessed with CPET) in a surgical HPB population. These data suggest that a simple and fast analysis of myosteatosis on a single‐slice CT image provides information (albeit limited) on the patients' physical fitness. CT body composition combined with objectively measured fitness (CPET) might provide additive risk stratification benefits and guide personalized multimodal interventions during the perioperative period.
Conflict of interest
Malcolm A. West was supported by a National Institute for Health Research Academic Clinical Lecturer Award (CL‐2016‐26‐002) and declares that he has no conflict of interest. David P. J. van Dijk was supported by the Netherlands Organisation for Scientific Research (NWO Grant 022.003.011) and declares that he has no conflict of interest. Fredrick Gleadowe declares that he has no conflict of interest. Thomas Reeves declares that he has no conflict of interest. John Primrose declares that he has no conflict of interest. Mohammed Abu Hilal declares that he has no conflict of interest. Mark R. Edwards declares that he has no conflict of interest. Sandy Jack declares that she has no conflict of interest. Sander S. S. Rensen declares that he has no conflict of interest. Michael P. W. Grocott declares that he has no conflict of interest. Denny Z. H. Levett declares that she has no conflict of interest. Steven W. M. Olde Damink declares that he has no conflict of interest.
Acknowledgements
This work was undertaken while M.A.W. and M.P.W.G. were funded by the National Institute for Health Research and the Royal College Of Anaesthetists British Oxygen Company Fellowship awarded by the National Institute for Academic Anaesthesia for the Fit‐4‐Surgery programme of research. Funders and study sponsors had no role in the study design; in the collection, analysis, and interpretation of data; in the writing of the manuscript; and in the decision to submit the manuscript for publication. The authors certify that they comply with the ethical guidelines for authorship and publishing of the Journal of Cachexia, Sarcopenia and Muscle.68
West M. A., van Dijk D. P. J., Gleadowe F., Reeves T., Primrose J. N., Abu Hilal M., Edwards M. R., Jack S., Rensen S. S. S., Grocott M. P. W., Levett D. Z. H., and Olde Damink S. W. M. (2019) Myosteatosis is associated with poor physical fitness in patients undergoing hepatopancreatobiliary surgery, Journal of Cachexia, Sarcopenia and Muscle, 10, 860–871, doi: 10.1002/jcsm.12433.
References
- 1. Moran J, Wilson F, Guinan E, McCormick P, Hussey J, Moriarty J. Role of cardiopulmonary exercise testing as a risk‐assessment method in patients undergoing intra‐abdominal surgery: a systematic review. Br J Anaesth 2016;116:177–191. [DOI] [PubMed] [Google Scholar]
- 2. Malietzis G, Aziz O, Bagnall NM, Johns N, Fearon KC, Jenkins JT. The role of body composition evaluation by computerized tomography in determining colorectal cancer treatment outcomes: a systematic review. Eur J Surg Oncol 2015;41:186–196. [DOI] [PubMed] [Google Scholar]
- 3. Mei KL, Batsis JA, Mills JB, Holubar SD. Sarcopenia and sarcopenic obesity: do they predict inferior oncologic outcomes after gastrointestinal cancer surgery. Perioper Med 2016;5:30. [DOI] [PMC free article] [PubMed] [Google Scholar]
- 4. Ozola Zalite I, Zykus R, Francisco Gonzalez M, Saygili F, Pukitis A, Gaujoux S, et al. Influence of cachexia and sarcopenia on survival in pancreatic ductal adenocarcinoma: a systematic review. Pancreatology 2015;15:19–24. [DOI] [PubMed] [Google Scholar]
- 5. Jones K, Gordon‐Weeks A, Coleman C, Silva M. Radiologically determined sarcopenia predicts morbidity and mortality following abdominal surgery: a systematic review and meta‐analysis. World J Surg 2017;41:2266–2279. [DOI] [PMC free article] [PubMed] [Google Scholar]
- 6. Martin L, Birdsell L, MacDonald N, Reiman T, Clandinin MT, McCargar LJ, et al. Cancer cachexia in the age of obesity: skeletal muscle depletion is a powerful prognostic factor, independent of body mass index. J Clin Oncol 2013;31:1539–1547. [DOI] [PubMed] [Google Scholar]
- 7. Reeves T, Bates S, Sharp T, Richardson K, Bali S, Plumb J, et al. Cardiopulmonary exercise testing (CPET) in the United Kingdom—a national survey of the structure, conduct, interpretation and funding. Perioper Med 2018;7:2. [DOI] [PMC free article] [PubMed] [Google Scholar]
- 8. Levett DZH, Jack S, Swart M, Carlisle J, Wilson J, Snowden C, et al. Preoperative Cardiopulmonary Exercise Testing (PCPET): consensus clinical guidelines on indications, organisation, conduct and physiological interpretation. Br J Anaesth 2017;120:484–500. [DOI] [PubMed] [Google Scholar]
- 9. Levett DZH, Edwards M, Grocott M, Mythen M. Preparing the patient for surgery to improve outcomes. Best Pract Res Clin Anaesthesiol 2016;30:145–157. [DOI] [PubMed] [Google Scholar]
- 10. West MA, Lythgoe D, Barben CP, Noble L, Kemp GJ, Jack S, et al. Cardiopulmonary exercise variables are associated with postoperative morbidity after major colonic surgery: a prospective blinded observational study. Br J Anaesth 2014;112:665–671. [DOI] [PubMed] [Google Scholar]
- 11. West MA, Asher R, Browning M, Minto G, Swart M, Richardson K, et al. Validation of preoperative cardiopulmonary exercise testing‐derived variables to predict in‐hospital morbidity after major colorectal surgery. Br J Surg 2016;103:744–752. [DOI] [PubMed] [Google Scholar]
- 12. West MA, Parry MG, Lythgoe D, Barben CP, Kemp GJ, Grocott MPW, et al. Cardiopulmonary exercise testing for the prediction of morbidity risk after rectal cancer surgery. Br J Surg 2014;101:1166–1172. [DOI] [PubMed] [Google Scholar]
- 13. West MA, Loughney L, Barben CP, Sripadam R, Kemp GJ, Grocott MPW, et al. The effects of neoadjuvant chemoradiotherapy on physical fitness and morbidity in rectal cancer surgery patients. Eur J Surg Oncol 2014;40:1421–1428. [DOI] [PubMed] [Google Scholar]
- 14. Jack S, West MA, Raw D, Marwood S, Ambler G, Cope TM, et al. The effect of neoadjuvant chemotherapy on physical fitness and survival in patients undergoing oesophagogastric cancer surgery. Eur J Surg Oncol 2014;40:1313–1320. [DOI] [PubMed] [Google Scholar]
- 15. Ausania F, Snowden CP, Prentis JM, Holmes LR, Jaques BC, White SA, et al. Effects of low cardiopulmonary reserve on pancreatic leak following pancreaticoduodenectomy. Br J Surg 2012;99:1290–1294. [DOI] [PubMed] [Google Scholar]
- 16. Snowden CP, Prentis JM, Anderson HL, Roberts DR, Randles D, Renton M, et al. Submaximal cardiopulmonary exercise testing predicts complications and hospital length of stay in patients undergoing major elective surgery. Ann Surg 2010;251:535–541. [DOI] [PubMed] [Google Scholar]
- 17. Snowden CP, Prentis J, Jacques B, Anderson H, Manas D, Jones D, et al. Cardiorespiratory fitness predicts mortality and hospital length of stay after major elective surgery in older people. Ann Surg 2013;257:999–1004. [DOI] [PubMed] [Google Scholar]
- 18. Junejo MA, Mason JM, Sheen AJ, Moore J, Foster P, Atkinson D, et al. Cardiopulmonary exercise testing for preoperative risk assessment before hepatic resection. Br J Surg 2012;99:1097–1104. [DOI] [PubMed] [Google Scholar]
- 19. Junejo MA, Mason JM, Sheen AJ, Bryan A, Moore J, Foster P, et al. Cardiopulmonary exercise testing for preoperative risk assessment before pancreaticoduodenectomy for cancer. Ann Surg Oncol 2014;21:1929–1936. [DOI] [PubMed] [Google Scholar]
- 20. Mourtzakis M, Prado CMM, Lieffers JR, Reiman T, McCargar LJ, Baracos VE. A practical and precise approach to quantification of body composition in cancer patients using computed tomography images acquired during routine care. Appl Physiol Nutr Metab 2008;33:997–1006. [DOI] [PubMed] [Google Scholar]
- 21. Malietzis G, Johns N, Al‐Hassi HO, Knight SC, Kennedy RH, Fearon KCH, et al. Low muscularity and myosteatosis is related to the host systemic inflammatory response in patients undergoing surgery for colorectal cancer. Ann Surg 2016;263:320–325. [DOI] [PubMed] [Google Scholar]
- 22. Richards CH, Roxburgh CSD, MacMillan MT, Isswiasi S, Robertson EG, Guthrie GK, et al. The relationships between body composition and the systemic inflammatory response in patients with primary operable colorectal cancer. PLoS ONE 2012;7:e41883. [DOI] [PMC free article] [PubMed] [Google Scholar]
- 23. Aubrey J, Esfandiari N, Baracos VE, Buteau FA, Frenette J, Putman CT, et al. Measurement of skeletal muscle radiation attenuation and basis of its biological variation. Acta Physiol 2014;210:489–497. [DOI] [PMC free article] [PubMed] [Google Scholar]
- 24. van Dijk DPJ, Bakens MJAM, Coolsen MME, Rensen SS, van Dam RM, Bours MJL, et al. Low skeletal muscle radiation attenuation and visceral adiposity are associated with overall survival and surgical site infections in patients with pancreatic cancer. J Cachexia Sarcopenia Muscle 2017;8:317–326. [DOI] [PMC free article] [PubMed] [Google Scholar]
- 25. Reisinger KW, Van Vugt JLA, Tegels JJW, Snijders C, Hulsewé KWE, Hoofwijk AGM, et al. Functional compromise reflected by sarcopenia, frailty, and nutritional depletion predicts adverse postoperative outcome after colorectal cancer surgery. Ann Surg 2015;261:345–352. [DOI] [PubMed] [Google Scholar]
- 26. Miyamoto Y, Baba Y, Sakamoto Y, Ohuchi M, Tokunaga R, Kurashige J, et al. Sarcopenia is a negative prognostic factor after curative resection of colorectal cancer. Ann Surg Oncol 2015;22:2663–2668. [DOI] [PubMed] [Google Scholar]
- 27. Palmela C, Velho S, Agostinho L, Branco F, Santos M, Santos M, et al. Body composition as a prognostic factor of neoadjuvant chemotherapy toxicity and outcome in patients with locally advanced gastric cancer. J Gastric Cancer 2017;17:74–87. [DOI] [PMC free article] [PubMed] [Google Scholar]
- 28. Elliott JA, Doyle SL, Murphy CF, King S, Guinan EM, Beddy P, et al. Sarcopenia: prevalence, and impact on operative and oncologic outcomes in the multimodal management of locally advanced esophageal cancer. Ann Surg 2017;266:822–830. [DOI] [PubMed] [Google Scholar]
- 29. Yip C, Goh V, Davies A, Gossage J, Mitchell‐Hay R, Hynes O, et al. Assessment of sarcopenia and changes in body composition after neoadjuvant chemotherapy and associations with clinical outcomes in oesophageal cancer. Eur Radiol 2014;24:998–1005. [DOI] [PubMed] [Google Scholar]
- 30. Rutten IJG, van Dijk DPJ, Kruitwagen RFPM, Beets‐Tan RGH, Olde Damink SWM, van Gorp T. Loss of skeletal muscle during neoadjuvant chemotherapy is related to decreased survival in ovarian cancer patients. J Cachexia Sarcopenia Muscle 2016;7:458–466. [DOI] [PMC free article] [PubMed] [Google Scholar]
- 31. Blauwhoff‐Buskermolen S, Versteeg KS, De Van Der Schueren MAE, Den Braver NR, Berkhof J, Langius JAE, et al. Loss of muscle mass during chemotherapy is predictive for poor survival of patients with metastatic colorectal cancer. J Clin Oncol 2016;34:1339–1344. [DOI] [PubMed] [Google Scholar]
- 32. Peng PD, Van Vledder MG, Tsai S, De Jong MC, Makary M, Ng J, et al. Sarcopenia negatively impacts short‐term outcomes in patients undergoing hepatic resection for colorectal liver metastasis. Hpb 2011;13:439–446. [DOI] [PMC free article] [PubMed] [Google Scholar]
- 33. Van Vledder MG, Levolger S, Ayez N, Verhoef C, Tran TCK, Ijzermans JNM. Body composition and outcome in patients undergoing resection of colorectal liver metastases. Br J Surg 2012;99:550–557. [DOI] [PubMed] [Google Scholar]
- 34. Lodewick TM, Van Nijnatten TJA, Van Dam RM, Van Mierlo K, Dello SAWG, Neumann UP, et al. Are sarcopenia, obesity and sarcopenic obesity predictive of outcome in patients with colorectal liver metastases? Hpb 2015;17:438–446. [DOI] [PMC free article] [PubMed] [Google Scholar]
- 35. Gould DW, Lahart I, Carmichael AR, Koutedakis Y, Metsios GS. Cancer cachexia prevention via physical exercise: molecular mechanisms. J Cachexia Sarcopenia Muscle 2013;4:111–124. [DOI] [PMC free article] [PubMed] [Google Scholar]
- 36. Proctor MJ, Morrison DS, Talwar D, Balmer SM, O'Reilly DSJ, Foulis AK, et al. An inflammation‐based prognostic score (mGPS) predicts cancer survival independent of tumour site: a Glasgow Inflammation Outcome Study. Br J Cancer 2011;104:726–734. [DOI] [PMC free article] [PubMed] [Google Scholar]
- 37. Williams BA, Mandrekar JN, Mandrekar SJ, Cha SS, Furth AF. Finding optimal cutpoints for continuous covariates with binary and time‐to‐event outcomes. Mayo Clin Dep Heal Sci Res Tech Rep Ser 2006;79:1–26. [Google Scholar]
- 38. Okumura S, Kaido T, Hamaguchi Y, Fujimoto Y, Masui T, Mizumoto M, et al. Impact of preoperative quality as well as quantity of skeletal muscle on survival after resection of pancreatic cancer. Surgery 2015;157:1088–1098. [DOI] [PubMed] [Google Scholar]
- 39. Fujiwara N, Nakagawa H, Kudo Y, Tateishi R, Taguri M, Watadani T, et al. Sarcopenia, intramuscular fat deposition, and visceral adiposity independently predict the outcomes of hepatocellular carcinoma. J Hepatol 2015;63:131–140. [DOI] [PubMed] [Google Scholar]
- 40. Rollins KE, Tewari N, Ackner A, Awwad A, Madhusudan S, Macdonald IA, et al. The impact of sarcopenia and myosteatosis on outcomes of unresectable pancreatic cancer or distal cholangiocarcinoma. Clin Nutr 2016;35:1103–1109. [DOI] [PubMed] [Google Scholar]
- 41. Heymsfield SB, Gonzalez MC, Lu J, Jia G, Zheng J. Skeletal muscle mass and quality: evolution of modern measurement concepts in the context of sarcopenia. Proc Nutr Soc 2015;74:355–366. [DOI] [PubMed] [Google Scholar]
- 42. Simioni C, Zauli G, Martelli AM, Vitale M, Sacchetti G, Gonelli A, et al. Oxidative stress: role of physical exercise and antioxidant nutraceuticals in adulthood and aging. Oncotarget 2018;9:17181–17198. [DOI] [PMC free article] [PubMed] [Google Scholar]
- 43. Cortese‐Krott MM, Koning A, Kuhnle GGC, Nagy P, Bianco CL, Pasch A, et al. The reactive species interactome: evolutionary emergence, biological significance, and opportunities for redox metabolomics and personalized medicine. Antioxid Redox Signal 2017;27:684–712. [DOI] [PMC free article] [PubMed] [Google Scholar]
- 44. Dela F, Helge JW. Insulin resistance and mitochondrial function in skeletal muscle. Int J Biochem Cell Biol 2013;45:11–15. [DOI] [PubMed] [Google Scholar]
- 45. Robertson R, Boyce T, Dixon A. Commissioning and behaviour change: kicking bad habits final report. 2008. King's Fund. http://www.kingsfund.org.uk/publications/the_kings_fund_publications/kbh_final_report.htm. Accessed 15 Oct 2018.
- 46. Fiuza‐Luces C, Garatachea N, Berger NA, Lucia A. Exercise is the real polypill. Phys Ther 2013;28:330–358. [DOI] [PubMed] [Google Scholar]
- 47. Lee IM, Shiroma EJ, Lobelo F, Puska P, Blair SN, Katzmarzyk PT, et al. Effect of physical inactivity on major non‐communicable diseases worldwide: an analysis of burden of disease and life expectancy. Lancet 2012;380:219–229. [DOI] [PMC free article] [PubMed] [Google Scholar]
- 48. Kohl HW, Craig CL, Lambert EV, Inoue S, Alkandari JR, Leetongin G, et al. The pandemic of physical inactivity: global action for public health. Lancet 2012;380:294–305. [DOI] [PubMed] [Google Scholar]
- 49. Moore SC, Lee I‐M, Weiderpass E, Campbell PT, Sampson JN, Kitahara CM, et al. Association of leisure‐time physical activity with risk of 26 types of cancer in 1.44 million adults. JAMA Intern Med 2016;176:816–825. [DOI] [PMC free article] [PubMed] [Google Scholar]
- 50. Kerr J, Anderson C, Lippman SM. Physical activity, sedentary behaviour, diet, and cancer: an update and emerging new evidence. Lancet Oncol 2017;18:457–471. [DOI] [PMC free article] [PubMed] [Google Scholar]
- 51. Jones LW, Liang Y, Pituskin EN, Battaglini CL, Scott JM, Hornsby WE, et al. Effect of exercise training on peak oxygen consumption in patients with cancer: a meta‐analysis. Oncologist 2011;16:112–120. [DOI] [PMC free article] [PubMed] [Google Scholar]
- 52. Levett DZH, Grocott MPW. Cardiopulmonary exercise testing, prehabilitation, and enhanced recovery after surgery (ERAS). Can J Anesth 2015;62:131–142. [DOI] [PMC free article] [PubMed] [Google Scholar]
- 53. Dunne DFJ, Jones RP, Lythgoe DT, Pilkington FJ, Palmer DH, Malik HZ, et al. Cardiopulmonary exercise testing before liver surgery. J Surg Oncol 2014;110:439–444. [DOI] [PubMed] [Google Scholar]
- 54. Van Blarigan EL, Meyerhardt JA. Role of physical activity and diet after colorectal cancer diagnosis. J Clin Oncol 2015;33:1825–1834. [DOI] [PMC free article] [PubMed] [Google Scholar]
- 55. Burke S, Wurz A, Bradshaw A, Saunders S, West MA, Brunet J. Physical activity and quality of life in cancer survivors: a meta‐synthesis of qualitative research. Cancer 2017;9:1–29. [DOI] [PMC free article] [PubMed] [Google Scholar]
- 56. Fearon KC, Jenkins JT, Carli F, Lassen K. Patient optimization for gastrointestinal cancer surgery. Br J Surg 2013;100:15–27. [DOI] [PubMed] [Google Scholar]
- 57. Gillis C, Buhler K, Bresee L, Carli F, Gramlich L, Culos‐Reed N, et al. Effects of nutritional prehabilitation, with and without exercise, on outcomes of patients who undergo colorectal surgery: a systematic review and meta‐analysis. Gastroenterology 2018;155:391–410. [DOI] [PubMed] [Google Scholar]
- 58. Minnella EM, Bousquet‐Dion G, Awasthi R, Scheede‐Bergdahl C, Carli F. Multimodal prehabilitation improves functional capacity before and after colorectal surgery for cancer: a five‐year research experience. Acta Oncol 2017;56:295–300. [DOI] [PubMed] [Google Scholar]
- 59. van Rooijen SJ, Engelen MA, Scheede‐Bergdahl C, Carli F, Roumen RMH, Slooter GD, et al. Systematic review of exercise training in colorectal cancer patients during treatment. Scand J Med Sci Sports 2018;28:360–370. [DOI] [PubMed] [Google Scholar]
- 60. West MA, Wischmeyer PE, Grocott MPW. Prehabilitation and nutritional support to improve perioperative outcomes. Current Anesthesiology Reports 2017;7:340–349. [DOI] [PMC free article] [PubMed] [Google Scholar]
- 61. O'Doherty AF, West M, Jack S, Grocott MPW. Preoperative aerobic exercise training in elective intra‐cavity surgery: a systematic review. Br J Anaesth 2013;110:679–689. [DOI] [PubMed] [Google Scholar]
- 62. Rebelo‐Marques A, Lages ADS, Andrade R, Ribeiro CF, Mota‐Pinto A, Carrilho F, et al. Aging hallmarks: the benefits of physical exercise. Front Endocrinol 2018;9:258. [DOI] [PMC free article] [PubMed] [Google Scholar]
- 63. Maddocks M, Jones LW, Wilcock A. Immunological and hormonal effects of exercise: implications for cancer cachexia. Curr Opin Support Palliat Care 2013;7:376–382. [DOI] [PubMed] [Google Scholar]
- 64. Arthur H, Daniels C, McKelvie R, Hirsh J, Rush B. Effect of a preoperative intervention on preoperative and postoperative outcomes in low‐risk patients awaiting elective coronary artery bypass graft surgery. Ann Intern Med 2000;133:253–262. [DOI] [PubMed] [Google Scholar]
- 65. Barberan‐Garcia A, Ubré M, Roca J, Lacy AM, Burgos F, Risco R, et al. Personalised prehabilitation in high‐risk patients undergoing elective major abdominal surgery: a randomized blinded controlled trial. Ann Surg 2018;267:50–56. [DOI] [PubMed] [Google Scholar]
- 66. West MA, Loughney L, Lythgoe D, Barben CP, Sripadam R, Kemp GJ, et al. Effect of prehabilitation on objectively measured physical fitness after neoadjuvant treatment in preoperative rectal cancer patients: a blinded interventional pilot study. Br J Anaesth 2015;114:244–251. [DOI] [PubMed] [Google Scholar]
- 67. Stretch C, Aubin JM, Mickiewicz B, Leugner D, Al‐manasra T, Tobola E, et al. Sarcopenia and myosteatosis are accompanied by distinct biological profiles in patients with pancreatic and periampullary adenocarcinomas. PLoS ONE 2018;13:1–17. [DOI] [PMC free article] [PubMed] [Google Scholar]
- 68. von Haehling S, Morley JE, Coats AJS, Anker SD. Ethical guidelines for publishing in the Journal of Cachexia, Sarcopenia and Muscle: update 2017. J Cachexia Sarcopenia Muscle 2017;8:1081–1083. [DOI] [PMC free article] [PubMed] [Google Scholar]