

Abstract
INTRODUCTION:
Motivational drives are internal states that can explain why animals adaptively display distinct behaviors in response to the same external stimulus. Physiological needs (e.g., for food and water) are thought to produce specific drives that engage particular goal-directed behaviors to promote survival. These drives are established through the activity of populations of hypothalamic neurons that sense physiological variables and relay this information to other parts of the brain. However, it is unclear how the activity of these hypothalamic neurons activates and coordinates other brain systems involved in sensation, decision-making, and action in order to produce the appropriate goal-directed behavior. The cellular dynamics of brainwide states underlying basic survival drives have heretofore remained inaccessible.
RATIONALE:
Understanding the neural basis of motivated behavior would require measuring activity within distributed neural circuits in the brain and studying how this activity is regulated by the animal’s motivational state. Recent advances in extracellular electrophysiological recording technology have enabled large-scalemeasurements of neuronal activity throughout the brains of behaving animals. This technologycould lead to a spatiotemporal map of activity flow across the brain as an animal senses and responds to stimuli under different conditions. By examining the animal in different motivational states, we could determine how these states are represented in diverse brain regions and how these states influence neuronal activity across the brain to alter behavior.
RESULTS:
We recorded the activity of ~24,000 neurons throughout 34 brain regions during thirst-motivated choice behavior; these recordings were performed across 87 sessions from 21 mice as they gradually consumed water and became sated. We found that more than half of recorded neurons were modulated by this task, with a rapid and widespread response to a water-predicting olfactory cue preceding sustained activity related to water acquisition. The animal’s satiety state gated this wave of activity: In satiated mice, the same sensory cue produced only a transient change in activity and no behavioral response. Surprisingly, the spontaneous baseline activity of neurons across many brain regions was also modulated by the animal’s satiety state.
We found diverse correlates of the task at the single-neuron level, with many neurons’ activity correlating with specific sensory cues or behavior, and some of them highly modulated by satiety state. Neurons from each of these groups were distributed throughout the brain, with each brain area differing in the relative proportions of different types of neurons. We separated the high-dimensional population activity dynamics into lower-dimensional state-, cue-, and behavior-related modes. Whereas the cue-and behavior-related modes were primarily modulated by the task in a satiety state–dependent manner, activity along the state mode was persistent throughout the trial, including the period before odor onset. Thus, there existed a brainwide representation of satiety state that appeared to gate the flow of activity in response to sensory inputs.
Finally, as a causal test of the role of this widespread encoding of satiety state, we optogenetically stimulated hypothalamic thirst neurons and caused mice to perform more trials after reaching satiety. We found that this focal stimulation returned the behavior, brainwide single-neuron within-trial dynamics, and brainwide single-neuron correlates of satiety state back to the state corresponding to thirst. Stimulation also specifically modulated activity along the satiety-related mode in a subset of brain areas.
CONCLUSION:
Our experiments revealed a global representation of the thirst motivational state throughout the brain, which appears to gate the brainwide propagation of sensory information and its subsequent transformation into behavioral output.
Physiological needs produce motivational drives, such as thirst and hunger, that regulate behaviors essential to survival. Hypothalamic neurons sense these needs and must coordinate relevant brainwide neuronal activity to produce the appropriate behavior. We studied dynamics from ~24,000 neurons in 34 brain regions during thirst-motivated choice behavior in 21 mice as they consumed water and became sated. Water-predicting sensory cues elicited activity that rapidly spread throughout the brain of thirsty animals. These dynamics were gated by a brainwide mode of population activity that encoded motivational state. After satiation, focal optogenetic activation of hypothalamic thirst-sensing neurons returned global activity to the pre-satiation state. Thus, motivational states specify initial conditions that determine how a brainwide dynamical system transforms sensory input into behavioral output.
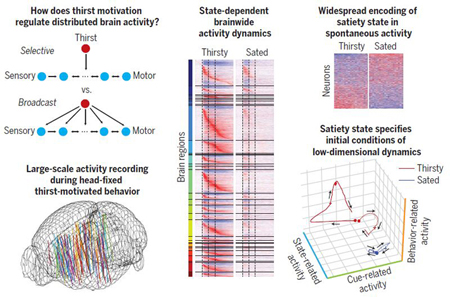
Graphical Abstract
Brainwide dynamics of thirst motivational drive. Top left: Potential models for widespread or selective regulation of neural dynamics by thirst. Bottom left: Tracks of Neuropixels electrodes used to record activity from different brain regions during thirst-motivated behavior. Center: Brainwide activity dynamics of individual neurons in response to a sensory cue while a mouse was thirsty and sated. Top right: Neural activity correlated with satiety state. Bottom right: Low-dimensional dynamics of task-related activity.
Motivational drives are internal states that can explain why animals adaptively change their behavior in response to the same external stimuli (1–4). Physiological needs (e.g., for food and water) are thought to produce specific drives that engage particular goal-directed behaviors to maintain homeostasis (1, 4, 5). These drives are established through the activity of populations of hypothalamic neurons that sense physiological variables (6,7) and relay this information to other parts of the brain.
The nature of these internal states has been debated for many decades (1). A prevalent model is that motivational states regulate behavior by amplifying, in a state-dependent manner, the salience of specific sensory signals that predict reward (4). Neural recordings in hungry animals found “gating” of responses to food-predicting stimuli, such that responses to these stimuli were greatly diminished when animals were sated versus hungry. This modulation was found in a variety of brain regions, including the hypothalamus (8–14). However, the mechanisms regulating this sensory modulation remain unclear, as does the neural representation of the motivational drive itself. Studies suggest the presence of persistent neural encoding of the food satiety state in spontaneous activity (i.e., in the absence of sensory stimuli) in several brain regions (15,16), but the broader importance of these findings remains to be explored.
We investigated these questions in the context of thirst, a motivational drive that is essential for survival, is modulated on a rapid time scale, and is implemented by well-characterized neural circuitry. Osmolarity- and angiotensinsensitive neurons in the subfornical organ (SFO) and vascular organ of the lamina terminalis project to the median preoptic nucleus (MnPO), which integrates these physiological signals and relays that information to multiple downstream nuclei (17) (Fig. 1A). Activity in this circuit is aver-sive (18–20); water consumption reduces SFO and MnPO activity (19, 20) via activation of local MnPO interneurons (21), implementing a mechanism akin to the classical “drive reduction” model for regulation of water-seeking behavior (1).
Fig. 1. Brainwide neuronal recording during thirst-motivated behavior.
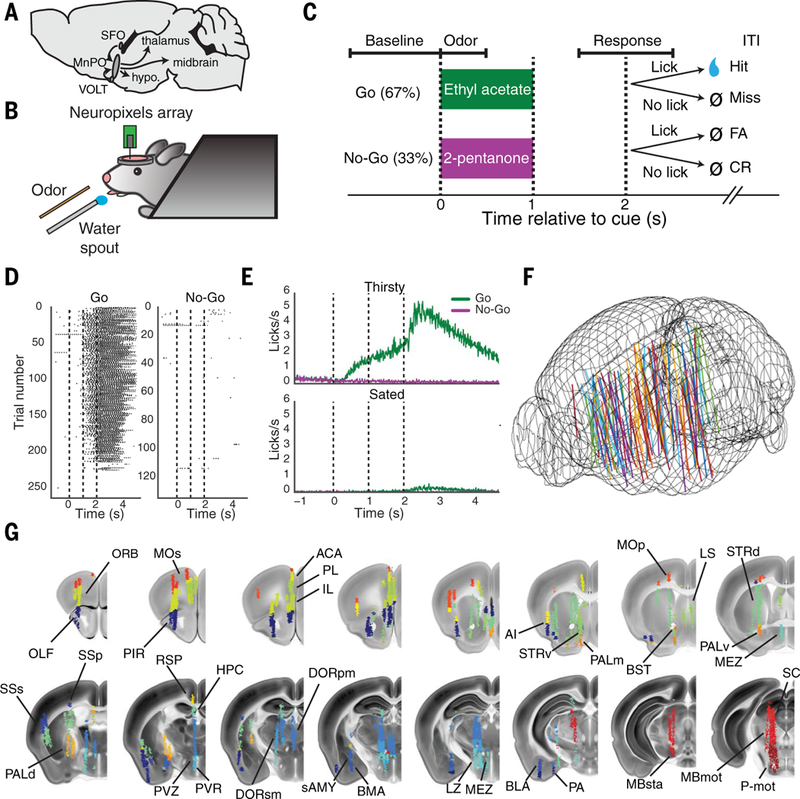
(A) Diagram of the output of the hypothalamic thirst circuit to other brain regions. SFO, subfornical organ; VOLT, vascular organ of the lamina terminalis; MnPO, median preoptic nucleus; hypo., hypothalamus. (B) Schematic drawing of the experimental setup. (C) Diagram of olfactory Go/No-Go task structure and different task epochs: baseline epoch (−1.1 to 0 s before odor period), odor epoch (0 to 0.5 s after odor onset), and response epoch (1.5 to 2.5 s after odor onset). FA, false alarm; CR, correct rejection; ITI, intertrial interval. (D) Example behavioral data from a single behavioral session, showing individual licks on Go and No-Go trials over the course of the session. (E) Average licking behavior on Go and No-Go trials while thirsty and sated (mean ± SEM, N = 87 sessions). (F) Electrode tracks from all 87 recording sessions, co-registered into the Allen common reference space. Mouse brain is outlined in wire mesh. (G) Locations of all recorded neurons in Allen Brain Atlas space, colored by brain region. See table S1 for brain region abbreviations (from Allen Brain Atlas ontology) used here and in subsequent figures.
However, it has remained unclear how thirst motivation is represented in circuits downstream of these dedicated thirst neurons, and how this state regulates activity relating to sensation and action to implement goal-directed behavior. One impediment to research in this area is the broad anatomical distribution of downstream targets of thirst neurons; another is that goal-directed behavior is thought to involve the coordinated activity of multiple interconnected circuits distributed throughout the brain (6). Together these considerations necessitate an approach to recording neural activity with single-cell resolution on a brainwide scale.
Large-scale activity recording during head-fixed behavior
We used a head-fixed thirst-motivated olfactory Go/No-Go decision-making task (22,23) to study how thirst motivation regulates sensory processing and behavior in mice (Fig. 1, B and C). This task consisted of a Go cue (67% of trials), after which mice could instrumentally lick to trigger delivery of a water reward, and a neutral No-Go cue (33% of trials) that yielded no reward upon licking. Water-restricted mice performed hundreds of trials per session (226 ± 7 trials, mean ± SEM), licking specifically on the Go cue with a near 100% hit rate, until they eventually became sated and stopped responding to the cue (Fig. 1, D and E, and fig. S1). At this point, we additionally recorded several dozen trials (78 ± 4 trials, mean ± SEM) while the mouse was receiving the same sensory cues but not responding behaviorally (Fig. 1, D and E, and fig. S1).
While mice performed this task, we used high-density Neuropixels microelectrode arrays (24) to acutely record single units from many brain regions (listed in table S1) distributed across the mouse forebrain and midbrain (Fig. 1, B and F). To ensure that single units were stably spike-sorted throughout the session, we used a recently developed spike-sorting framework with explicit drift tracking and correction (25). We targeted these recordings to include several thalamic and hypothalamic nuclei directly downstream of the MnPO [e.g., polymodal association thalamus (DORpm) and lateral hypothalamus (LZ)], diverse second-order regions [e.g., prelimbic cortex (PL), insular cortex (INS)] that were anatomically connected by axonal projection pathways to these directly downstream regions, and multiple regions involved in olfactory sensation [e.g., piriform cortex (PIR)] and the control of licking [e.g., secondary motor cortex (MOs)]. We developed a method to fluorescently label the electrode track and reconstruct its three-dimensional location within a common atlas space at the end of each experiment (Fig. 1G, fig. S2, and supplementary materials). We recorded a total of 23,881 single units (255 ± 26 units simultaneously, mean ± SEM; fig. S3, A and B) from 34 brain regions; these recordings were performed across 87 sessions from 21 mice (fig. S3, C and D). A single probe was used within each recording session; each region was recorded at most in one session per mouse to allow for unambiguous identification of tracks to sessions, and up to eight electrode penetrations were made in the same mouse across multiple days to record different regions.
Brainwide correlates of task and state during thirst-motivated behavior
There were extremely widespread changes in firing rates during task performance. The Go cue produced a wave of activity in thirsty animals that began in olfactory regions within ~150 ms of odor onset and rapidly (within ~300 ms) spread to neurons in every region we recorded from (Fig. 2A; fig. S4, A and B; and movie S1). Both the initial onset and the brainwide propagation of this activity wave substantially preceded the onset of licking (first licks were measured at 0.86 ± 0.04 s after odor onset, mean ± SEM across sessions). A large fraction of these units in every brain region (54% of total; 12,986) were modulated by the task (Fig. 2B). For many regions, the change in firing rate (relative to baseline) peaked within 500ms of cue onset; however, a subset of regions developed and maintained persistent activity that peaked instead just after the time of the reward (2 s after odor onset; Fig. 2C). The latter included many known sites implicated in motor output, such as primary motor cortex (MOp), MOs, and somatosensory thalamus (DORsm). Many of these neurons exhibited increases in activity upon licking onset (fig. S4C) as well as further increases upon reward delivery (fig. S4D), which was behaviorally associated with increased intensity of licking (Fig. 1E). The distributions of both baseline firing rates and Go odor-evoked changes in firing rates exhibited substantial variability across brain regions (fig. S4, E and F). The No-Go cue produced a similarly rapid response to cue onset within many regions that also responded rapidly to the Go cue, but then failed to produce persistent changes in activity past this initial transient period, corresponding with the lack of behavioral engagement relative to Go trials (Fig. 2, A and C; fig. S4, A and B; and movie S1). When mice were sated, there was still a diminished transient response to the Go and No-Go cues in many regions, but the stimuli failed to produce persistent activity past the sensory cue period (Fig. 2, A and C, and movie S1). Satiety state–dependent gating or modulation of those sensory cue–evoked responses appeared to be similarly widespread (compare Go thirsty and sated conditions in Fig. 2, A and C), although widespread but transient odor responses were observed even in the sated state.
Fig. 2. Widespread task- and state-related activity dynamics.
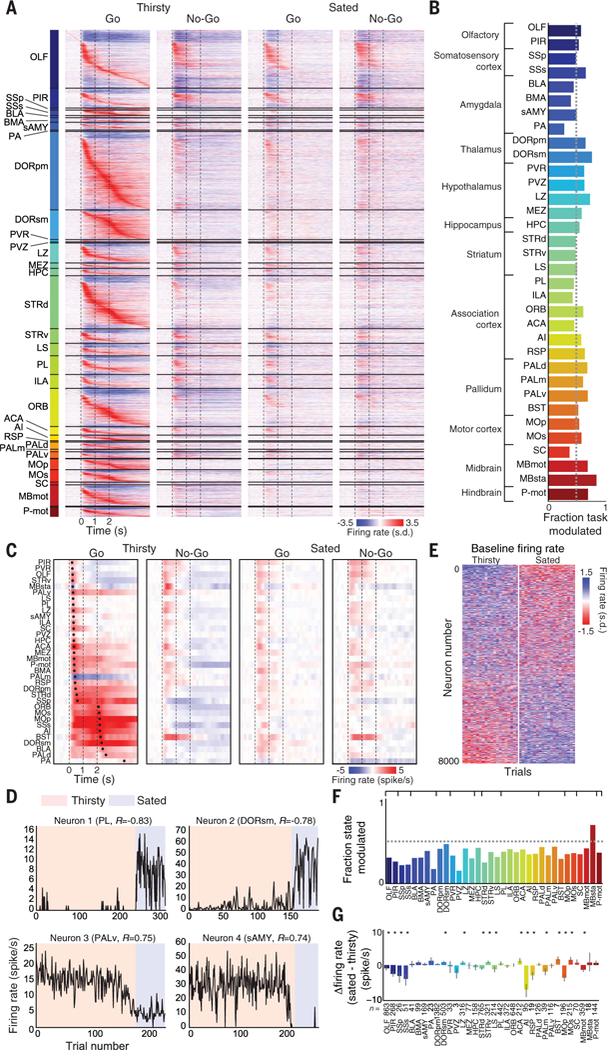
(A) Baseline subtracted, Z-scored trial-averaged firing rates for all task-modulated recorded neurons (N = 12,986 of 23,881) from 21 mice, averaged from all thirsty Go and No-Go trials. Neurons are sorted first by brain region, and then by time to peak within Go trial; s.d., standard deviation. (B) Fraction of task-modulated neurons per brain region. (C) Per-region population firing rate during thirsty and sated Go and No-Go trials. Regions are sorted by average time to peak change in population firing rate during the thirsty Go condition, relative to baseline, across all neurons from all mice. Dots indicate times of maximal change in firing rate for each region in each trial type. (D) Example state-modulated neurons (baseline firing rate significantly correlated with state) showing baseline firing rate over trials across session, with brain region and correlation with state (R value) indicated. (E) All state-modulated neurons, Z-scored and sorted by correlation with state, showing the last 20 consecutive trials of thirsty and sated blocks (N = 8395). (F) Fraction of state- modulated neurons per brain region. (G) Average change in baseline firing rate per brain region between thirsty and sated conditions. *P < 0.05 (Wilcoxon signed-rank test, Bonferroni correction). Data are means ± 95% confidence interval.
We also observed large and widespread modulations in the spontaneous firing of neurons as a function of the animal’s satiety state in the pre-stimulus baseline period. Many neurons exhibited rapid changes in their spontaneous activity over the course of a few trials as the animal transitioned from being thirsty to being sated that remained persistent for many minutes (Fig. 2D). To characterize this modulation, we found neurons throughout the brain with activity during the baseline period that was significantly correlated with the animal’s satiety state over the course of a session (P < 0.01, absolute R value compared with shuffled data, Bonferroni correction) (Fig. 2E). These neurons constituted a large fraction of neurons in each brain region (N = 8395,35% of total; Fig. 2F). Although roughly as many neurons increased or decreased baseline firing rate going from thirsty to sated (3811 versus 4584), there was a significant net change in firing rate in a variety of brain regions (Fig. 2G).
Single-cell correlates of different task variables
How are these state-dependent dynamics implemented across the brain at the level of single neurons? The activity patterns of many task-modulated neurons were highly correlated with the state, cue, or behavior aspects of the task (Fig. 3A). Unsupervised clustering of the average activity of task-modulated neurons (N = 12,986) across the thirsty and sated Go and No-Go trials revealed clusters of neurons with activity that qualitatively appeared to correlate with each of these state, cue, and behavior variables (Fig. 3B), as well as discrete subclusters within each group. The state-related clusters (N = 3484 units, 27% of total) exhibited only slight modulation upon cue presentation but were active throughout the trial selectively on either thirsty or sated trials (Fig. 3B, blue clusters). The cue-related clusters (N = 5007 units, 38% of total) were more varied but were primarily activated or suppressed during the odor period (Fig. 3B, green clusters); certain cue clusters were also state-modulated in a manner superimposed on the odor modulation. The behavior-related clusters (N = 4495 units, 35% of total) were active only during thirsty Go trials when the mice licked for water; they were selective for a particular period during the task before, during, or after reward consumption (Fig. 3B, red clusters) and exhibited activity that extended beyond the odor period. Neurons from nearly every cluster were represented in every brain region, with differing relative proportions of neurons from each cluster among all task-modulated neurons in different regions (Fig. 3C).
Fig. 3. Representations of sensory processing, behavioral output, and internal state at the single-neuron level across the brain.
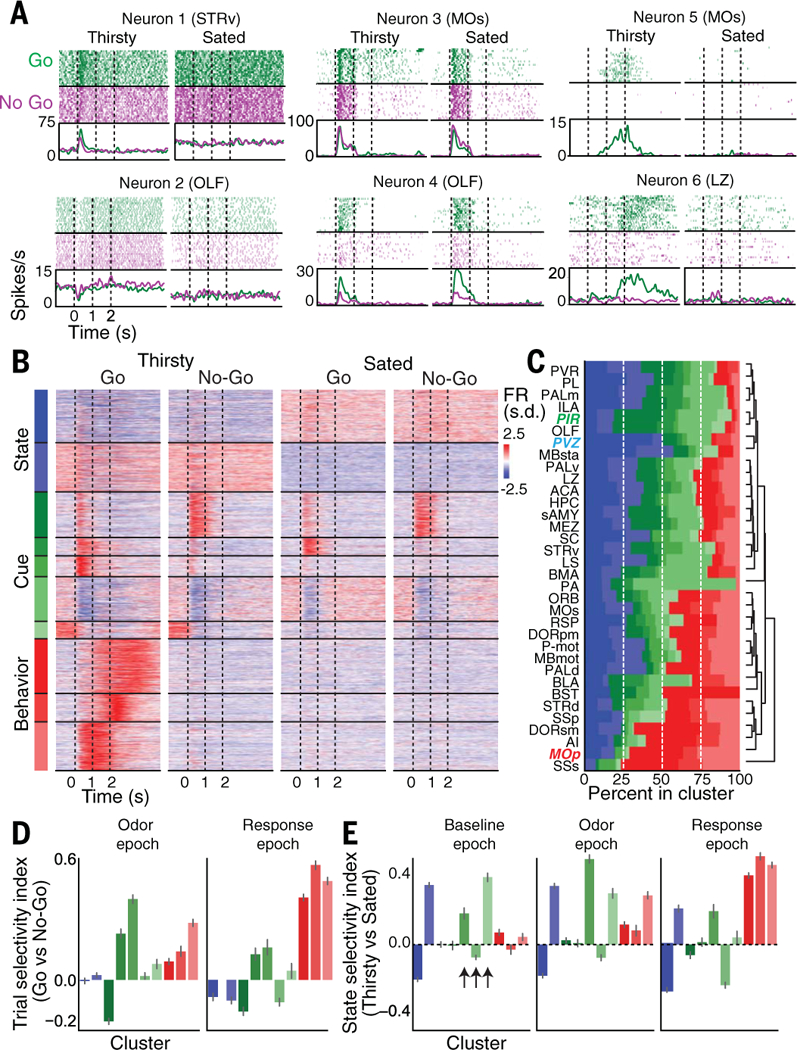
(A) Example neurons correlated with different aspects of the task or state. Top: Spike raster during Go/No-Go trials while thirsty and sated within a single session. Bottom: Average firing rate during same trials. Neurons 1 and 2 are primarily state-related, neurons 3 and 4 are primarily cuerelated, and neurons 5 and 6 are primarily behavior- related. Brain region is indicated in parentheses for each neuron. (B) Unsupervised clustering of all 12,986 task-modulated neurons. Behavior-related clusters are red; cue-related clusters are green; state-related clusters are blue. Individual neurons are trial-averaged per condition and Z-scored across conditions. FR, firing rate. (C) Hierarchically clustered cluster composition by brain region, showing fraction of total task-modulated neurons within each region that comes from all clusters. Regions in colored italics: PVZ (periventricular zone of the hypothalamus) contains mostly state-related neurons, PIR mostly cue-related neurons, and MOp mostly behavior-related neurons. (D) Trial selectivity index per cluster during odor epoch (0 to 0.5 s after odor onset) and response epoch (1.5 to 2.5 s after odor onset). Trial selectivity index is computed as (〈Go〉 – 〈No-Go〉)/(〈Go〉 + 〈No-Go〉) during a particular task epoch, where Go is the average on thirsty Go trials and 〈No-Go〉 is the average on thirsty No-Go trials. (E) State selectivity index per cluster during different task epochs. Trial selectivity index is computed as (〈Thirsty〉 – 〈Sated〉)/ (〈Thirsty〉 + 〈Sated〉) during a particular task epoch, where 〈Thirsty〉 is the average on thirsty Go trials and 〈Sated〉 is the average on sated Go trials. Data in (D) and (E) are means ± 95% confidence interval. Arrows indicate sensory clusters with large changes in firing rate during the task as a function of state.
Across both the odor and response epochs, many more clusters were selective for Go than for No-Go trials (Fig. 3, B and D), and several clusters exhibited selective activation on thirsty versus sated trials (Fig. 3, B and E). The Go cue rapidly produced increased firing in neurons throughout the brain in thirsty mice, and the same Go cue in the sated state or the No-Go cue failed to produce this large-scale activation. Satiety state–dependent modulation prior to the onset of behavior is therefore not manifested as a broad change in responsiveness across all cue-responsive neurons, but in fact it specifically modulates the activity of certain subclasses of those neurons (Fig. 3E, arrows).
We modeled neuronal activity using a set of state-, cue-, and behavior-related regressors to determine the extent to which single-neuron activity correlated with specific task elements on a trial-by-trial basis (fig. S5, A to C). Task-modulated neurons exhibited substantially better fits to the model than nonmodulated neurons (mean 0.17 ratio of deviance explained for task-modulated versus 0.06 for non–task-modulated, P < 0.001, Wilcoxon rank-sum test; fig. S5D), and these features modeled neurons in different clusters to different extents (fig. S5E). The state, cue, and behavior regressors tended to explain the most deviance in clusters that qualitatively appeared to encode those features (fig. S5, F and I). Different brain regions had different fractions of neurons that encoded state-, cue-, or behavior-related features (or combinations thereof) (fig. S5G), but the majority of neurons in most regions were selective for only one feature (fig. S5, H and I).
Decomposing brainwide population dynamics
How is this single-neuron activity coordinated within neural populations to implement specific computations related to sensory processing, behavioral output, and internal state? The hetero geneous activity patterns of neurons within each brain region suggested that we should examine population dynamics–based encoding of internal state and behavior (26–28). Population single-unit recording has shown that the trajectories in population activity space, of dimension equal to the number of recorded neurons, often exist on low-dimensional manifolds within this high-dimensional space (29–32). These results suggest that the diversity of activity patterns across many neurons often reflects a common, lower-dimensional dynamical variable (33).
How do these dynamical variables encode the state-, cue-, and behavior-related aspects of the task? We took advantage of the fact that these aspects are temporally separated within different epochs of single trials. We defined a “State mode” of activity that maximally separated thirsty and sated states during the baseline epoch, a “Cue mode” that maximally separated activity on Go and No-Go trials during the odor epoch (up to 500 ms after odor onset, before the mouse began licking), and similarly a “Behavior mode” that separated activity on Go and No-Go trials from the response epoch (1 s around time of the reward onset) (Fig. 4A) (34). The Cue mode was designed to capture activity related to the sensory response but could also include signals related to reward anticipation, decision-making, and motor preparation. The Behavior mode captured activity potentially related to motor output, sensorimotor feedback, and reward anticipation and consumption. We made use of this temporal separation to define orthogonal modes of population activity that encoded each task element (Fig. 4A), which together captured ~50% of the trial-averaged task-related variance throughout the brain. Prior to orthogonalization, the angles between the State axis and the Cue and Behavior axes were 82° and 84°, respectively, and 65° between the Cue and Behavior axes. The vector defining the State mode was stable over the course of the trial, whereas the vectors defining Cue and Behavior modes were most stable within the epoch from which they were defined (fig. S6A).
Fig. 4. Thirst motivational state regulation of brainwide neural population dynamics.
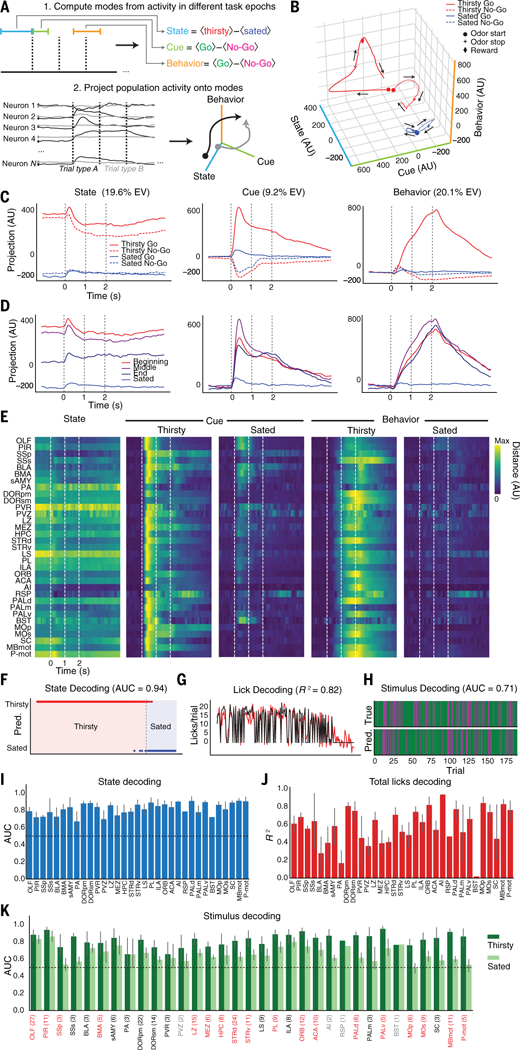
(A) Top: Schematic of how state-, cue-, and behavior-related modes are defined from population activity in different task epochs. Cue and Behavior modes are only computed from thirsty trials. Bottom: Schematic of how neural population activity is projected into a three-dimensional space. (B) Brainwide neural population activity projected onto activity modes (State, Cue, and Behavior) defined by trial-averaged activity during Go and No-Go trials while thirsty and sated. (C) Same as (B), but showing activity along each mode individually. EV, total explained variance. (D) Brainwide population dynamics on Go trials projected onto State, Cue, and Behavior modes over course of session (beginning, middle, end of thirsty block and sated). (E) Per-region average projections of simultaneously recorded population activity onto task axes. State: average absolute difference between thirsty and sated trials projected onto State mode. Thirsty/sated Cue: average absolute difference between Go and No-Go trials projected onto Cue mode. Thirsty/sated Behavior: average absolute difference between Go and No-Go trials projected onto Behavior mode. Each trace is normalized to the maximum across all conditions. (F) Example decoding of state from baseline epoch activity (1 s before odor) of simultaneously recorded neurons in OLF. Prediction on held-out data is shown in dots; observed state values are shown in shaded background. AUC, area under curve. (G) Example decoding of total number of licks from response epoch activity (1 s around potential reward time), from same population as (F). Black, observed; red, predicted. (H) Example decoding of trial type from odor epoch activity (first 500 ms of odor response) over session, from same population as (F). Green, Go trial; magenta, No-Go trial. (I) Per-region average decoding from baseline epoch. (J) Perregion lick decoding over whole session from response epoch. (K) Per-region decoding of stimulus from odor epoch, in thirsty and sated states. Regions labeled in red have a statistically significant decrease in decoding (P < 0.05, two-tailed t test, FDR correction across all regions with three or more recordings). Regions labeled in gray have fewer than three recordings. Numbers of recordings per region for (I) to (K) are indicated in parentheses in (K). Decoder was trained only on thirsty trials. For (I) and (K), chance performance (0.5) is indicated by dashed line. Data in (I) to (K) are means ± 95% confidence interval.
We then projected brainwide trial-averaged neural activity onto these axes to visualize how the State, Cue, and Behavior variables evolved over time across different trial conditions (Fig. 4, B and C). The dynamics for each mode computed from all neurons across all animals were very similar to those computed using subsampled populations of 20 neurons per region (fig. S6B) and to those computed for each animal individually (fig. S7). Finally, the rare thirsty Go trials where the animal did not obtain a reward had Cue and State dynamics that were similar to those of other thirsty Go trials but displayed reduced activity along the Behavior mode; likewise, thirsty No-Go trials where the animal incorrectly licked during the response period had Cue and State dynamics that were similar to those of other thirsty No-Go trials but displayed additional activity along the Behavior mode (fig. S6C).
These three activity modes displayed distinct dynamics and sensitivities to satiety state. The State mode was persistently elevated throughout both Go and No-Go trials when the animal was thirsty and displayed only slight modulation by task engagement (Fig. 4C, left). By contrast, the Cue mode strongly discriminated between Go and No-Go trials and displayed a large reduction in activity on Go trials upon satiety (Fig. 4C, center). Finally, the Behavior mode was only substantially activated on thirsty Go trials (Fig. 4C, right).
Activity along these modes changed over the course of a session in different ways. Mice performed the task consistently through the beginning and middle of each session but then began to reduce their per-trial licking and to increase their latency to lick as they approached satiety (fig. S1, C and D). Similarly, activity along the projection onto the State axis in Go trials was highest at the beginning of the session and slightly lower in the middle (Fig. 4D). Toward the end of the session, the activity dropped halfway to the sated state and then dropped further still upon reaching satiety (Fig. 4D), mirroring the changes in behavior. By contrast, Go trial projections onto the Cue and Behavior axes had similar activity as long as the mouse was licking for water but had very little activity when the mouse was sated (Fig. 4D).
Regional encoding of task and state variables
How do populations of neurons in different brain regions encode these variables? We defined the same State, Cue, and Behavior axes using data only from simultaneously recorded neurons within a single brain region. Projections of single-trial population activity onto these axes, averaged across multiple sessions, revealed that these smaller populations of neurons in nearly every region maintained qualitatively similar, state-dependent encodings of the three variables (Fig. 4E). Activation along the Cue mode was only somewhat diminished with satiety in olfactory regions OLFC and PIR but was highly reduced in most other brain regions. Similar dynamics were found using projections onto axes computed from trial-averaged data of all neurons recorded in each brain region (fig. S8).
How well does simultaneously recorded population activity within the different epochs used to define these modes encode information on a trial-by-trial basis about the animal’s state, sensory input, and behavior? We applied a linear decoding approach to quantify the extent to which activity within each of the three task epochs (baseline, odor, and response) respectively encoded different task elements (satiety state, trial type, and per-trial licking) (Fig. 4, F to H). Satiety state and odor identity in thirsty mice could be decoded using activity only in the pre-odor baseline epoch or the first 500 ms of odor response (odor epoch), respectively, from populations of neurons throughout the brain (Fig. 4, I and K). In sated mice, the ability to decode odors dropped to near chance levels throughout much of the brain [18/29 regions with >3 recordings per region had significantly changed decoding accuracy; P < 0.05, two-tailed t test, false discovery rate (FDR) correction] (Fig. 4K). Decoding of per-trial total licking from the response epoch was much more variable, with larger differences in decoding accuracy between different regions (Fig. 4J); the same was true for instantaneous decoding of lick rate (fig. S9). Using subsampled populations of 20 neurons simultaneously recorded per recording yielded reduced, but still substantially above chance, decoding accuracies from populations throughout the brain (fig. S10).
Causal manipulation of thirst motivational state
Are changes along this State mode causally related to changes in behavior? To answer this question, we examined whether focal and targeted stimulation of hypothalamic thirst neurons would be sufficient in sated mice to push brainwide neural population activity back into its thirsty state and restore the subsequent task-related global neural dynamics. We expressed an excitatory channelrhodopsin (35) in SFO Nos1+ excitatory neurons (18,36,37)(N =7 mice) (Fig. 5A). After mice became sated in each session, we stimulated the SFO neurons in a pattern that causes water-seeking behavior in sated animals (18, 37). We then had the mice perform a block of several additional “Stim” trials, then turned the stimulation off for a block of “Washout” trials (Fig. 5B). Optogenetic stimulation restored the animals’ behavior to that during natural thirst. Ending the optogenetic stimulation behaviorally returned animals to their sated state (Fig. 5, C to F).
Fig. 5. Causal manipulation of hypothalamic thirst-sensitive neurons recovers brainwide thirst state and global task-related neuronal dynamics.
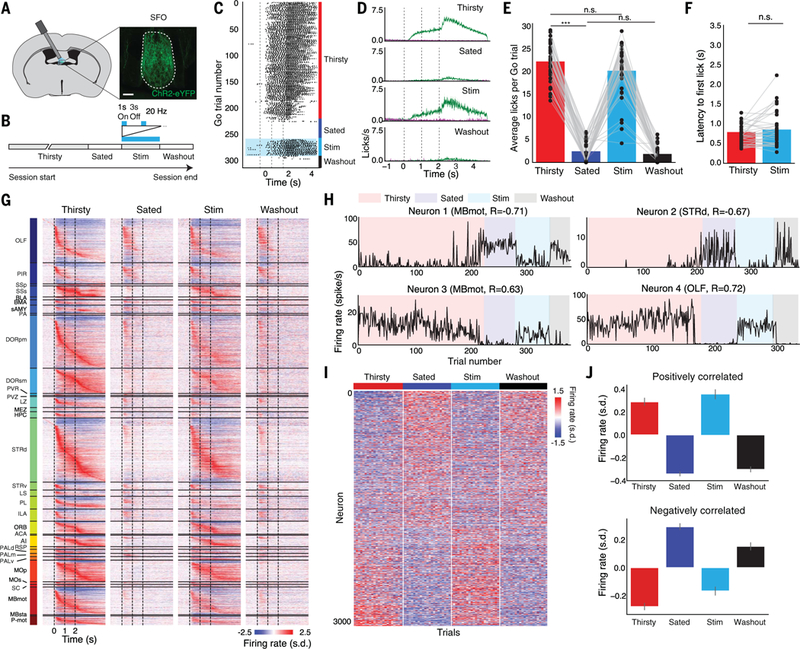
(A) Expression of ChR2-eYFP in Nos1+ SFO neurons. Scale bar, 100 μm. (B) Experimental timeline for optogenetic stimulation sessions. Mice first perform as in previous figures (“Thirsty” and “Sated”), then are optogenetically stimulated for a block of trials (“Stim”), then stimulation is turned off for a block of trials (“Washout”). (C) Example licking per trial for all Go trials within a session, with different trial blocks labeled. (D) Average licking within each trial block. Data are means ± SEM; N = 36 sessions. (E) Average number of licks per Go trial within each trial block. ***P < 0.001 (Wilcoxon signed-rank test, Bonferroni correction); n.s., not significant. The Hit rate was also not significantly different between Thirsty and Stim conditions (97 ± 1% versus 94 ± 2%, P = 0.67, Wilcoxon signed-rank test). (F) Average latency to first lick on Hit trials in Thirsty and Stim trial blocks (Wilcoxon signed-rank test). (G) Baseline-subtracted, Z-scored trial-averaged firing rates for all task-modulated neurons (N = 5323 of 10,288 total) from all 36 sessions, on Go trials in each trial block. Neurons are sorted by brain region, then by time to peak firing rate on thirsty Go trials. (H) Baseline firing rates across session of example state-modulated neurons in Thirsty, Sated, Stim, and Washout blocks. (I) Z-scored baseline firing rate of state-modulated neurons, sorted by each neuron’s correlation with satiety state. The last 20 trials from each block are shown. (J) Average Z-scored baseline firing rate from top 25% positively and negatively correlated state-modulated neurons. Data are means ± 95% confidence interval.
This local, targeted optogenetic stimulation in sated mice globally restored the within-trial activity patterns and brainwide timing interrelationships of task-modulated neurons to the natural dynamics of the thirsty state. Terminating optogenetic stimulation immediately returned neuronal responses to the sated-state dynamics (Fig. 5G).
We next examined the spontaneous activity during the baseline period of individual neurons that were correlated with the animal’s satiety state. The baseline firing rate of many individual neurons during stimulation returned to their activity level from when the animal was thirsty (Fig. 5, H to J). The majority of neurons that decreased their baseline firing rate as the animal transitioned from being thirsty to being sated subsequently increased their firing rate upon stimulation (1195 of 1781,67%), and vice versa for neurons that increased their firing rate upon the transition from thirsty to sated (1003 of 1417, 71%) (P < 0.05, χ2 test) (Fig. 5J). Thus, acute and targeted optogenetic stimulation not only restored within-trial dynamics related to sensory processing and behavior, it globally modulated the spontaneous firing of neurons throughout the brain to return these persistent representations of satiety state toward values corresponding to when the animal was thirsty.
Population response to optogenetic thirst induction
We then projected these brainwide dynamics onto State, Cue, and Behavior axes defined by activity in the natural thirsty and sated states. Optogenetic stimulation of the thirst-sensing neurons specifically shifted global activity along the naturally occurring State mode toward its position when the animal was thirsty, both for neurons pooled across mice (Fig. 6A) and for neurons from individual animals (fig. S11). After the conclusion of optogenetic stimulation, activity along this mode returned to its position prior to the onset of stimulation, when the mouse was sated (Fig. 6A). Projections of activity from the stimulation period onto the Cue and Behavior modes also faithfully recovered the naturally occurring within-trial dynamics from the thirsty state, with a slight baseline offset detectable only before task initiation (Fig. 6A). Comparing trial- averaged projections from stimulation trials with data from different points within the session revealed that this recovery along the State axis was, in fact, a return to the natural level of activity corresponding to near the end of the thirsty trials, immediately before the animal became fully sated (Fig. 6B). Single-trial projections from simultaneously recorded neurons revealed similar effects (Fig. 6C). This stimulation also rapidly and transiently modulated the firing rates of neurons in the expected downstream brain regions (fig. S12). Thus, focal and targeted optogenetic stimulation of the thirst pathway returned both the persistent cellular- and population-level encoding of the animal’s satiety state across the brain, and the subsequent task-related global dynamics within a trial, to that when the animal was naturally thirsty earlier in the session.
Fig. 6. Optogenetic thirst induction recovers population activity dynamics and decoding in specific regions.
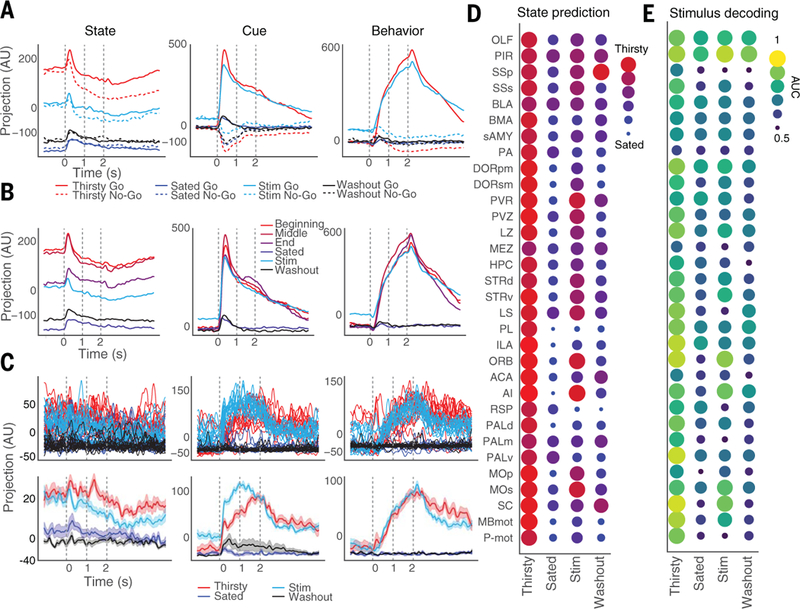
(A) Projections of average activity on Go and No-Go trials from each trial block onto State, Cue, and Behavior axes (defined using only Thirsty and Sated trials). (B) Projections of average activity on Go trials from trials at different points between Thirsty and Sated trials, and during Stim and Washout blocks, onto different axes. (C) Top: Projections of single trials of simultaneously recorded neurons from ORB onto State, Cue, and Behavior axes. Bottom: Averages of trials in top panels. Data are means ± SEM. (D) Per-region average predictions of satiety state (Thirsty versus Sated) in each trial block, using decoder trained on baseline epoch in Thirsty and Sated trials. (E) Per-region average decoding accuracy of trial type (Go versus No-Go) in each trial block, using decoder trained on odor epoch in Thirsty and Sated trials, using last 40 trials from each block. AUC, area under curve; 0.5 = chance performance. Predictions in Thirsty and Sated blocks in (D) and (E) are on held-out test data. Number of recordings per region: OLF, 12; PIR, 6; SSp, 1; SSs, 3; BLA, 2; BMA, 3; sAMY, 3; PA, 2; DORpm, 7; DORsm, 4; PVR, 1; PVZ, 1; LZ, 5; MEZ, 3; HPC, 4; STRd, 13; STRv, 3; LS, 2; PL, 2; ILA, 3; ORB, 2; ACA, 1; AI, 2; RSP, 1; PALd, 2; PALm, 2; PALv, 1; MOp, 6; MOs, 1; SC, 1; MBmot, 6; P-mot, 2.
The effect of thirst pathway stimulation on the State mode—matching the natural level of activity toward the end of the thirsty trials, before the animal became fully sated—suggested that either (i) a submaximal thirst state was being recapitulated throughout the brain, or (ii) the thirst state was being fully recapitulated only in a subset of regions. To discriminate these possibilities, we analyzed the predictions of decoders of satiety state and trial type, trained on thirsty and sated data from the activity during the baseline epoch and initial odor response epoch, respectively, of simultaneously recorded neurons in a single region. Decoders of satiety state using preodor activity predicted “thirsty” in held-out thirsty trials and “sated” in held-out sated trials (Fig. 6D). When decoders were tested on the same task epoch in stimulation trials (held out from the training data), many regions indeed decoded the state as thirsty (Fig. 6D); in particular, orbitofrontal cortex (ORB), agranular insular cortex (AI), and MOs all decoded the state as being very likely thirsty. Several of the highest-level cortical regions [corresponding to medial prefrontal (PL/ ILA) and retrosplenial (RSP) cortex] continued to decode that the animal was sated, consistent with expected access of these regions to contextual or working-memory cues on recent water consumption (38). These other regions may additionally receive visceral or other direct satiety cues, and thus the intensity of representation of the induced state in specific regions may be tuned by additional influences or information sources, which may be isolated, defined, and studied further in this way. These results suggest that recapitulation of the thirst state in a subset of regions is sufficient to restore thirst-motivated sensory processing and behavior, along with the associated brainwide activity dynamics. Upon ending stimulation, most regions again correctly predicted that the mouse was sated (Fig. 6D).
Many of the same regions (e.g., ORB, AI, MOs) that predicted that the animal was thirsty while being stimulated also immediately returned to accurately decoding odor identity during the first 500 ms after odor onset (Fig. 6E). Olfactory sensory regions (PIR and OLF), while changing in the expected direction in their state decoding, nonetheless continued to decode odor identity with high accuracy across all four trial blocks (Fig. 6E).
Discussion
Our results comport with the low dimensionality and pervasiveness of brainwide cellular activity during behavior in both Caenorhabditis elegans (39) and larval zebrafish (40). In mammals, the simplicity of the thirst-motivated olfactory Go/ No-Go task establishes a baseline of activity to which brainwide dynamics in other, more involved tasks can be compared. For example, dynamics at least as widespread were observed using large-scale recordings in a visual decisionmaking task involving competing sensory stimuli (41). Here, in experiments focused on a basic survival drive behavior, neurons throughout the brain responded within a few hundred milliseconds to the odor regardless of the animal’s satiety state or odor identity, and in a state- and odor-dependent manner rapidly came to a determination of whether to propagate the signal further to activate a behavioral response. Although this activity was extremely widespread, the functional relevance of these global activity patterns remains to be determined. As was shown in a previous study of large-scale activity during the same task in the mouse neocortex (23), it is likely that only a subset of brain regions are necessary for task performance, at least in the simplest task conditions. Together, these results illustrate that studies of how the brain produces behavior require an understanding of the global context in which neural computations are occurring.
Individual neurons fell into multiple clusters defined by activity dynamics, with each dynamically defined cluster distributed across the entire brain and exhibiting task-and state-related specific activity patterns that were highly similar across multiple regions. Each individual neuron primarily encoded one aspect of the task, and every brain region contained a diverse mixture of neurons encoding different aspects of the task. We further identified a brainwide mode of neural population activity that existed before odor onset, persisted throughout each trial, correlated with the behaviorally measured satiety state of the mouse, and appeared to determine the pattern of odor-evoked neural dynamics and behavior. Specific optogenetic stimulation of thirst-sensing neurons in sated mice was sufficient to recover activity along this thirsty state mode in a rapid and reversible manner and to restore the sub-sequent sensory- and behavior-related activity throughout the brain. Brain regions that did not fully represent the maximal level of thirst representation upon optogenetic stimulation could additionally be recipients of contextual or memory information on water consumption, visceral signals that normally cause animals to terminate drinking upon satiation [such as those relayed by oxytocin receptor–expressing neurons in the parabrachial nucleus (42)], or other slowly changing variables such as the passage of time (43).
The activity of glutamatergic hypothalamic thirst-related neurons establishes a persistent, aversive motivational drive that animals can reduce in real time by consuming water (19, 20). The brainwide activity mode we identify appears to represent the direct effects of this thirst neuron activity that is broadcast to downstream circuits. This broadcast may proceed through multiple levels of fast synaptic transmission and/or via neuromodulators, which feature prominently in the regulation of other brainwide arousal states (44). Through imposing this brain-wide state, thirst establishes persistent activity that exists prior to the animal sensing a water-predicting cue and can then modulate local circuitry in parallel throughout the brain to gate the subsequent transformation of sensory input into motor output in a state-dependent manner. Although initial sensory regions continue to respond to stimuli with high fidelity regardless of satiety state, the gating conferred by satiety greatly diminishes the propagation of sensory information beyond sensory regions, preventing the activation of motor circuits.
Neural population activity can be well described in terms of dynamics that evolve over time and are subject to internal dynamical rules, initial state settings, and external perturbations (28, 45). Our results suggest that the aversive thirst motivational state sets a landscape of “initial conditions,” spread across many brain regions, that determine subsequent sensory stimuli–evoked brainwide neural dynamics. When the brain is in the thirsty state, a transient perturbation (such as a sensory stimulus that predicts availability of water) elicits activity throughout the brain that follows internal dynamical rules to produce a trajectory leading to water-consummatory behavior. This reward consumption in turn moves the animal along an adaptive path toward a new initial position of less negative valence as the thirst drive is reduced. When the animal is sated, an “energetic barrier” throughout the brain prevents the same stimulus from pushing the dynamics down the same trajectory that leads to behavior. It remains to be seen whether other physiological survival-need states modulate different modes of activity, or whether the thirst-related mode we observe represents a more general form of arousal across multiple types of motivation. In either case, specifying initial conditions in this manner may be a general mechanism for defining and regulating motivated behavior.
Methods summary
Mice were implanted with a headbar, allowed to recover, and then water-restricted and trained on an olfactory Go/No-Go task. Recordings were performed using Neuropixels microelectrode arrays (24) inserted into one location per session. Multiple recordings were made from the same mice across multiple days, in different locations each day, to allow for unambiguous assignment of recording sessions to electrode tracks. During recordings, mice would perform several hundred trials until they became sated, followed by several dozen more trials while sated. Electrodes were coated with fixable DiI to allow for track reconstruction. In a subset of experiments, optogenetic stimulation was applied to Nos1+ neurons expressing ChR2 in the subfornical organ. Brains were cleared and imaged on a lightsheet microscope after killing, then registered to a common atlas. Putative neurons were identified using Kilosort2 (25). Neurons were assigned to brain area according to the location of their maximal channel on the electrode array, with location transformed into a common anatomical reference space. Firing rates were counted in 10-ms bins.
Supplementary Material
ACKNOWLEDGMENTS
We thank M. Lovett-Barron, C. Kim, T. Machado, D. O’Shea, I. Kauvar, and E. Richman for comments on the manuscript; N. Steinmetz (UCL/University of Washington) and J. Siegle (Allen Institute for Brain Science) for help with using Neuropixels; T. Harris (Janelia Research Campus) for providing Neuropixels; C. Ramakrishnan for assistance with viruses; and D. Sussillo, K. Shenoy, and W. Newsome for useful discussions.
Funding: Supported by a Fannie and John Hertz Foundation Fellowship (W.E.A.); NINDS (L.L.); the NSF NeuroNex program and HHMI (L.L. and K.D.); and NIMH, NIDA, the Defense Advanced Research Projects Agency Neuro-FAST program, the NOMIS Foundation, the Wiegers Family Fund, the Nancy and James Grosfeld Foundation, the H. L. Snyder Medical Foundation, the Samuel and Betsy Reeves Fund, the Gatsby Foundation, the AE Foundation, and the Fresenius Foundation (K.D.).
Footnotes
Competing interests: Authors declare no competing interests.
Data and materials availability: Data are available at http://clarityresourcecenter.org.
REFERENCES AND NOTES
- 1.Hull C, Principles of Behavior: An Introduction to Behavior Theory (Appleton-Century, 1943). [Google Scholar]
- 2.Bolles RC, Theory of Motivation (Harper & Row, 1967). [Google Scholar]
- 3.Toates F, Motivational Systems (Cambridge Univ. Press, 1986). [Google Scholar]
- 4.Berridge KC, Motivation concepts in behavioral neuroscience. Physiol. Behav. 81, 179–209 (2004). doi: 10.1016/j.physbeh.2004.02.004; pmid: [DOI] [PubMed] [Google Scholar]
- 5.Sternson SM, Eiselt A-K, Three Pillars for the Neural Control of Appetite. Annu. Rev. Physiol. 79, 401–423 (2017). doi: 10.1146/annurev-physiol-021115-104948; pmid: [DOI] [PubMed] [Google Scholar]
- 6.Swanson LW, Cerebral hemisphere regulation of motivated behavior. Brain Res. 886, 113–164 (2000). doi: 10.1016/S0006-8993(00)02905-X; pmid: [DOI] [PubMed] [Google Scholar]
- 7.Sternson SM, Hypothalamic survival circuits: Blueprints for purposive behaviors. Neuron 77, 810–824 (2013). doi: 10.1016/j.neuron.2013.02.018; pmid: [DOI] [PMC free article] [PubMed] [Google Scholar]
- 8.Fukuda M, Ono T, Nishino H, Nakamura K, Neuronal responses in monkey lateral hypothalamus during operant feeding behavior. Brain Res. Bull. 17, 879–883 (1986). doi: 10.1016/0361-9230(86)90102-4; pmid: [DOI] [PubMed] [Google Scholar]
- 9.Burton MJ, Rolls ET, Mora F, Effects of hunger on the responses of neurons in the lateral hypothalamus to the sight and taste of food. Exp. Neurol. 51, 668–677 (1976). doi: 10.1016/0014-4886(76)90189-8; pmid: [DOI] [PubMed] [Google Scholar]
- 10.O’Connor EC et al. , Accumbal D1R Neurons Projecting to Lateral Hypothalamus Authorize Feeding. Neuron 88, 553–564 (2015). doi: 10.1016/j.neuron.2015.09.038; pmid: [DOI] [PubMed] [Google Scholar]
- 11.Pager J, Ascending olfactory information and centrifugal influxes contributing to a nutritional modulation of the rat mitral cell responses. Brain Res. 140, 251–269 (1978). doi: 10.1016/0006-8993(78)90459-6; pmid: [DOI] [PubMed] [Google Scholar]
- 12.Critchley HD, Rolls ET, Hunger and satiety modify the responses of olfactory and visual neurons in the primate orbitofrontal cortex. J. Neurophysiol. 75, 1673–1686 (1996). doi: 10.1152/jn.1996.75.4.1673; pmid: [DOI] [PubMed] [Google Scholar]
- 13.Burgess CR et al. , Hunger-Dependent Enhancement of Food Cue Responses in Mouse Postrhinal Cortex and Lateral Amygdala. Neuron 91, 1154–1169 (2016). doi: 10.1016/j.neuron.2016.07.032; pmid: [DOI] [PMC free article] [PubMed] [Google Scholar]
- 14.Livneh Y et al. , Homeostatic circuits selectively gate food cue responses in insular cortex. Nature 546, 611–616 (2017). doi: 10.1038/nature22375; pmid: [DOI] [PMC free article] [PubMed] [Google Scholar]
- 15.Nakano Y et al. , Neuronal activity in the medial orbitofrontal cortex of the behaving monkey: Modulation by glucose and satiety. Brain Res. Bull. 12, 381–385 (1984). doi: 10.1016/0361-9230(84)90109-6; pmid: [DOI] [PubMed] [Google Scholar]
- 16.de Araujo IE et al. , Neural ensemble coding of satiety states. Neuron 51, 483–494 (2006). doi: 10.1016/j.neuron.2006.07.009; pmid: [DOI] [PubMed] [Google Scholar]
- 17.Gizowski C, Bourque CW, The neural basis of homeostatic and anticipatory thirst. Nat. Rev. Nephrol. 14, 11–25 (2018). doi: 10.1038/nrneph.2017.149; pmid: [DOI] [PubMed] [Google Scholar]
- 18.Betley JN et al. , Neurons for hunger and thirst transmit a negative-valence teaching signal. Nature 521, 180–185 (2015). doi: 10.1038/nature14416; pmid: [DOI] [PMC free article] [PubMed] [Google Scholar]
- 19.Allen WE et al. , Thirst-associated preoptic neurons encode an aversive motivational drive. Science 357, 1149–1155 (2017). doi: 10.1126/science.aan6747; pmid: [DOI] [PMC free article] [PubMed] [Google Scholar]
- 20.Leib DE et al. , The Forebrain Thirst Circuit Drives Drinking through Negative Reinforcement. Neuron 96, 1272–1281.e4 (2017). doi: 10.1016/j.neuron.2017.11.041; pmid: [DOI] [PMC free article] [PubMed] [Google Scholar]
- 21.Augustine V et al. , Hierarchical neural architecture underlying thirst regulation. Nature 555, 204–209 (2018). doi: 10.1038/nature25488; pmid: [DOI] [PMC free article] [PubMed] [Google Scholar]
- 22.Komiyama T et al. , Learning-related fine-scale specificity imaged in motor cortex circuits of behaving mice. Nature 464, 1182–1186 (2010). doi: 10.1038/nature08897; pmid: [DOI] [PubMed] [Google Scholar]
- 23.Allen WE et al. , Global Representations of Goal-Directed Behavior in Distinct Cell Types of Mouse Neocortex. Neuron 94, 891–907.e6 (2017). doi: 10.1016/j.neuron.2017.04.017; pmid: [DOI] [PMC free article] [PubMed] [Google Scholar]
- 24.Jun JJ et al. , Fully integrated silicon probes for high-density recording of neural activity. Nature 551, 232–236 (2017). doi: 10.1038/nature24636; pmid: [DOI] [PMC free article] [PubMed] [Google Scholar]
- 25.Stringer C et al. , Spontaneous behaviors drive multidimensional, brain-wide population activity. bioRxiv [preprint]. 22 April 2018.doi: 10.1038/nn1233; pmid: [DOI] [PubMed] [Google Scholar]
- 26.Buzsáki G, Large-scale recording of neuronal ensembles. Nat. Neurosci. 7, 446–451 (2004). doi: 10.1038/nn1233; pmid: [DOI] [PubMed] [Google Scholar]
- 27.Rabinovich M, Huerta R, Laurent G, Transient dynamics for neural processing. Science 321, 48–50 (2008). doi: 10.1126/science.1155564; pmid: [DOI] [PubMed] [Google Scholar]
- 28.Shenoy KV, Sahani M, Churchland MM, Cortical control of arm movements: A dynamical systems perspective. Annu. Rev. Neurosci. 36, 337–359 (2013). doi: 10.1146/annurev-neuro-062111-150509; pmid: [DOI] [PubMed] [Google Scholar]
- 29.Stopfer M, Jayaraman V, Laurent G, Intensity versus identity coding in an olfactory system. Neuron 39, 991–1004 (2003). doi: 10.1016/j.neuron.2003.08.011; pmid: [DOI] [PubMed] [Google Scholar]
- 30.Mazor O, Laurent G, Transient dynamics versus fixed points in odor representations by locust antennal lobe projection neurons. Neuron 48, 661–673 (2005). doi: 10.1016/j.neuron.2005.09.032; pmid: [DOI] [PubMed] [Google Scholar]
- 31.Churchland MM et al. , Neural population dynamics during reaching. Nature 487, 51–56 (2012). doi: 10.1038/nature11129; pmid: [DOI] [PMC free article] [PubMed] [Google Scholar]
- 32.Mante V, Sussillo D, Shenoy KV, Newsome WT, Context-dependent computation by recurrent dynamics in prefrontal cortex. Nature 503, 78–84 (2013). doi: 10.1038/nature12742; pmid: [DOI] [PMC free article] [PubMed] [Google Scholar]
- 33.Churchland MM, Yu BM, Sahani M, Shenoy KV, Techniques for extracting single-trial activity patterns from large-scale neural recordings. Curr. Opin. Neurobiol. 17, 609–618 (2007). doi: 10.1016/j.conb.2007.11.001; pmid: [DOI] [PMC free article] [PubMed] [Google Scholar]
- 34.Li N, Daie K, Svoboda K, Druckmann S, Robust neuronal dynamics in premotor cortex during motor planning. Nature 532, 459–464 (2016). doi: 10.1038/nature17643; pmid: [DOI] [PMC free article] [PubMed] [Google Scholar]
- 35.Boyden ES, Zhang F, Bamberg E, Nagel G, Deisseroth K, Millisecond-timescale, genetically targeted optical control of neural activity. Nat. Neurosci. 8, 1263–1268 (2005). doi: 10.1038/nn1525; pmid: [DOI] [PubMed] [Google Scholar]
- 36.Oka Y, Ye M, Zuker CS, Thirst driving and suppressing signals encoded by distinct neural populations in the brain. Nature 520, 349–352 (2015). doi: 10.1038/nature14108; pmid: [DOI] [PMC free article] [PubMed] [Google Scholar]
- 37.Zimmerman CA et al. , Thirst neurons anticipate the homeostatic consequences of eating and drinking. Nature 537, 680–684 (2016). pmid: [DOI] [PMC free article] [PubMed] [Google Scholar]
- 38.Pinto L, Dan Y, Cell-Type-Specific Activity in Prefrontal Cortex during Goal-Directed Behavior. Neuron 87, 437–450 (2015). doi: 10.1016/j.neuron.2015.06.021; pmid: [DOI] [PMC free article] [PubMed] [Google Scholar]
- 39.Kato S et al. , Global brain dynamics embed the motor command sequence of Caenorhabditis elegans. Cell 163, 656–669 (2015). doi: 10.1016/j.cell.2015.09.034; pmid: [DOI] [PubMed] [Google Scholar]
- 40.Ahrens MB et al. , Brain-wide neuronal dynamics during motor adaptation in zebrafish. Nature 485, 471–477 (2012). doi: 10.1038/nature11057; pmid: [DOI] [PMC free article] [PubMed] [Google Scholar]
- 41.Steinmetz NA, Zatka-haas P, Carandini M, Harris KD, Distributed correlates of visually-guided behavior across the mouse brain. bioRxiv [preprint]. 20 November 2018. doi: 10.1038/s41593-017-0014-z; pmid: [DOI] [PMC free article] [PubMed] [Google Scholar]
- 42.Ryan PJ, Ross SI, Campos CA, Derkach VA, Palmiter RD, Oxytocin-receptor-expressing neurons in the parabrachial nucleus regulate fluid intake. Nat. Neurosci. 20, 1722–1733 (2017). doi: 10.1038/s41593-017-0014-z; pmid: [DOI] [PMC free article] [PubMed] [Google Scholar]
- 43.Tsao A et al. , Integrating time from experience in the lateral entorhinal cortex. Nature 561, 57–62 (2018). doi: 10.1038/s41586-018-0459-6; pmid: [DOI] [PubMed] [Google Scholar]
- 44.Lee SH, Dan Y, Neuromodulation of brain states. Neuron 76, 209–222 (2012). doi: 10.1016/j.neuron.2012.09.012; pmid: [DOI] [PMC free article] [PubMed] [Google Scholar]
- 45.Sussillo D, Neural circuits as computational dynamical systems. Curr. Opin. Neurobiol. 25, 156–163 (2014). doi: 10.1016/j.conb.2014.01.008; pmid: [DOI] [PubMed] [Google Scholar]
Associated Data
This section collects any data citations, data availability statements, or supplementary materials included in this article.