

Abstract
Radiation-induced vaginal fibrosis is a debilitating side-effect affecting up to 80% of women receiving radiotherapy for their gynecological (GYN) malignancies. Despite the significant incidence and severity, little research has been conducted to identify the pathophysiologic changes of vaginal toxicity. In a previous study, we have demonstrated that ultrasound Nakagami shape and PDF parameters can be used to quantify radiation-induced vaginal toxicity. These Nakagami parameters are derived from the statistics of ultrasound backscattered signals to capture the physical properties (e.g., arrangement and distribution) of the biological tissues. In this paper, we propose to expand this Nakagami imaging concept from 2D to 3D to fully characterize radiation-induced changes to the vaginal wall within the radiation treatment field. A pilot study with 5 post-radiotherapy GYN patients was conducted using a clinical ultrasound scanner (6 MHz) with a mechanical stepper. A serial of 2D ultrasound images, with radio-frequency (RF) signals, were acquired at 1 mm step size. The 2D Nakagami shape and PDF parameters were calculated from the RF signal envelope with a sliding window, and then 3D Nakagami parameter images were generated from the parallel 2D images. This imaging method may be useful as we try to monitor radiation-induced vaginal injury, and address vaginal toxicities and sexual dysfunction in women after radiotherapy for GYN malignancies.
Keywords: Ultrasound, Nakagami imaging, vaginal fibrosis, radiation toxicity
1. INTRODUCTION
Radiation-induced vaginal fibrosis is a debilitating side-effect, affecting 80% of women post pelvic or vaginal radiotherapy. Despite the significant incidence and severity, little research has been conducted to identify the pathophysiologic changes of vaginal toxicity. This paucity of data is largely due to the lack of an easy, reliable tool able to assess radiation-induced vaginal changes. This study’s purpose is to develop ultrasound Nakagami imaging technique to quantitatively evaluate vaginal fibrosis in a 3D manner.
The Nakagami imaging method utilizes the radio-frequency (RF) signals obtained from a clinical ultrasound scanner. These RF signals are dependent on the physical properties (e.g. shape, size, and density) of the scatterers inside the biological tissue [1]. The Nakagami distribution, initially proposed to describe the statistics of the radar echoes, is applied to analyze the statistics of the ultrasonic backscattered signals [2, 3]. The Nakagami parameters have been demonstrated to be useful for distinguishing various scatterer concentrations and arrangements in tissues [4–6]. The Nakagami statistical model has received considerable attention because the Nakagami distribution is highly consistent with the statistics of the backscattered ultrasound data, with the corresponding Nakagami parameter varying with the backscattering-envelope statistics [7, 8].
2. METHODS
The theoretical framework for Nakagami imaging relates statistical parameters to properties of the examined tissue. The analysis applies to the backscattered envelope signals of the “raw” radio-frequency echo signals, not to ultrasound B-mode image data. The formulation treats the backscattered ultrasound envelope signals as random signals. Our analysis characterizes tissue structures in terms of a stochastic probability density function (PDF) under the Nakagami statistical model [9]. The PDF of the ultrasonic backscattered envelope x under the Nakagami statistical model is define as,
| (1) |
where Γ(·) is the gamma function and W(·) is the weight function. The parameter ω is the scaling parameter, whereas u is the Nakagami parameter. Let E(·) denote the statistical mean, then scaling parameter ω and Nakagami parameter u associated with the Nakagami distribution can be obtained from the following equations:
| (2) |
| (3) |
| (4) |
| (5) |
where E(·) is the expected value operator and T is a threshold. The likelihood ratio was obtained by assuming that every envelope value within the region of interest (ROI) was independently and identically distributed. Then, the parameters ω and u were found by maximizing the likelihood ratio using an ascent algorithm [10].
The Nakagami parameter u is a shape parameter for the PDF. When u equals 1, the Nakagami distribution reduces to a Rayleigh distribution. When u is between 0 and 1, the envelope distribution is said to be pre-Rayleigh [11]. When u > 1 , the distribution conforms to post-Rayleigh, as shown in Fig. 1[12]. This property makes the Nakagami distribution a good general model for ultrasonic backscattering. When the ROI contains randomly located scatterers with varying scattering cross sections, the envelope statistics are likely to be pre-Rayleigh and u is typically between 0.5 and 1[13]. Similarly, when some spatial periodicity exists among scatterers within the resolution cell, then the envelope statistics are post-Rayleigh, and u becomes larger than unity [12]. Typically, u is used as a means to quantify the effective number of scatterers in the resolution cell. This interpretation can be obtained by noting that the random variable follows a gamma distribution and interpreting the physical relationships between u and the effective number obtained from the gamma distribution [4].
Fig. 1.

Nakagami distributions for different Nakagami parameters.
Note that the window size determines the resolution of the Nakagami parameter image. The principle notion in image formation is the resolution which describes the ability of a system to resolve the smallest details in an object. There is a trade-off between resolution and statistical power. As the window size decreases, the resolution of the Nakagami u image is improved. However, a small window has fewer envelope data points, leading to an unstable estimation of the parameter. In the evaluation of radiation toxicity, the area of treatment is large, and the irradiated tissues typically range from 5 cm to 15 cm. Therefore, resolution is not a problem in the evaluation of post-RT tissues. The principle challenge in imaging radiation toxicity is to detect early changes that might be subtle. Hence, we selected a relatively big window size of 39 sample points (beam direction) and 15 scan lines (lateral direction) to improve the statistical power. At the probe surface, the actual window size is 1.50 mm (beam) by 1.26 mm (lateral). Because of the fan shape of the beam, the lateral width increases with depth.
Nakagami u images and Nakagami PDF images are generated using a 3D sliding box. The Nakagami parameters ɷ and u are commonly used parameters, which are computed from Eqs. (2) and (3). From Eq. (1), we subsequently calculated a PDF value for the central point of the sliding box from the corresponding envelope intensity value. The sliding box is moved through the entire RF envelope image point by point, line by line and slice by slice to generate the 3D Nakagami parameter images. This sliding box method could reduce the sub-resolvable effect at the locations of the strong reflectors (e.g. tissue interface or point target) in a scattering medium. In other words, when the sliding box moves onto the strong reflector, the box not only covers the signals from the strong reflector but also contains those from the tissue background. Because there is a large difference in the echo intensity between the reflector and the background, the backscattered envelopes acquired by the box would tend to be extremely pre-Rayleigh distributed, rendering the Nakagami u parameter very small. From the Nakagami PDF and Nakagami u images, Nakagami PDF and u parameters were calculated based on the physicians’ contours of the vaginal wall.
3. RESULTS
In this study, 10 participants (5 post-radiation patients and 5 normal controls) were enrolled. The 5 patients all have received radiotherapy for their GYN malignancies (follow-up time: 20.5±7.1 months). Each subject underwent one transvaginal ultrasound study (6 MHz). Three-dimensional transverse images of the anterior vaginal wall were acquired in a 1 mm step size from the apex (vaginal cuff) to the introitus (vagina opening).
Here, the 3D Nakagami imaging method is illustrated through a case of a 54-year-old patient who had received 54 Gy external beam radiation for the her early-stage endometrial cancer. At her 2-year follow-up visit, a clinical examination showed a Grade 1 vaginal fibrosis. Transvaginal ultrasound B-mode images showed increased vaginal wall thickness at the proximal, mid and distal locations of the vagina (Figure 2, top row). The corresponding 2D Nakagami PDF images are shown in the 2nd row of Figure 2, and 2D Nakagami shape images are shown in the 3rd row of Figure 2. Figure 3 show the 3D Nakagami shape and PDF image of the anterior vaginal wall.
Fig. 2.
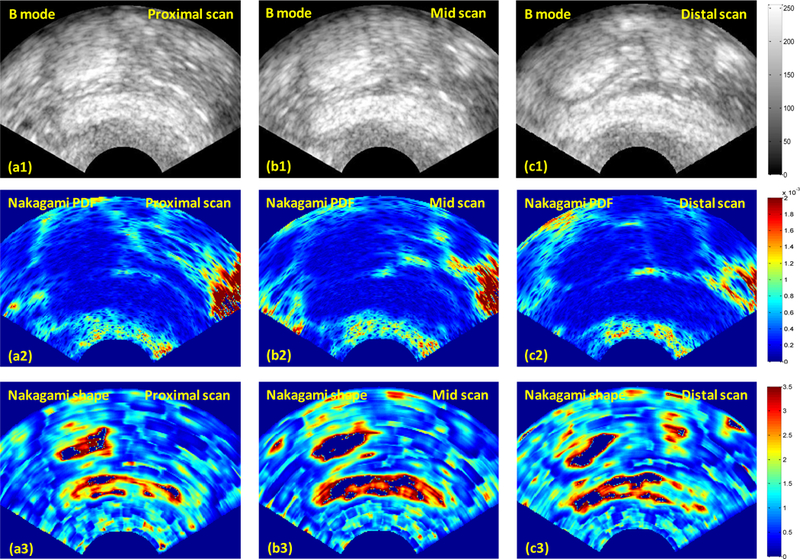
Tranvaginal ultrasound B-mode and corresponding Nakagami parameter images at the proximal, mid and distal locations of the vagina.
Fig. 3.

3D Nakagami shape and PDF image of a post-RT patient.
Figure 4 shows the Nakagami parameters for the normal and post-radiotherapy groups. The significant separations between the two groups indicated that the Nakagami method was capable of distinguishing the control from the post-RT vaginal walls. The increased Nakagami shape and PDF parameters may be related to the increases in the concentration of scatterers and periodic structures, which may be resulted from the fibrotic development and increased collagen content in the vaginal wall.
Fig. 4. Comparison of the control and post-RT groups.

(a) Nakagami shape parameter (b) Nakagami PDF.
4. DISCUSSION AND CONCLUSION
This pilot study demonstrated that 3D Nakagami imaging is a promising imaging tool for the quantitative evaluation of radiation-induced vaginal fibrosis. In this study, we proposed a new 3D Nakagami parameter imaging, to assess post-RT vaginal toxicity in vivo. Conventional B-mode imaging, generated from the intensity of the backscattered echoes, provides the anatomy and intensity of the vaginal wall. In contrast, the Nakagami parameter image, constructed using the raw RF signals, reflects the arrangements and distributions of the vaginal tissue (microstructures). The separations on the scatter grams indicated that the 3D Nakagami imaging method was capable of distinguishing the control from the post-RT vaginal walls.
Traditionally, vaginal toxicity is assessed through the physicians’ visual and tactile examination. Such assessment is subjective and, hence, potentially inconsistent. Quantitative ultrasound is an attractive alternative that could provide clinicians with a simple visualization and quantitative assessment of the vaginal injury. Computed from the statistics of the enveloped backscattered signals, the Nakagami parameters can be used to characterize various scatterer concentrations and arrangements of the biological tissues.
So far, imaging has played a negligible role in the evaluation of vaginal toxicity, and this is the first ultrasound study on post-RT vaginal fibrosis using 3D Nakagami imaging. We should note that the B-mode image method and the Nakagami-parameter method are independent and complementary [14]. The advantage of utilizing ultrasound B-mode image is its wide availability in the clinic [15, 16]. The Nakagami parameter image is constructed using the raw RF signals, and the same diagnostic ultrasound system is used in the current investigation. The Nakagami parameter estimated from the ultrasonic backscattered signals depend on the statistical distribution of echo waveform and not affected by the echo amplitude and, thus, Nakagami imaging is less operator-dependent.
In this study, we demonstrated that 3D Nakagami imaging has the potential to serve as a functional imaging tool to enhance the study of vaginal fibrosis. This imaging tool could provide greater insight into structural changes that lead to vaginal toxicity, and potentially lay the groundwork for outcome metrics of interventions to prevent and treat vaginal toxicity.
ACKNOWLEDGEMENTS
This research is supported in part by DOD PCRP Award W81XWH-13–1-0269, and National Cancer Institute (NCI) Grant CA114313.
REFERENCES
- [1].Insana MF, Wagner RF, Brown DG et al. , “Describing Small-Scale Structure in Random-Media Using Pulse-Echo Ultrasound,” Journal of the Acoustical Society of America, 87(1), 179–192 (1990). [DOI] [PMC free article] [PubMed] [Google Scholar]
- [2].Shankar PM, “A general statistical model for ultrasonic backscattering from tissues,” Ieee Transactions on Ultrasonics Ferroelectrics and Frequency Control, 47(3), 727–736 (2000). [DOI] [PubMed] [Google Scholar]
- [3].Wachowiak MP, Smolikova R, Tourassi GD et al. , “General ultrasound speckle models in determining scatterer density,” Medical Image 2002: Ultrasonic Imaging and Signal Processing, 4687, 285–295 (2002). [Google Scholar]
- [4].Shankar PM, Dumane VA, Reid JM et al. , “Classification of ultrasonic B-mode images of breast masses using Nakagami distribution,” Ieee Transactions on Ultrasonics Ferroelectrics and Frequency Control, 48(2), 569–580 (2001). [DOI] [PubMed] [Google Scholar]
- [5].Shankar PM, “A compound scattering pdf for the ultrasonic echo envelope and its relationship to K and Nakagami distributions,” IEEE Transactions on Ultrasonics Ferroelectrics and Frequency Control, 50(3), 339–343 (2003). [DOI] [PubMed] [Google Scholar]
- [6].Tsui P-H, and Wang S-H, “The effect of transducer characteristics on the estimation of Nakagami paramater as a function of scatterer concentration,” Ultrasound in Medicine & Biology, 30(10), 1345–1353 (2004). [DOI] [PubMed] [Google Scholar]
- [7].Tsui PH, Hsu CW, Ho MC et al. , “Three-dimensional ultrasonic Nakagami imaging for tissue characterization,” Physics in Medicine and Biology, 55(19), 5849–5866 (2010). [DOI] [PubMed] [Google Scholar]
- [8].Liao Y-Y, Li C-H, Tsui P-H et al. , “Strain-compounding technique with ultrasound Nakagami imaging for distinguishing between benign and malignant breast tumors,” Medical Physics, 39(5), 2325–2333 (2012). [DOI] [PubMed] [Google Scholar]
- [9].Yang X, Rossi P, Bruner DW et al. , “Noninvasive evaluation of vaginal fibrosis following radiotherapy for gynecologic malignancies: A feasibility study with ultrasound B-mode and Nakagami parameter imaging “ Med. Phys, 40(2), 7 (2013). [DOI] [PMC free article] [PubMed] [Google Scholar]
- [10].Mamou J, Coron A, Oelze ML et al. , “Three-Dimensional High-Frequency Backscatter and Envelope Quantification of Cancerous Human Lymph Nodes,” Ultrasound in Medicine and Biology, 37(3), 345–357 (2011). [DOI] [PMC free article] [PubMed] [Google Scholar]
- [11].Holfman HC, [Statistical Methods on Radio Wave Propagation (New York: Pergamon; )] RAND Corporation, New York(1960). [Google Scholar]
- [12].Mohana Shankar P, “A general statistical model for ultrasonic backscattering from tissues,” IEEE Trans Ultrason Ferroelectr Freq Control, 47(3), 727–36 (2000). [DOI] [PubMed] [Google Scholar]
- [13].Shankar PM, “A model for ultrasonic scattering from tissues based on the K distribution,” Physics in Medicine and Biology, 40(10), 1633–49 (1995). [DOI] [PubMed] [Google Scholar]
- [14].Yang X, Tridandapani S, Beitler J et al. , “Ultrasonic Nakagami-parameter characterization of parotid-gland injury following head-and-neck radiotherapy: A feasibility study of late toxicity,” Medical Physics, 41(2), (2014). [DOI] [PMC free article] [PubMed] [Google Scholar]
- [15].Yang XF, Tridandapani S, Beitler JJ et al. , “Ultrasound Histogram Assessment of Parotid Gland Injury Following Head-and-Neck Radiotherapy: A Feasibility Study,” Ultrasound in Medicine and Biology, 38(9), 1514–1521 (2012). [DOI] [PMC free article] [PubMed] [Google Scholar]
- [16].Yang XF, Tridandapani S, Beitler JJ et al. , “Ultrasound GLCM texture analysis of radiation-induced parotid-gland injury in head-and-neck cancer radiotherapy: An in vivo study of late toxicity,” Medical Physics, 39(9), 5732–5739 (2012). [DOI] [PMC free article] [PubMed] [Google Scholar]