Abstract
SDHD encodes subunit D of the succinate dehydrogenase complex, an integral membrane protein. Across cancer types, recurrent SDHD promoter mutations were reported to occur exclusively in melanomas, at a frequency of 4–5%. These mutations are predicted to disrupt consensus ETS-transcription factor binding sites and are correlated with both reduced SDHD gene expression and poor prognosis. However, the consequence of these mutations on SDHD expression in melanoma is still unclear. Here, we found that expression of SDHD in melanoma correlated with the expression of multiple ETS-transcription factors, particularly in SDHD promoter wild-type samples. Consistent with the predicted loss of ETS-transcription factor binding, we observed that recurrent hotspot mutations resulted in decreased luciferase activity in reporter assays. Furthermore, we demonstrated specific GABPA and GABPB1 binding to probes containing the wild-type promoter sequences, with binding disrupted by the SDHD hotspot promoter mutations in both quantitative mass spectrometry and band-shift experiments. Finally, using siRNA-mediated knockdown across multiple melanoma cell lines, we determined that loss of GABPA resulted in reduced SDHD expression at both RNA and protein levels. These data are consistent with a key role for GABPA/B1 as the critical ETS-transcription factors deregulating SDHD expression in the context of highly recurrent promoter mutations in melanoma, and warrant a detailed search for other recurrent promoter mutations that create or disrupt GABPA consensus sequences.
Keywords: SDHD, Promoter mutation, Melanoma, GABP
Introduction
Compared to other human cancer types, cutaneous melanomas have a high mutation burden attributable to ultraviolet radiation (UVR) exposure (1,2). The high number of mutations has complicated efforts to distinguish driver versus passenger mutations in large-scale sequencing studies (3–9). To date, most genome-scale sequencing studies have relied heavily on analysis of exomes, identifying a spectrum of driver genes with recurrent protein-coding somatic mutations and establishing a generalized framework for the genomic classification of cutaneous melanoma (4–6,8,10): BRAF-mutant, RAS-mutant, NF1-mutant, and “triple wild-type”. Still, there is an emerging body of literature suggesting an important role for non-coding somatic mutations in melanoma development (4,5), including those found within the 5’-untranslated (UTR) regions of genes (4,11) and gene promoters (12–18). Perhaps most notably, highly recurrent TERT promoter mutations that create consensus E26 transformation-specific transcription factor (ETS) binding motifs have been found in 50–85% of melanomas (12–14), as well as in the germline of two high-density melanoma families (12,15).
Recently, in an effort to identify hotspot mutations in gene promoters across multiple cancers sequenced as a part of The Cancer Genome Atlas (TCGA) project, Weinhold and colleagues identified recurrent mutations in the SDHD promoter exclusively in melanoma (18). These mutations were associated with reduced levels of SDHD expression, as well as poor prognosis. These findings were replicated by Scholz and colleagues, who analyzed 451 melanomas and found that approximately 4% of samples harbored SDHD promoter hotspot mutations (19). Consistent with the role of UVR in melanoma biology, SDHD promoter mutations occur primarily as C>T alterations in sun-exposed melanomas. The major mutations are located at chr.11:111,957,523 (TTCC>TTTC, C523T), chr.11:111,957,541 (TTCC>TTTC, C541T) and chr.11:111,957,544 (CTTCC>TTTCC, C544T) (18,19), within or adjacent to highly conserved TTCC motifs utilized by most ETS transcription factors (20). While the ETS transcription factor family is one of the largest families of transcription factors, including more than 29 human genes (21), expression of ELF1 was observed to be positively correlated with SDHD expression in TCGA samples without SDHD promoter mutation (18), suggesting a functional role for ELF1 in regulating SDHD transcription. Still, a direct role for ELF1 or other ETS family transcription factors in the regulation of SDHD in melanoma remains to be established.
The aim of this study was to further evaluate the incidence of SDHD promoter mutations in the three largest melanoma whole-genome and -exome datasets (TCGA/Broad/Yale) and to functionally assess the consequence of SDHD promoter mutations in melanoma. Consistent with two recent reports evaluating the functional significance of recurrent TERT promoter mutations (22,23), we found that the ETS transcription factors GABPA and GABPB1 specifically bind to wild-type SDHD promoter sequences, with this binding disrupted by hotspot promoter mutations. GABP (also known as nuclear respiratory factor 2) is a nuclear ETS transcription factor known to bind and activate mitochondrial genes required for electron transport and oxidative phosphorylation (24). Our findings here highlight the importance of transcription factors GABPA/B1 as key regulators of expression of select ‘driver’ genes in melanoma.
Materials and Methods
Melanoma sequencing datasets
Melanoma whole-exome sequencing (WES) or whole-genome sequencing (WGS) datasets (BAM files) were downloaded from CGHub (https://cghub.ucsc.edu) for TCGA SKCM samples (n=470; http://cancergenome.nih.gov) (4), or dbGaP (http://www.ncbi.nlm.nih.gov/gap) for Broad Institute (3) and Yale (7,8) datasets (Broad, n=122, phs000452.v1.p1; Yale, n=213, phs000933.v1.p1). TCGA mRNA expression data was downloaded from cBioPortal (http://www.cbioportal.org; RNA Seq V2 RSEM) (25). We additionally collected exome sequencing data from previously published (26) (n=44; European Nucleotide Archive, PRJEB11984) and 55 additional melanoma cell lines (obtained from the University of Arizona Cancer Center in 2007; UACC). Cell lines were initially characterized via Sanger sequencing of 10 melanoma driver genes, re-authenticated via exome sequencing (cells were simultaneously microsatellite profiled at that time, 2012; AmpFLSTR Identifiler, ThermoFisher) and re-authenticated via microsatellite profiling immediately prior to functional experiments described below (2016). Reads for all samples were aligned to the human genome (hg19) with the Burrows-Wheeler Aligner (BWA 0.6.2) (27) and processed with the Genome Analysis Toolkit (GATK 2.3) (28,29) including local realignment and base quality recalibration.
SDHD promoter mutation identification
We applied a pipeline utilizing bam files to all WGS/WES data in this study. SDHD promoter regions were defined as being 0–500 bp upstream in RefGene (http://genome.ucsc.edu/cgiDbin/hgTables). bam-readcount was used to count bases (30), and the following criteria was applied to identify recurrent promoter mutations: (1) mutation was only found in tumors; (2) sequencing depth for each mutation location was greater than 6; (3) alternative base count was greater than 2; (4) average mapping quality of each mutation location was greater than 20; (5) average base quality of each mutation location was greater than 20. Cell line mutations were validated by Sanger sequencing on a 3730xl DNA analyzer (ABI) (primers, F: TCCGCCATTGTTCGCCTC and R: CTCCAGAGAACCGCCATCTC), with forward and reverse traces analyzed using Mutation Surveyor (SoftGenetics). Expression correlation and statistical tests were performed using R (https://www.r-project.org).
Motif analysis
Prediction of mutation effects on transcription factor binding sites was performed using the motifbreakR package (31) and a comprehensive collection of human transcription factor binding sites models (HOCOMOCO) (32). We applied the information content algorithm as the method, and used a threshold of 0.0001 as the maximum P-value for a transcription binding site match in motifbreakR.
Cell culture and nuclear lysate extraction
Cell line authentication was performed as described above. Cell lines were grown in RPMI 1640 (Gibco) with 10% FBS, 200 mM HEPES (pH 7.9). Nuclear lysates were collected as described previously (23). Briefly, cells were incubated in hypotonic Buffer A (10 mM HEPES (pH 7.9), 1.5 mM MgCl2, 10 mM KCl and 0.15% NP40) and lysed by dounce homogenizer. Crude nuclei were collected by centrifugation and lysed in Buffer C (420 mM NaCl2, 20 mM HEPES (pH 7.9), 20% (v/v) glycerol, 2 mM MgCl2, 0.2 EDTA, 0.1% NP40, EDTA-free complete protease inhibitors (Roche), and 0.5 mM DTT) by rotation for one hour at 4C. Nuclear lysates were collected as the soluble fraction, snap frozen in liquid nitrogen, and stored at −80C.
SDHD promoter luciferase reporter assays
Five luciferase constructs (wild-type, C523T, C524T, C541T and C544T) were generated to containing 163bp of the genomic sequence surrounding SDHD promoter mutations (Chr11: 111,957,437–111,957,599). The fragment was PCR-amplified (primers, F: CTGAACTctcgagCTCCGCCATTGTTCGCCTC, R: GTCACTGTagatctACCCGGAACCACTTAGGCGAC) from genomic DNA purified from cells harboring wild-type and mutant SDHD promoter, sub-cloned into pGL4.23[luc2/minP] (Promega) luciferase vector, and constructs sequence-verified. Constructs were co-transfected with pGL4.74 (renilla luciferase) into human melanoma cell lines using Lipofectamine 2000 (Life Technologies). Cells were collected 24 hrs after transfection and luciferase activity was measured using the Dual-Luciferase reporter system (Promega) on GLOMAX Multi Detection System (Promega).
AP-MS/MS analysis of specific protein-DNA interactions
AP-MS/MS analysis of DNA pull-downs was performed as described previously (23). Briefly, custom 5’-biotinylated SDHD oligos were immobilized to streptavidin beads and incubated with 500 ug UACC903 nuclear lysate. Enriched proteins were denatured with urea, reduced with DTT, alkylated with IAA, and digested with trypsin overnight. Digested peptides were desalted and labeled by dimethyl chemical labeling using a label swapping approach on C18-StageTips (33,34). Peptides were separated by Easy-nLC 1000 (Thermo Fisher) and measured on a Thermo QExactive mass spectrometer. Raw MS spectra were analyzed using MaxQuant (version 1.5.1.0) by searching against the Uniprot curated human proteome (downloaded 2014.09.03) (35). Significant interactors were required to have a ratio of greater than 3.0 inter-quartile ranges in both forward and reverse experiments.
Band-shift analysis of recombinant protein-DNA interactions
Band-shift experiments were performed using the same oligos as for AP-MS/MS analysis with recombinant human GABP (Abnova, GABPA: H00002551-P01, GABPB: H00002553-P01) or ELF1 (Origene, TP760629) as described previously (23). For GABP experiments, GABPA and GABPB were mixed at equimolar concentrations for 20 minutes at room temperature prior to addition of the oligo. The molecular weights listed in the figures refer to the total molecular weight of protein used (GABPA/B combined). The resulting protein complexes were resolved on 4–20% TBE gels (Biorad) in a Mini-PROTEAN tetra cell (Biorad) at 100V for approximately 3 hours in 1X TBE. Samples were transferred onto a nylon membrane (Biodyne) in a Trans-Blot Turbo Transfer semi-dry transfer system (Biorad) at 400 mA for 10 minutes. Membranes were UV cross-linked and oligos were detected using streptavidin-HRP conjugate and a chemiluminescent substrate (Chemiluminescent Nucleic Acid Detection Module, Pierce).
siRNA transfection, qPCR, and western blotting
Pools of 4 siRNAs each respectively targeting one transcription factor gene (ELF1, PRDM1, IRF4, GABPA and GABPB1), as well as a non-specific control siRNA, were purchased from GE Dharmacon. siRNAs were transfected into human melanoma cell lines using Lipofectamine RNAiMAX (Life Technologies). At day 2–7 following transfection, total RNA was extracted from cells using RNeasy Minikit (Qiagen), followed by cDNA synthesis (iScript™ cDNA Synthesis Kit; BioRad, Hercules, CA). Quantitative real-time PCR was performed using Taqman assays (Invitrogen, Carlsbad, CA). GAPDH served as an internal control. For western blot analysis, total cell lysates were generated with RIPA (Thermo Scientific, Pittsburgh, PA) and subjected to water bath sonication. Samples were resolved by 4–12% Bis-Tris ready gel (Invitrogen) electrophoresis. The primary antibodies used were rabbit anti-SDHD (ab189945, Abcam), rabbit anti-GABPA (ABE1047, Millipore), mouse anti-GABPB1 (sc271571, Santa Cruz Biotechnology), and mouse anti-β-actin (A5316, Sigma-Aldrich).
Results
Identification of SDHD promoter mutations in multiple melanoma sequencing studies
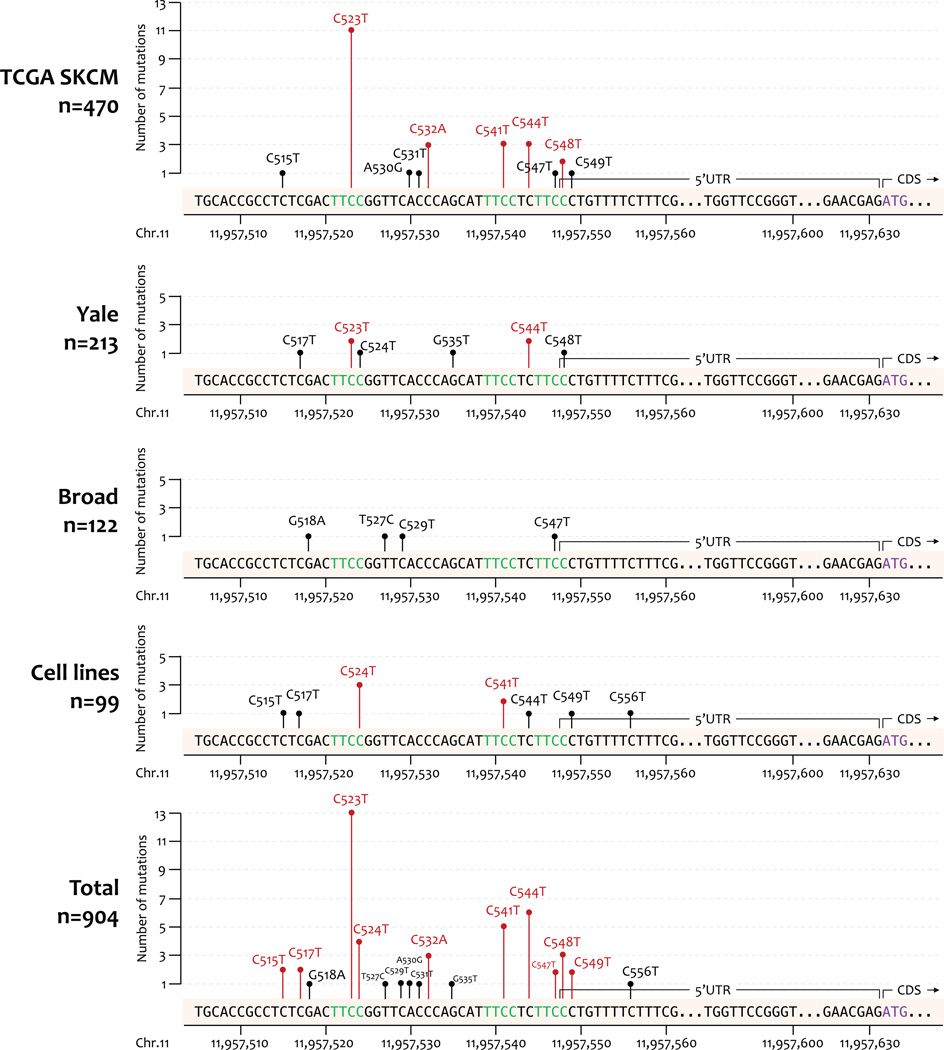
In order to investigate SDHD promoter mutations in publicly available melanoma sequencing data, we downloaded WES data for the three largest melanoma sequencing studies (TCGA SKCM=470, Broad=122 and Yale=213), high coverage WGS data for TCGA SKCM data (n=40) from CGHub and dbGaP, and supplemented with WES data generated from a panel of melanoma cell lines (n=99). This sample size here (n=904) was considerably larger than the original SDHD promoter mutation study reported by Weinhold and colleagues (17 whole-genomes, 128 whole-exomes; TCGA) (18). We searched this larger dataset for somatic mutations within the SDHD promoter and 5’UTR (hg19 Chr11:111,957,493–111,957,631). Within the TCGA dataset, five recurrent mutations were identified, including the three (C523T, C541T, C544T) reported by Weinhold and colleagues (18), as well as two additional mutations (C532A, C548T; Fig. 1). Analysis of the larger combined dataset identified a total of ten mutations observed in more than one melanoma sample, with all but one (C532A) found in multiple datasets; mutations observed in cell lines (seven mutations in eight cell lines) were all confirmed via Sanger sequencing (Supplementary Fig. S1 and data not shown). The overall frequency of all SDHD promoter mutations was 5% (46/904, Supplementary Table S1), consistent with previous reports (19). The most frequently observed mutations (C523T, C544T, C541T, C524T) all are predicted to disrupt consensus ETS transcription factor binding sites (18), and were thus chosen to further investigate the mutational consequence in melanoma.
Figure 1.
SDHD promoter mutation identification in multiple melanoma tumors datasets and cell lines. The frequencies of SDHD promoter mutations are identified from whole-genome and –exome sequencing data of 470 TCGA SKCM, 213 Yale, and 122 Broad melanoma tumors, as well as 99 melanoma cell lines. Most recurrent mutations (colored in red) within each dataset are located within or adjacent to three consensus ETS transcription binding motifs (“TTCC”, colored in green).
Allele-specific gene regulatory potential for SDHD hotspot promoter mutations
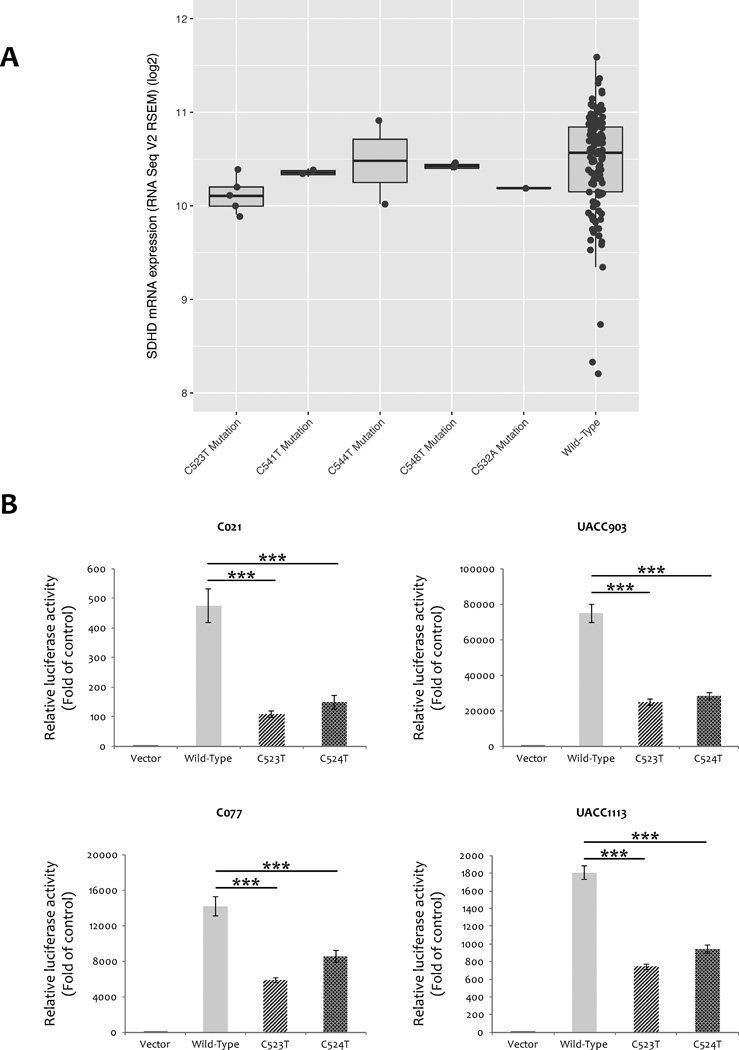
To investigate the correlation between SDHD promoter mutations and SDHD mRNA expression in melanoma, we downloaded mRNA expression data for TCGA SKCM samples from cBioPortal (RNA-Seq V2 RSEM, n=470). Several of the hotspot SDHD promoter mutations found in this dataset are predicted to disrupt consensus ETS transcription factor binding sites (18), and thus might be expected to result in reduced SDHD gene expression. Considering samples that are copy-neutral at the SDHD locus, we observed significantly lower SDHD expression in those harboring the most common (C523T) mutation relative to wild-type samples (one-tailed student’s t-test, P = 5.97 × 10⁻⁴, Benjamini & Hochberg adjusted P = 0.002, Fig. 2A). Despite small sample numbers, we also observed decreased expression for C541T (P = 0.013; adjusted P = 0.026), however differences for C548T (P = 0.050; adjusted P = 0.066) and C544T (adjusted and unadjusted P = 0.050) were not significant after adjusting for multiple testing (C532A was unassessable, n=1). Considering all samples without regard to copy number, we also observed significantly lower expression in samples with the C523T mutation relative to wild-type (one-tailed student’s t-test, P = 0.014, adjusted P = 0.041; Supplementary Fig. S2).
Figure 2.
SDHD expression difference in SDHD copy-neutral melanomas harboring promoter mutations compared to wild-type samples. A, SDHD mRNA expression is significantly decreased in TCGA SKCM samples harboring the C523T and C541T mutations relative to wild-type samples. B, SDHD promoter activity is significantly decreased by SDHD hotspot mutation (C523T and C524T). A 163-bp fragment from the wild-type SDHD promoter sequence surrounding hotspot mutations significantly enhance luciferase reporter expression relative to vector control, whereas the same fragment containing hotspot mutations decrease promoter activity relative to the wild-type sequence. Fold change over minimal promoter control (vector only) is plotted as relative luciferase activity. The experiment was performed four times with triplicates for each. Stars denote significant differences in luciferase activity by two-tailed student’s t-test (*: P-value <0.05; **: P-value <0.01; ***: P-value <0.001).
To further evaluate the functional consequences of SDHD promoter mutations on SDHD expression, we next performed luciferase reporter assays. We cloned the four most common hotspot promoter mutations occurring within or immediately adjacent to conserved ETS motifs (“TTCC”; C523T, C524T, C541T, and C544T) and wild-type promoter sequence into a luciferase vector. We tested these constructs in multiple cell lines that varied in terms of both SDHD promoter mutation status (C021, C541T and C517T; C077, C541T and C544T; UACC1113, WT; and UACC903, WT) and relative endogenous expression of SDHD (higher expression in C021 and UACC1113; relatively low levels in C077 and UACC903). Compared to the promoterless vector, the wild-type vectors exhibited strongly increased luciferase activity in all four cell lines (Fig. 2B and Supplementary Fig. S3). C523T and C524T resulted in significant reductions of reporter expression across all four cell lines (two-tailed student’s t-test P-value ranged from 4.35 × 10⁻¹¹ to 9.37 × 10−07 and 4.17 × 10⁻¹⁰ to 3.60 × 10−04, respectively. Fig. 2B). The C544T mutation, which occurs directly adjacent to a “TTCC” sequence (CTTCC>TTTCC), resulted in a significant reduction of reporter expression in three cell lines (two-tailed student’s t-test: UACC1113, P = 0.043; C021, P = 6.30 × 10−06; UACC903, P = 0.01), whereas C541T showed significant reductions in two of the four cell lines tested (two-tailed student’s t-test: UACC1113, P = 0.0053; C021, P = 2.86 × 10−05). These data are consistent with an interpretation that these mutations result in reduced levels of SDHD gene expression, while suggesting a potentially larger effect for the more commonly observed C523T mutation as well as the adjacent C524T mutation.
Effects of SDHD promoter mutations on ETS transcription factor binding
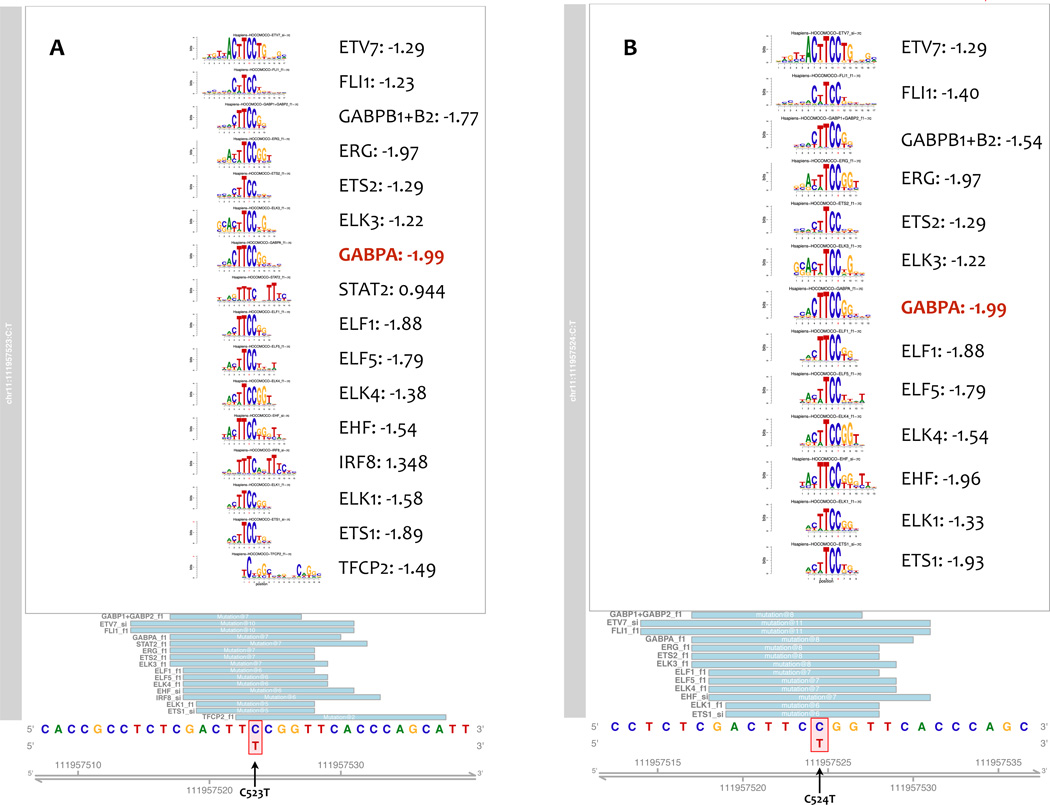
To predict mutational effects on transcription factor binding sites in the SDHD promoter, we performed motif analyses for the four most common recurrent mutations that occurred within or directly adjacent to a “TTCC” motif: C523T, C524T, C541T and C544T. As expected, the C523T mutation was predicted to disrupt multiple transcription factor binding sites, 13/16 of which were ETS transcription factor binding sties (TTCC >TTTC). We observed the same effect for the C524T mutation. These mutations were predicted to have the strongest effect on GABPA binding (Altscore-Refscore −2.0 and P-value increased from 6.68 × 10⁻⁶ to 4.25 × 10⁻³ for both C523T and C524T, Fig. 3 and Supplementary Table S2), as well as a weaker effect on binding of ELF1 (Altscore-Refscore −1.88 and P-value increased from 3.35 × 10⁻⁶ to 7.43 × 10⁻⁴ for both C523T and C524T). In contrast, the C541T mutation both created and altered consensus motifs with strongest effect on PRDM1 binding (Supplementary Fig. S4A), while C544T was predicted to only create new motifs with strongest effect on IRF4 binding (Supplementary Fig. S4B).
Figure 3.
Predicting SDHD promoter mutation effects on transcription factor binding sites. A–B, data are shown for (A) the C523T mutation and (B) the C524T mutation. Genomic sequence and coordinates are at the bottom of the display; the positions of the matches represented (light blue boxes). The position of the mutation within the motif is indicated by a red-bounding box, with the alternate allele below in red font as on the motif logo position bar above. The motif logos generated from motifstack are shown above using the color conventions of the genomic sequence below. Predicted transcription factor name and change score (Alterscore-Refscore) are shown to the right of each motif, and the transcription factor with the strongest score is highlighted in red font. Mutations leading to predicted disruption of transcription factor binding have negative change scores, while those creating new transcription factor binding sites will have a positive change scores.
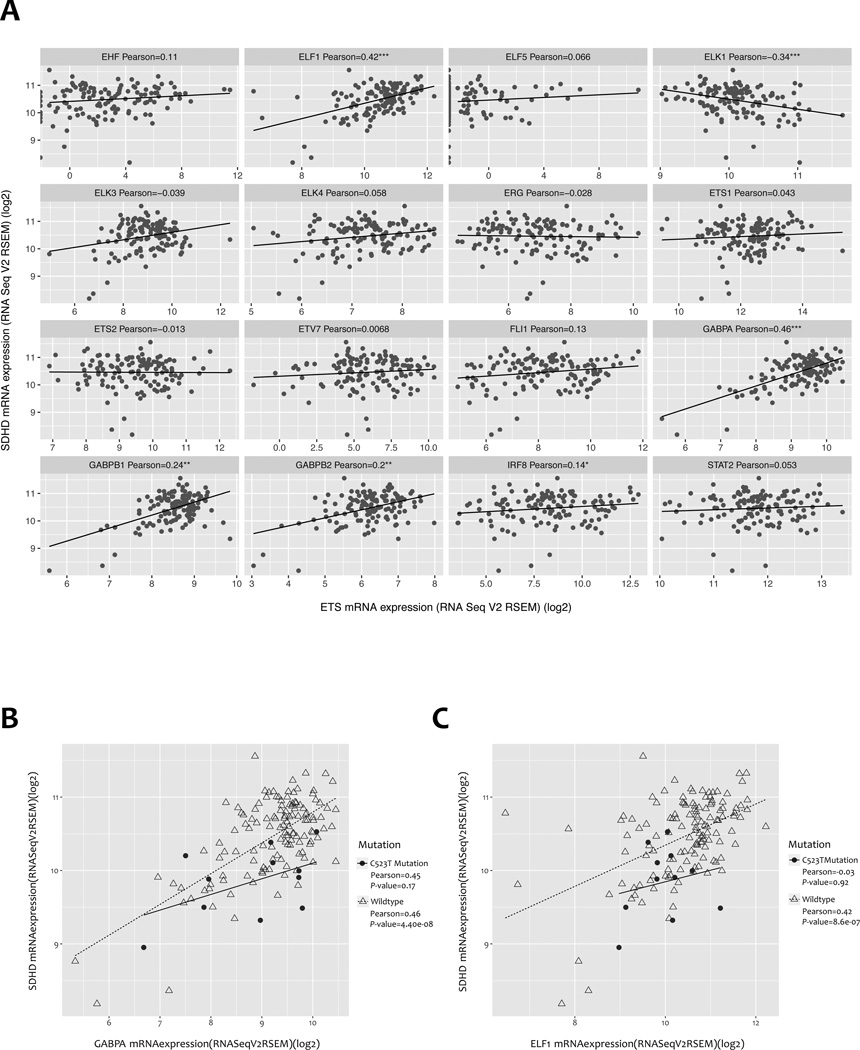
We subsequently used the TCGA SKCM gene expression dataset to evaluate the correlation between gene expression of predicted ETS transcription factors and SDHD, in both SDHD wild-type samples and samples bearing SDHD promoter mutations. Of the 13 ETS transcription factors for which binding sites are predicted to be altered by the C523T mutation, only expression levels of ELF1, GABPA, GABPB1, and GABPB2 were significantly positively correlated with SDHD mRNA levels in the subset of samples wild-type for the SDHD promoter (Fig. 4A and Supplementary Fig. S5). Among them, ELF1 and GABPA were the two most significantly correlated transcription factors, with Pearson correlation coefficients of 0.46 (P = 4.40 × 10⁻⁸) and 0.42 (P = 8.57 × 10⁻⁷), respectively (Fig. 4B and 4C); there was a non-significant trend towards correlation between expression levels of GABPA and SDHD in samples harboring the C523T mutation (Pearson correlation coefficient 0.45, P = 0.17) but not ELF1 (Pearson correlation coefficient −0.03, P = 0.92). Significant correlations were not identified between the expression of SDHD and other transcription factors whose binding sites were predicted to be disrupted specifically by the C541T, C544T, as well as several other mutations in SDHD promoter wild-type TCGA SKCM samples (data not shown). In summary, these data are consistent with a potential role for GABPA, ELF1 and/or other ETS transcription factors in mediating SDHD expression.
Figure 4.
mRNA expression correlation between SDHD and multiple ETS transcription factors in SDHD promoter wild-type TCGA SKCM samples. A, Pearson correlation of mRNA expression between SDHD and 16 ETS transcription factors predicted by motifbreakR. Significant Pearson correlations are denoted with one or more star (*: P-value <0.05; **: P-value <0.01; ***: P-value <0.001). B–C, SDHD mRNA expression is highly correlated with (B) GABPA and (C) ELF1 mRNA expression specifically in SDHD promoter wild-type SKCM samples.
Identification of GABPA and GABPB1 as proteins preferentially binding the wild-type SDHD promoter by quantitative mass spectrometry
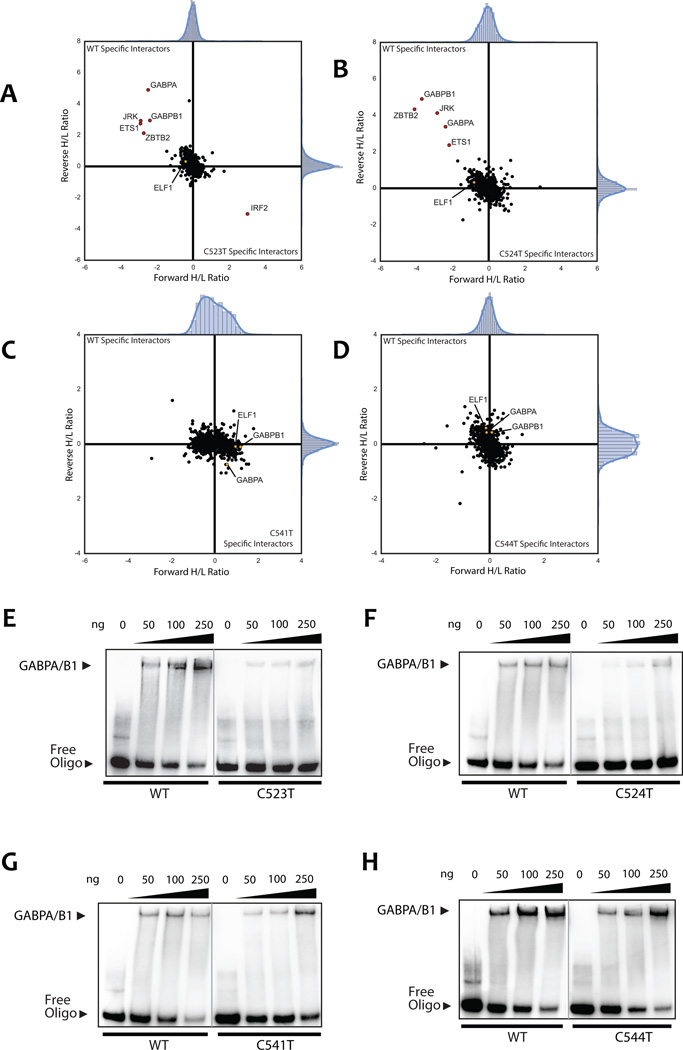
To perform an unbiased search for protein-DNA interactions specifically altered by SDHD promoter mutations, we used previously established workflows for AP-MS/MS based identification of sequence specific protein-DNA binding on a proteome-wide scale (23,36). Oligonucleotide baits were designed to encompass four mutation sites (C523T, C524T, C541T, and C544T) concurrently, and each oligo contained a mutation at one of these sites (Supplementary Table S3). All these mutations were located within the core motif of multiple ETS transcription factors as predicted by motifbreakR in silico (31). AP-MS/MS analysis of DNA pulldowns was performed using the metastatic melanoma-derived cell line UACC903. Interestingly, we identified components of the GABP transcription factor complex, GABPA and GABPB1, as wild-type specific interactors of the recurrent (C523T and C524T) SDHD promoter sites (Fig. 5A and 5B). GABP is unique amongst the ETS factors in that it alone is an obligate multimeric protein complex (22,37,38), where GABPA contains a DNA binding domain, yet the transcriptional activation domain is encoded by GABPB genes (22,39). In addition, transcription factor ETS1 might also specifically interact with the wild-type sequence of both C523T and C524T sites, albeit to a lesser degree than GABPA and GABPB1. We did not identify any transcription factors specifically interacting with the wild-type or mutant sequence at mutation sites C541T and C544T (Fig. 5C and 5D).
Figure 5.
AP-MS/MS identifies allele-specific protein-DNA interactions for hotspot SDHD promoter mutations. Custom oligos were 5’-biotinylated and designed to cover all analyzed mutation sites in the SDHD promoter as indicated in (Supplemental Table S3). Each mutation site was analyzed by two independent label-swapped experiments. ELF1, GABPA, and GABPB1, if not observed as significant interactors, are colored in yellow in the background cloud and noted by name. A, AP-MS/MS analysis of the C523T SDHD promoter mutation interactors. Interactors with a ratio of at least 3 IQR (inter-quartile range) in both replicate experiments are colored in red. Ratios are shown after log2 transformation. Labels were swapped between replicates to avoid labeling bias, hence specific interactors show a high ratio in one experiment and a low ratio in the other. B, AP-MS/MS analysis of the C524T SDHD promoter mutation interactors. C, AP-MS/MS analysis of the C541T SDHD promoter mutation interactors. D, AP-MS/MS analysis of the C544T SDHD promoter mutation interactors. E–H, band-shift experiments confirm SDHD WT-specific GABP binding at C523T and C524T mutation sites, but not C541T or C544T. Oligos were shifted using recombinant human protein as described in the materials and methods. E, band-shift analysis with the C523T SDHD promoter mutation oligo and recombinant human GABP (GABPA and GABPB1) protein. Band-shift experiments for each protein-oligo combination were resolved on the same gel at the same exposure. The grey line indicates where a single lane was cropped out for clarity. F–H, band-shift analysis with (F) C524T, (G) C541T, and (H) C544T SDHD promoter mutation oligonucleotides and recombinant human GABP protein.
To further confirm specific GABPA/GABPB1 binding at wild-type SDHD promoter mutation sites, we performed band-shift analysis of recombinant protein-DNA interactions using the same oligos previously used for AP-MS/MS analysis and recombinant human GABP or ELF1. Consistent with our results from AP-MS/MS analysis, we observed a specific and robust interaction of GABP (GABPA/B1 combined) at both the melanoma-specific C523T and C524T mutation sites via band-shift with recombinant protein (Fig. 5E and 5F). Intriguingly, band-shift experiments also revealed a present but relatively lower preference for the wild-type over the C541T and C544T mutated sequence (Fig. 5G and 5H). In addition, the band-shift experiments using recombinant ELF1 also suggested a slight preference for the wild-type sequence at C523T and C524T, especially at lower concentration (Supplementary Fig. S6). These data suggest that the transcription factors GABPA and GABPB1 specifically bind to the wild-type SDHD promoter sequence at the C523 and C524 sites, with this binding disrupted by C523T and C524T mutations.
Regulation of SDHD expression by GABPA and GABPB1
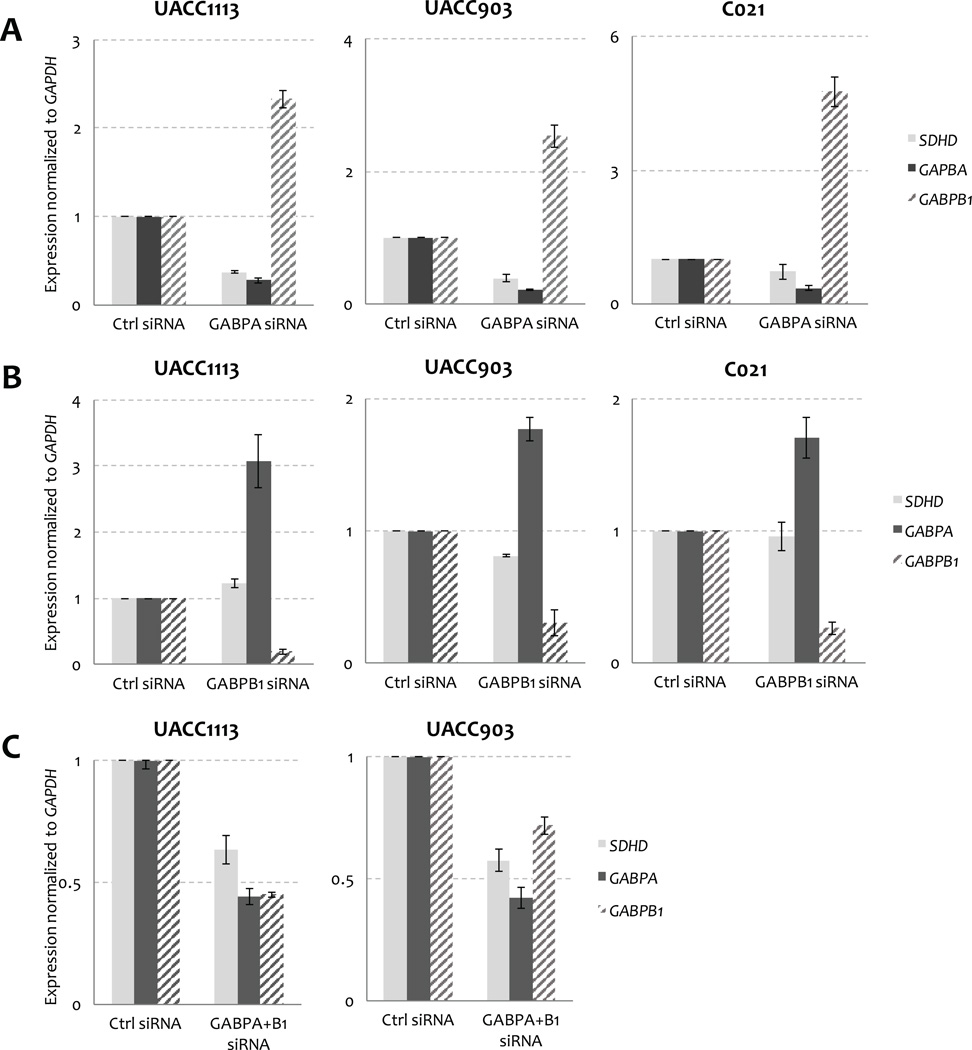
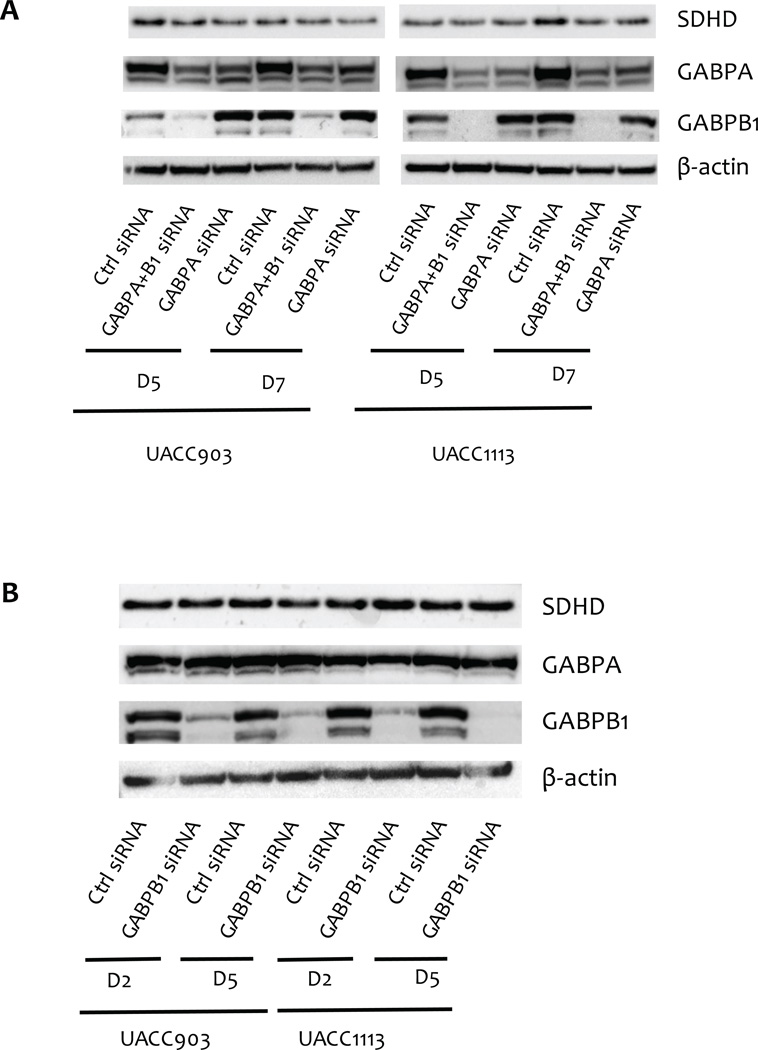
To validate the potential regulation of SDHD expression by the ETS transcription factors GABPA, GABPB1, and ELF1, we knocked down the expression of these factors via siRNA in multiple melanoma cell lines (UACC903, UACC1113 and C021). Consistent with a role for GABPA in regulating SDHD expression, we observed that depletion of GABPA resulted in significantly lower mRNA expression of SDHD in all three of the cell lines tested five days following siRNA transfection, with average normalized expression of 0.50 relative to a scrambled siRNA control (range 0.37 – 0.71; Fig. 6A). Reductions in SDHD protein levels were similarly observed upon GABPA knockdown (Fig. 7). In contrast, we did not detect a consistent effect of GABPB1 depletion on levels of SDHD mRNA (Fig. 6B) or protein product (Fig. 7); while depletion of GABPB1 resulted in a subtle reduction of SDHD expression in UACC903, GABPB1 knockdown had the opposite effect in UACC1113. These data suggest that although GABPB1 was identified as a protein binding preferentially to the wild-type SDHD promoter, other proteins may compensate for the loss of GABPB1, and a GABP complex specifically composed of both GABPA and GABPB1 may not be the sole GABP complex regulating SDHD. Intriguingly, we found that depletion of either GABPA or GABPB1 resulted in an increase in mRNA levels of the other (Fig. 6A and 6B), raising the possibility that any effect of GABPB1 depletion on SDHD expression could have been masked by increased levels of GABPA. However, commensurate increases in the protein levels of GABPA or GABPB1 are not observed upon depletion of the other (Fig. 7), making it unlikely that the subtle increase of GABPA in cells depleted of GABPB1 compensates for the loss of GABPB1. Further, concomitant depletion of both transcription factors result in a consistent decrease of SDHD at both the mRNA (Fig. 6C) and protein levels (Fig. 7). In contrast, depletion of ELF1 had no effect when tested in multiple cell lines (Supplementary Fig. S7). Knockdown of PRDM1 and IRF4, whose motifs are created by C541T and C544T mutations, respectively, resulted in varied but considerably lesser effects on SDHD expression across multiple cell lines than did depletion of GABPA (Supplementary Fig. S8A); luciferase reporter assays following knockdown of both genes suggested no change in expression for either mutation relative to that of wild-type (Supplementary Fig. S8B). Taken together, these data establish GABP as a major transcriptional regulator of SDHD.
Figure 6.
siRNA-mediated knockdown of GABPA and GABPB1 deregulates SDHD expression in melanoma cells. A, GABPA depletion decreases SDHD and increases GABPB1 expression in three melanoma cell lines (UACC1113, UACC903, and C021). B, GABPB1 depletion increases GABPA expression in three melanoma cell lines (UACC1113, UACC903 and C021), but has little effect on SDHD levels. C, concomitant depletion of both GABPA and GABPB1 decreases SDHD expression in both UACC1113 and UACC903 cell lines.
Figure 7.
Effect of siRNA-mediated knockdown of GABPA and GABPB1 on SDHD protein levels. A, concomitant depletion of both GABPA and GABPB1 or GABPA alone decreases SDHD expression at the protein level in both UACC903 and UACC1113. B, depletion of GABPB1 did not change SDHD expression at the protein level in both UACC903 and UACC1113, nor does it dramatically increase GABPA protein levels. D2, D5 and D7 denote the number of days after initial transfection in knockdown experiments.
Discussion
As reported recently (18,19), cutaneous melanomas from sun-exposed body sites harbor recurrent, but relatively rare SDHD promoter mutations, occurring most frequently at the C523T site. Most of these mutations are C>T transitions occurring within core TTCC motifs utilized by multiple ETS transcription factors. We analyzed an updated TCGA SKCM sample set (4), together with additional whole-genome or -exome sequencing datasets (3,7,8). We both validated and expanded the list of recurrent SDHD promoter mutations found in melanoma, identifying six recurrent and six individual mutations not found in the previous analysis of TCGA data (18) or confirmation study (19). Overall, the frequency of all SDHD promoter mutation in all datasets was 5.1% (46/904), which is quite consistent with the results of another independent study evaluating the frequency of SDHD promoter mutations in melanoma (19).
Five of 10 recurrent mutations in this region occur within consensus ETS-transcription factor binding sites (“TTCC”), suggesting that one or more ETS factors may play a key role in regulating SDHD levels in melanomas. Consistent with this hypothesis, we observed significantly lower levels of SDHD expression in TCGA melanomas harboring C523T and C541T mutations; power was limited to detect differences in other specific less-common mutations. Further, reporter assays conducted in multiple melanoma cell lines revealed that the most frequent of these mutations, specifically C523T, C524T, C541T, and C544T, confer significantly lower transcriptional activity than the wild-type promoter sequence, with the most consistent reductions observed for two mutations within the same conserved ETS motif (C523T and C524T). Notably, a significant proportion of TCGA melanomas also harbor DNA copy-number losses at the SDHD locus. In total, 50% (12/24) of tumors harboring SDHD promoter mutations and 56% of wild-type samples (192/343) assessable for copy-number show copy loss. Like promoter mutations, copy-number loss in both sets of samples is associated with reduced SDHD expression (P = 2.2 × 10⁻¹⁶ and P = 0.003 in wild-type or SDHD promoter-mutant samples, respectively). We observed no association between SDHD copy-number loss and SDHD hotspot promoter mutations (Fisher exact P = 0.66). These data suggest that either copy-number loss or promoter mutation may play a role in SDHD inactivation.
Previously, Weinhold and colleagues noted a correlation between mRNA levels of the ETS transcription factor ELF1 and SDHD, suggesting ELF1 as a potential key mediator of SDHD expression in melanomas (18). By analyzing expression data for multiple ETS factors in the updated TCGA SKCM dataset, we observed a positive correlation between the levels of SDHD and multiple ETS transcription factors including GABPA and ELF1. Consistent with a potential role for GABPA in regulation of SDHD, motif analysis of the relatively common C523T and C524T mutations revealed that while these mutations indeed alter consensus sequences for numerous ETS factors, including ELF1, these mutations are predicted to most strongly disrupt binding of GABPA. Taken together, these data suggest GABPA as a potential transcriptional regulator of the SDHD promoter.
We applied a mass spectrometry-based approach to identify proteins that preferentially bind to the wild-type SDHD promoter sequence as compared to several of the most commonly recurring promoter mutations (C523T, C524T, C541T, and C544T). Consistent with the motif analysis, GABPA was identified as a wild-type promoter interacting protein with binding disrupted specifically by the C523T and C524T mutations, in addition to GABPB1 and ETS1. In contrast, ELF1 did not show significant allele-preferential binding for either of these mutations. Nonetheless, both recombinant GABPA/B1 and ELF1 alone showed considerably decreased binding to oligos containing either of these two mutations. Analysis of the C541T and C544T mutations, which occur adjacent to or within a different “TTCC” motif, on the other hand, did not reveal statistically significant allele-specific binding proteins. Still, both mutations exhibited an allelic preference for both recombinant GABPA/B1 and ELF1, albeit more subtle than that observed for C523T/C524T. The differences observed between binding of recombinant proteins and those within crude lysates suggest that while both GABPA/B1 and ELF1 show an allelic preference for all four mutations, the situation is likely to be considerably more complex in melanoma cells. The observed differences may be attributable to cooperative and or competitive effects between ETS factors (40,41).
Consistent with a potential role for GABPA in regulation of SDHD, depletion of GABPA in melanoma cell lines resulted in decreased SDHD transcript and protein levels. Depletion of GABPB1, on the other hand, did not consistently reduce SDHD levels, suggesting that another protein, likely GABPB2, may compensate for the loss of GABPB1. In contrast to GABPA, depletion of ELF1 had no effect on SDHD levels. In all, these data point to GABPA, but not ELF1, as a key regulator of SDHD. Together with recent data supporting a role for GABPA in activating TERT in conjunction with recurrent promoter mutations in melanoma (22,23), these data raise the possibility that creation or alteration of GABPA binding motifs may be a more common mutational mechanism with functional consequences in melanoma.
Supplementary Material
Acknowledgments
Grant Support
This work was supported by the Intramural Research Program (IRP) of the Division of Cancer Epidemiology and Genetics, National Cancer Institute, National Institutes of Health, U.S. N. Hayward is supported by a fellowship from the National Health and Medical Research Council of Australia, M. Makowski by the DevCom FP7 Marie Curie ITN, and M. Vermeulen from Cancer Genomics Netherlands, CGC.nl.
We thank Michael Krauthammer for assistance with the Yale melanoma sequencing dataset. This work was utilized the high-performance Biowulf Linux cluster at the National Institutes of Health (http://hpc.nih.gov). We thank Christopher Schmidt for supplying cell lines used in this study, and Antonia Pritchard, Ken Dutton-Regester, Peter Johansson, Mitchell Stark, and Lauren Aoude for contributions to generating exome sequence data.
Abbreviations
- SDHD
Succinate dehydrogenase complex subunit D
- ETS
E26 transformation-specific
- ELF1
E74-like factor 1
- GABP
GA-binding protein
Footnotes
Disclosure of Potential Conflicts of Interest
No potential conflicts of interest are disclosed
References
- 1.Alexandrov LB, Nik-Zainal S, Wedge DC, Aparicio SAJR, Behjati S, Biankin AV, et al. Signatures of mutational processes in human cancer. Nature. 2013;500:415–421. doi: 10.1038/nature12477. [DOI] [PMC free article] [PubMed] [Google Scholar]
- 2.Lawrence MS, Stojanov P, Polak P, Kryukov GV, Cibulskis K, Sivachenko A, et al. Mutational heterogeneity in cancer and the search for new cancer-associated genes. Nature. 2013;499:214–218. doi: 10.1038/nature12213. [DOI] [PMC free article] [PubMed] [Google Scholar]
- 3.Berger MF, Hodis E, Heffernan TP, Deribe YL, Lawrence MS, Protopopov A, et al. Nature. Vol. 485. Nature Publishing Group; 2012. Melanoma genome sequencing reveals frequent PREX2 mutations; pp. 502–506. [DOI] [PMC free article] [PubMed] [Google Scholar]
- 4.Cancer Genome Atlas Network. Genomic Classification of Cutaneous Melanoma. Cell. 2015;161:1681–1696. doi: 10.1016/j.cell.2015.05.044. [DOI] [PMC free article] [PubMed] [Google Scholar]
- 5.Hodis E, Watson IR, Kryukov GV, Arold ST, Imielinski M, Theurillat J-P, et al. A landscape of driver mutations in melanoma. Cell. 2012;150:251–263. doi: 10.1016/j.cell.2012.06.024. [DOI] [PMC free article] [PubMed] [Google Scholar]
- 6.Nikolaev SI, Rimoldi D, Iseli C, Valsesia A, Robyr D, Gehrig C, et al. Nature Genetics. Vol. 44. Nature Publishing Group; 2012. Exome sequencing identifies recurrent somatic MAP2K1 and MAP2K2 mutations in melanoma; pp. 133–139. [DOI] [PubMed] [Google Scholar]
- 7.Krauthammer M, Kong Y, Bacchiocchi A, Evans P, Pornputtapong N, Wu C, et al. Exome sequencing identifies recurrent mutations in NF1 and RASopathy genes in sun-exposed melanomas. Nature Genetics. 2015 doi: 10.1038/ng.3361. [DOI] [PMC free article] [PubMed] [Google Scholar]
- 8.Krauthammer M, Kong Y, Ha BH, Evans P, Bacchiocchi A, McCusker JP, et al. Nature Genetics. Vol. 44. Nature Publishing Group; 2012. Exome sequencing identifies recurrent somatic RAC1 mutations in melanoma; pp. 1006–1014. [DOI] [PMC free article] [PubMed] [Google Scholar]
- 9.Shain AH, Garrido M, Botton T, Talevich E, Yeh I, Sanborn JZ, et al. Exome sequencing of desmoplastic melanoma identifies recurrent NFKBIE promoter mutations and diverse activating mutations in the MAPK pathway. Nat Genet. 2015 doi: 10.1038/ng.3382. [DOI] [PMC free article] [PubMed] [Google Scholar]
- 10.Wong SQ, Behren A, Mar VJ, Woods K, Li J, Martin C, et al. Whole exome sequencing identifies a recurrent RQCD1 P131L mutation in cutaneous melanoma. Oncotarget. 5 doi: 10.18632/oncotarget.2747. [DOI] [PMC free article] [PubMed] [Google Scholar]
- 11.Dutton Regester K, Gartner JJ, Emmanuel R, Qutob N, Davies MA, Gershenwald JE, et al. A highly recurrent RPS27 5’UTR mutation in melanoma. Oncotarget. 2014;5:2912–2917. doi: 10.18632/oncotarget.2048. [DOI] [PMC free article] [PubMed] [Google Scholar]
- 12.Horn S, Figl A, Rachakonda PS, Fischer C, Sucker A, Gast A, et al. TERT promoter mutations in familial and sporadic melanoma. Science. 2013;339:959–961. doi: 10.1126/science.1230062. [DOI] [PubMed] [Google Scholar]
- 13.Huang FW, Hodis E, Xu MJ, Kryukov GV, Chin L, Garraway LA. Highly recurrent TERT promoter mutations in human melanoma. Science. 2013;339:957–959. doi: 10.1126/science.1229259. [DOI] [PMC free article] [PubMed] [Google Scholar]
- 14.Melton C, Reuter JA, Spacek DV, Snyder M. Nature Genetics. Vol. 47. Nature Publishing Group; 2015. Recurrent somatic mutations in regulatory regions of human cancer genomes; pp. 710–716. [DOI] [PMC free article] [PubMed] [Google Scholar]
- 15.Harland M, Petljak M, Robles Espinoza CD, Ding Z, Gruis NA, van Doorn R, et al. Germline TERT promoter mutations are rare in familial melanoma. Familial Cancer. 2015 doi: 10.1007/s10689-015-9841-9. [DOI] [PMC free article] [PubMed] [Google Scholar]
- 16.Fredriksson NJ, Ny L, Nilsson JA, Larsson E. Nature Genetics. Vol. 46. Nature Publishing Group; 2014. Systematic analysis of noncoding somatic mutations and gene expression alterations across 14 tumor types; pp. 1258–1263. [DOI] [PubMed] [Google Scholar]
- 17.Denisova E, Heidenreich B, Nagore E, Rachakonda PS, Hosen I, Akrap I, et al. Frequent DPH3 promoter mutations in skin cancers. Oncotarget. 2015 doi: 10.18632/oncotarget.5771. [DOI] [PMC free article] [PubMed] [Google Scholar]
- 18.Weinhold N, Jacobsen A, Schultz N, Sander C, Lee W. Nature Genetics. Vol. 46. Nature Publishing Group; 2014. Genome-wide analysis of noncoding regulatory mutations in cancer; pp. 1160–1165. [DOI] [PMC free article] [PubMed] [Google Scholar]
- 19.Scholz SL, Horn S, Murali R, Möller I, Sucker A, Sondermann W, et al. Analysis of SDHD promoter mutations in various types of melanoma. Oncotarget. 2015 doi: 10.18632/oncotarget.4665. [DOI] [PMC free article] [PubMed] [Google Scholar]
- 20.Hollenhorst PC, McIntosh LP, Graves BJ. Genomic and Biochemical Insights into the Specificity of ETS Transcription Factors. Annu Rev Biochem. 2011;80:437–471. doi: 10.1146/annurev.biochem.79.081507.103945. [DOI] [PMC free article] [PubMed] [Google Scholar]
- 21.Sharrocks AD. The ETS-domain transcription factor family : Article : Nature Reviews Molecular Cell Biology. Nat Rev Mol Cell Biol. 2001;2:827–837. doi: 10.1038/35099076. [DOI] [PubMed] [Google Scholar]
- 22.Bell RJA, Rube HT, Kreig A, Mancini A, Fouse SF, Nagarajan RP, et al. Science. Vol. 348. American Association for the Advancement of Science; 2015. The transcription factor GABP selectively binds and activates the mutant TERT promoter in cancer; pp. aab0015–aab1039. [DOI] [PMC free article] [PubMed] [Google Scholar]
- 23.Makowski MM, Willems E, Fang J, Choi J, Zhang T, Jansen PWTC, et al. An interaction proteomics survey of transcription factor binding at recurrent TERT promoter mutations. In: Imhof A, Rappsilber J, editors. PROTEOMICS. Vol. 16. 2016. pp. 417–426. [DOI] [PubMed] [Google Scholar]
- 24.Yang Z-F, Drumea K, Mott S, Wang J, Rosmarin AG. Mol Cell Biol. Vol. 34. American Society for Microbiology; 2014. GABP transcription factor (nuclear respiratory factor 2) is required for mitochondrial biogenesis; pp. 3194–3201. [DOI] [PMC free article] [PubMed] [Google Scholar]
- 25.Cerami E, Gao J, Dogrusoz U, Gross BE, Sumer SO, Aksoy BA, et al. Cancer Discovery. Vol. 2. American Association for Cancer Research; 2012. The cBio cancer genomics portal: an open platform for exploring multidimensional cancer genomics data; pp. 401–404. [DOI] [PMC free article] [PubMed] [Google Scholar]
- 26.Stark MS, Woods SL, Gartside MG, Bonazzi VF, Dutton Regester K, Aoude LG, et al. Frequent somatic mutations in MAP3K5 and MAP3K9 in metastatic melanoma identified by exome sequencing. Nature Genetics. 2011;44:165–169. doi: 10.1038/ng.1041. [DOI] [PMC free article] [PubMed] [Google Scholar]
- 27.Li H, Durbin R. Bioinformatics. Vol. 25. Oxford University Press; 2009. Fast and accurate short read alignment with Burrows-Wheeler transform; pp. 1754–1760. [DOI] [PMC free article] [PubMed] [Google Scholar]
- 28.Van der Auwera GA, Carneiro MO, Hartl C, Poplin R, del Angel G, Levy-Moonshine A, et al. Curr Protoc Bioinformatics. Vol. 11. Hoboken, NJ, USA: John Wiley & Sons, Inc; 2013. From FastQ data to high confidence variant calls: the Genome Analysis Toolkit best practices pipeline; pp. 11.10.1–11.10.33. [DOI] [PMC free article] [PubMed] [Google Scholar]
- 29.DePristo MA, Banks E, Poplin R, Garimella KV, Maguire JR, Hartl C, et al. A framework for variation discovery and genotyping using next-generation DNA sequencing data. Nat Genet. 2011;43:491–498. doi: 10.1038/ng.806. [DOI] [PMC free article] [PubMed] [Google Scholar]
- 30.Kanchi KL, Johnson KJ, Lu C, McLellan MD, Leiserson MDM, Wendl MC, et al. Nat Commun. Vol. 5. Nature Publishing Group; 2014. Integrated analysis of germline and somatic variants in ovarian cancer. [DOI] [PMC free article] [PubMed] [Google Scholar]
- 31.Coetzee SG, Coetzee GA, Hazelett DJ. Bioinformatics. Vol. 31. Oxford University Press; 2015. motifbreakR: an R/Bioconductor package for predicting variant effects at transcription factor binding sites; pp. 3847–3849. [DOI] [PMC free article] [PubMed] [Google Scholar]
- 32.Kulakovskiy IV, Medvedeva YA, Schaefer U, Kasianov AS, Vorontsov IE, Bajic VB, et al. Nucl Acids Res. Vol. 41. Oxford University Press; 2013. HOCOMOCO: a comprehensive collection of human transcription factor binding sites models; pp. D195–D202. [DOI] [PMC free article] [PubMed] [Google Scholar]
- 33.Rappsilber J, Mann M, Ishihama Y. Protocol for micro-purification, enrichment, pre-fractionation and storage of peptides for proteomics using StageTips. Nat Protoc. 2007;2:1896–1906. doi: 10.1038/nprot.2007.261. [DOI] [PubMed] [Google Scholar]
- 34.Lau H-T, Suh HW, Golkowski M, Ong S-E. J Proteome Res. Vol. 13. American Chemical Society; 2014. Comparing SILAC- and stable isotope dimethyl-labeling approaches for quantitative proteomics; pp. 4164–4174. [DOI] [PMC free article] [PubMed] [Google Scholar]
- 35.Cox J, Mann M. MaxQuant enables high peptide identification rates, individualized p.p.b.-range mass accuracies and proteome-wide protein quantification. Nature Biotechnology. 2008;26:1367–1372. doi: 10.1038/nbt.1511. [DOI] [PubMed] [Google Scholar]
- 36.Butter F, Davison L, Viturawong T, Scheibe M, Vermeulen M, Todd JA, et al. Proteome-wide analysis of disease-associated SNPs that show allele-specific transcription factor binding. In: Barsh GS, editor. PLoS Genet. Vol. 8. 2012. p. e1002982. [DOI] [PMC free article] [PubMed] [Google Scholar]
- 37.Yang Z-F, Mott S, Rosmarin AG. The Ets transcription factor GABP is required for cell-cycle progression. Nature Cell Biology. 2007;9:339–346. doi: 10.1038/ncb1548. [DOI] [PubMed] [Google Scholar]
- 38.Thompson CC, Brown TA, McKnight SL. Science. Vol. 253. American Association for the Advancement of Science; 1991. Convergence of Ets- and notch-related structural motifs in a heteromeric DNA binding complex; pp. 762–768. [DOI] [PubMed] [Google Scholar]
- 39.LaMarco K, Thompson CC, Byers BP, Walton EM, McKnight SL. Science. Vol. 253. American Association for the Advancement of Science; 1991. Identification of Ets- and notch-related subunits in GA binding protein; pp. 789–792. [DOI] [PubMed] [Google Scholar]
- 40.Rosmarin A. GA-binding protein transcription factor: a review of GABP as an integrator of intracellular signaling and protein–protein interactions. 2004;32:143–154. doi: 10.1016/j.bcmd.2003.09.005. [DOI] [PubMed] [Google Scholar]
- 41.Li Y, Zhou Q-L, Sun W, Chandrasekharan P, Cheng HS, Ying Z, et al. Nature Cell Biology. Vol. 17. Nature Publishing Group; 2015. Non-canonical NF-[kappa]B signalling and ETS1/2 cooperatively drive C250T mutant TERT promoter activation; pp. 1327–1338. [DOI] [PMC free article] [PubMed] [Google Scholar]
Associated Data
This section collects any data citations, data availability statements, or supplementary materials included in this article.


