Abstract
Large volume deficiencies in skeletal muscle tissue fail to heal with conservative treatments, and improved treatment methods are needed. Tissue engineered scaffolds for skeletal muscle need to mimic the optimal environment for muscle development by providing the proper electric, mechanical, and chemical cues. Electroactive polymers, polymers that change in size or shape in response to an electric field, may be able to provide the optimal environment for muscle growth. In this study, an electroactive polymer made from poly(ethylene glycol) diacrylate (PEGDA) and acrylic acid (AA) is characterized and optimized for movement and biocompatibility. Hydrogel sample thickness, overall polymer concentration, and the ratio of PEGDA to AA were found to significantly impact the actuation response. C2C12 mouse myoblast cells attached and proliferated on hydrogel samples with various ratios of PEGDA to AA. Future experiments will produce hydrogel samples combined with aligned guidance cues in the form of electrospun fibers to provide a favorable environment for muscle development.
Keywords: Electroactive polymer, Hydrogel, C2C12 myoblast
1. Introduction
Large volume defects in skeletal muscle can be caused by traumatic injury, aggressive tumor ablation, and a number of myopathies. These large volume injuries leave patients with decreased mobility and diminished quality of life, and in some cases these injuries require limb amputations. Although small tears in skeletal muscle are easily repaired by the body's healing response, large volume deficiencies cause extensive scar tissue formation and loss of function. Current treatments for large volume deficiencies in skeletal muscle typically involve harvesting autograft tissue from another location in the patient's body to restore function at the injury site. Positive outcomes with functional recovery have been reported in the forearm and elbow, but results are less than satisfactory for larger defects in muscle that support the body while standing, walking, and running [1,2]. Further, this procedure results in donor site morbidity, loss of function at the donor site, and increased surgical time. A non-autograft treatment for large volume skeletal muscle defects would improve patient outcomes and possibly prevent limb loss in some cases.
Tissue engineering has the potential to provide a superior treatment for large volume defects in skeletal muscle without the need for autologous grafts. The goal of skeletal muscle tissue engineering is to regenerate skeletal muscle tissue through the use of biomaterial scaffolds, skeletal muscle progenitor cells, and various types of stimulation. The strategy typically employed by researchers generally involves isolating satellite cells (muscle progenitor cells), growing them in culture, seeding them on biomaterial scaffolds, and applying different types of chemical (growth factors), mechanical, and electrical stimulation to enhance the differentiation of the tissue [3,4]. Researchers have had success with isolating and growing satellite cells in culture, and there are numerous biomaterial scaffolds that will facilitate the differentiation of satellite cells into myotubes, or immature muscle fibers [5–7]. However, these strategies fail to produce fully differentiated muscle tissue which is capable of reproducing the contractile stress of native muscle tissue. This may be due to a lack of proper electromechanical stimulation that exists in the environment of developing muscle. Although there are promising results from some studies which apply electrical and/or mechanical stimulation to satellite cells seeded on scaffolds, these studies still fall short in elucidating the best electro-mechanical stimulus for optimal muscle development [8–10].
Hydrogels are commonly used in a variety of biomedical applications because they provide an environment that is similar to the extracellular matrix of many tissues due to their permeable and highly hydrated structure. In addition, their material properties have enormous flexibility depending on their composition and method of preparation. Electroactive polymers, a type of stimuli-responsive hydrogel, respond to an electric field by changing in size or shape. These polymers have been investigated for use as artificial muscles, biosensors, and other applications [11,12]. Ionic electroactive polymers are typically hydrogels which have been swelled with an ionic solution. When an electric field is applied, the ions in solution will move towards the oppositely charged electrode and pull water molecules in the same direction. This rearrangement of ions and water leads to a conformational change in the polymer chains of the material, which results in a bending movement [13]. The mechanical response to the movement of ions can be similar to muscle contraction in native tissue. In addition, these polymers are relatively light-weight and can produce contractile stresses comparable to native muscle tissue [14]. Thus, ionic electroactive polymers may provide a favorable environment for muscle cell development by mimicking the electro-mechanical environment of developing muscle.
In an attempt to develop a biocompatible ionic electroactive polymer, we have explored the use of poly(ethylene glycol) diacrylate (PEGDA) and poly(acrylic acid) (PAA) in crosslinked networks. PEGDA and PAA have been used together in biocompatible hydrogels for a variety of applications including drug carriers [15] and actuators [16]. Previous experiments in our laboratory have found reversible and repeatable movement in hydrogels incorporating PAA [17]. PEGDA has been heavily used in biomedical research, and it allows for precise control of the exact chemical structure of the resulting material [18]. The combination of PEGDA and PAA has the potential to produce a biocompatible actuating hydrogel with immense potential for future modification.
We hypothesize that reproducing the environment of developing muscle tissue in a cell culture system will produce mature muscle tissue, which will result in a muscle graft that can be used to replace large voids in muscle tissue. In this study, we investigate and characterize the ability of hydrogels made of PEGDA and acrylic acid (AA) to actuate in an electric field. In an attempt to optimize the extent and speed of actuation, we investigated the following parameters for their effect on hydrogel movement in rectangular prism samples: molecular weight of PEGDA, ratio of PEGDA to AA, overall polymer concentration, and sample geometry (thickness). Further, we gauged the biocompatibility of these samples by measuring the proliferation and morphology of C2C12 mouse myoblasts seeded on hydrogel samples with various ratios of PEGDA to AA.
2. Materials and methods
2.1. Hydrogel crosslinking and swelling
Poly(ethylene glycol) diacrylate (PEGDA) samples with molecular weights of 1000 Da, 4000 Da, and 10,000 Da were purchased from Monomer-Polymer and Dajac Labs (an MPD Chemicals Company). Acrylic acid (AA) monomer (anhydrous), 2,2-Dimethoxy-2-phenylacetophenone, and 1-Vinyl-2-pyrrolidinone were purchased from Sigma Aldrich. All phosphate buffered saline (PBS) used in this study was made with the following formulation per 1 L of deionized water: 8.765 g/L sodium chloride; 2.455 g/L sodium phosphate dibasic heptahydrate; 0.138 g/L monosodium phosphate. The pH of all PBS was adjusted to 7.4 using 1 M hydrogen chloride. A photo-initiator solution of 300 mg/mL of 2,2-Dimethoxy-2-phenylacetophenone in 1-Vinyl-2-pyrrolidinone was prepared using a vortex mixer.
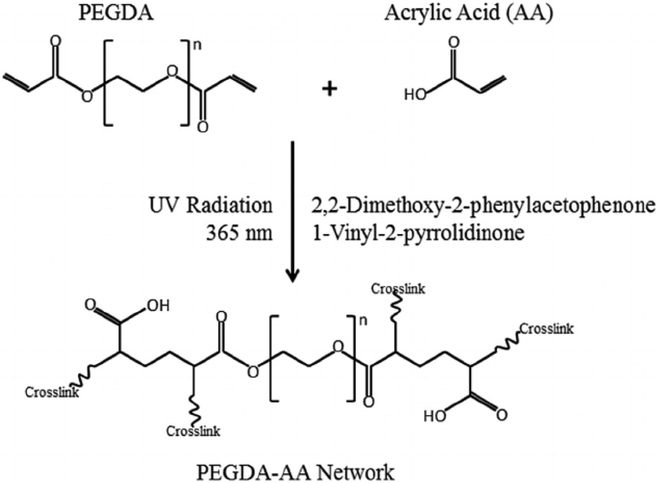
All hydrogel solutions were prepared by dissolving PEGDA and AA in PBS using a vortex mixer. The photo-initiator solution described above was added to the hydrogel solutions at a concentration of 50 μL of photo-initiator solution per 1 mL of hydrogel solution (5% v/v) just prior to applying UV radiation. The mixture of hydrogel solution and photo-initiator solution was then injected into a glass mold with pre-measured dimensions in the shape of a rectangular prism, and UV radiation at a wavelength of 365 nm was applied using a 3UV™ Lamp (UVP: Ultra-Violet Products S/N 100306-001, P/N 95-0343-01; 8 Watt. Upland, CA, USA). UV radiation was applied in 30 s intervals until the solution solidified and failed to flow. Free radical polymerization occurred, which created a random 3-dimensional polymer network, as shown in Fig. 1.
Fig. 1.
PEGDA and acrylic acid (AA) react in the presence of photo-initiator solution (2,2-dimethoxy-2-phenylacetophenone in 1-vinyl-2-pyrrolidinone) with UV radiation (365 nm). The resulting polymer network of PEGDA and AA is random, but the unit structure shown is representative of the whole network. The potential locations for additional crosslinks are marked.
Immediately after UV radiation was applied, the length, width, and thickness of the hydrogel samples were measured, and the samples were allowed to soak in PBS solution. After 3 days in PBS, the samples had reached their final size, and the dimensions of the sample were measured again. Table 1 below shows all of the samples that were used in this study and the abbreviations that will be used from this point forward.
Table 1.
The abbreviations, composition, and geometry of all of the hydrogel samples used in this study. The abbreviations for the groups are meant to emphasize the differences in composition and structure that are being investigated in each experiment. The numbers in bold indicate where the parameters have been changed in each grouping.
| Group Abbreviation |
Molecular Weight of PEGDA (Da) | Concentration of PEGDA (g/mL of PBS) | Concentration of AA (g/mL of PBS) | Thickness of Mold for Crosslinking (mm) |
|---|---|---|---|---|
| 100% PEGDA | 4000 | 0.1 | 0 | 0.75 |
| 1:4 PEGDA:AA | 4000 | 0.1 | 0.4 | 0.75 |
| 1:8 PEGDA:AA | 4000 | 0.1 | 0.8 | 0.75 |
| 1:12 PEGDA:AA | 4000 | 0.1 | 1.2 | 0.75 |
| 1:16 PEGDA:AA | 4000 | 0.1 | 1.6 | 0.75 |
| 0.9 g/mL | 4000 | 0.1 | 0.8 | 0.75 |
| 1.8 g/mL | 4000 | 0.2 | 1.6 | 0.75 |
| 2.7 g/mL | 4000 | 0.3 | 2.4 | 0.75 |
| 3.6 g/mL | 4000 | 0.4 | 3.2 | 0.75 |
| 1000 Da | 1000 | 0.1 | 0.8 | 0.75 |
| 4000 Da | 4000 | 0.1 | 0.8 | 0.75 |
| 10,000 Da | 10,000 | 0.1 | 0.8 | 0.75 |
| 0.3 mm | 4000 | 0.1 | 0.8 | 0.25 |
| 0.7 mm | 4000 | 0.1 | 0.8 | 0.5 |
| 1.0 mm | 4000 | 0.1 | 0.8 | 0.75 |
| 1.4 mm | 4000 | 0.1 | 0.8 | 1.0 |
| 1.7 mm | 4000 | 0.1 | 0.8 | 1.25 |
| 2.1 mm | 4000 | 0.1 | 0.8 | 1.5 |
In order to calculate crosslinking density and equilibrium volumetric swelling ratio, the following procedure was performed. Hydrogel samples were fabricated as previously mentioned and allowed to swell in PBS for at least 3 days. The samples were weighed to determine the swelled mass (Ms) and frozen then lyophilized overnight to obtain the dry mass (Md). The equilibrium volumetric swelling ratio (Q) was calculated using the following equation:
where ρpoly is the density of the polymer solution and ρsolv is the density of the solvent. The cross-linking density (ρx) was calculated using an adjusted form of the Flory-Rehner equation (neglecting chain ends) as shown below [19,20]:
where Vsolv is the molar volume of the solvent, χ is the solvent-polymer interaction parameter, and υp is the equilibrium polymer volume fraction (1/Q). The value of χ was taken from the literature to be 0.426 [19,21].
2.2. FTIR spectroscopy
Fourier Transform Infrared (FTIR) spectroscopy was used to characterize the hydrogels and verify the presence of specific functional groups. FTIR spectra were collected in the range of 4000 and 500 cm−1 (Thermo Scientific, Nicolet iS10). Samples were prepared by lyophilization before being placed in the machine and 32 scans were acquired at 2 cm−1 resolution with the subtraction of background (air).
2.3. Mechanical testing
Hydrogel samples were cut into 2 cm × 5 cm strips for mechanical testing (n = 4). All samples were soaked in PBS prior to being placed in the soft tissue grips of an Instron 5869 mechanical testing machine. The gauge length was 3.0 cm, and the samples were strained at a rate of 1.5 mm/min (5% strain/minute) until failure. The elastic modulus and ultimate tensile stress for each sample were calculated from the generated stress vs. strain graph. The elastic moduli and ultimate tensile stresses are reported as an average with a standard deviation for each group.
2.4. Actuation testing
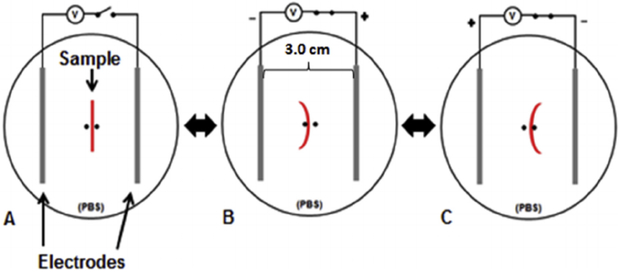
Hydrogel samples were cut into 20 mm × 4 mm strips for actuation testing (n = 4). The strips were suspended in the device depicted in Fig. 2 to measure the response to an electric field (view from above). The device consisted of a small well filled with PBS and two platinum electrodes submerged in the PBS at a distance of 3.0 cm apart. Each platinum electrode consisted of four twisted platinum wires (99.5% pure, 0.20 mm diameter). The sample was held up using two small pegs in the middle of the electrodes to prevent the sample from translating in the well. A DC voltage of 20 V, equivalent to 6.67 V/cm, was applied for 1 min at a time using an Agilent Dual Output DC Power Supply (E3646A Agilent Technologies, Santa Clara, CA, USA). The DC voltage was applied to the hydrogel strips two times in each direction, with each application lasting 1 min. Thus, 4 total minutes of stimulation were applied to each hydrogel strip. All actuation tests were recorded with a digital camera in video mode, and the videos were replayed and analyzed to determine the angular movement and speed of the hydrogel strip for each movement. The data are reported as an average for the movement in each direction (forward and reserve) with the standard deviation.
Fig. 2.
Design of device used for actuation testing (view from above). 20 V of DC voltage was applied to the hydrogel strips in a PBS bath across two platinum electrodes that were 3.0 cm apart (6.67 V/cm). A) The sample was held up by two small pegs in the middle of the electrodes which prevented the sample from translating. B) When the voltage is applied, the sample will bend towards the negative electrode. C) When the he polarity of the voltage is reversed, the sample will bend in the opposite direction.
When testing longevity of actuation, the same hydrogel strips were tested using the above procedure at time-points of 1 week, 4 weeks, 8 weeks, and 12 weeks after initial crosslinking (n = 4). In between testing, the hydrogel strips were kept at room temperature in PBS solution, which was changed every week. If necessary, the hydrogel strips were trimmed to maintain a 20 mm × 4 mm size prior to the actuation tests.
2.5. Contractile strength
Hydrogel samples were cut into 20 mm × 4 mm strips for evaluating their contractile strength (n = 4). The mechanism of measuring the contractile strength is shown in Fig. 3 (view from the side). Hydrogel strips were suspended in a vertical bath of PBS between two platinum electrodes each consisting of four twisted platinum wires (99.5% pure, 0.20 mm diameter) that were 3.0 cm apart. A DC voltage of 20 V (6.67 V/cm) was applied for up to 1 min using the same Agilent Dual Output DC Power Supply. Increasing aluminum foil weights were added to the bottom of the samples until an applied voltage no longer resulted in movement of the weight. If the bottom of the sample increased in height by at least 5 mm, then the hydrogel strip was deemed to have lifted the weight.
Fig. 3.
Contractile strength measurements in a PBS bath (side view). A) Prior to the application of voltage, the hydrogel sample hangs vertically with an aluminum weight at the end. B) After application of the voltage, the sample starts to bend towards the negative electrode, lifting the aluminum weight in the process. The hydrogel sample is outlined for visibility.
The contractile stresses of the hydrogel strips were calculated using the equation below where σContraction = contractile stress, mH = mass of hydrogel strip, mAl = mass of aluminum, VH = volume of hydrogel strip, VAl = volume of aluminum, ρH2O = density of water, g = acceleration due to gravity, and AH = cross-sectional area of the hydrogel strip. This equation accounts for the buoyancy of the hydrogel samples and aluminum weights.
2.6. C2C12 cell study
Hydrogel samples were cut to fit inside a 24-well plate and sterilized by briefly rinsing in ethanol and applying UV radiation for 30 min on each side (n = 4). The hydrogel samples were then washed with sterile PBS before soaking overnight in DMEM media with 10% fetal bovine serum (FBS) and 1% penicillin/streptomycin (P/S). Each hydrogel sample was seeded with approximately 50,000 C2C12 mouse myoblast cells (25,000 cells/cm2), which were purchased from the American type culture collection (ATCC). Blank wells (tissue culture plastic, TCP) served as a positive control and were subjected to the same conditions as the hydrogel samples. For the first three days, all wells were fed daily with DMEM media with 10% FBS and 1% P/S to encourage proliferation. For the next seven days, all wells were fed daily with DMEM media with 1% FBS and 1% P/S to encourage differentiation.
Metabolic activity and cellular attachment were assessed using a PrestoBlue® cell viability assay on day 3, day 6, and day 10 after cell seeding according to the manufacturer's instructions (n = 4). Briefly, the media from all wells was removed and replaced with PrestoBlue® cell viability reagent diluted 1:10 with media for a 1 h incubation. At the end of the incubation period, the absorbance was read on a plate reader at 570 nm. The absorbance value was proportional to the metabolic activity of the cells. On day 10 after cell seeding, the cells were fixed with a 4% paraformaldehyde solution and prepared for staining to visualize cell morphology. Cells were stained with NucBlue® fixed cell ReadyProbes® reagent (Thermo Fisher Scientific) for DNA and Fluorescein Phalloidin (Thermo Fisher Scientific) for F-actin.
2.7. Statistics
The average and standard deviation of the data for each group were calculated. All data were evaluated with a one-way ANOVA with a Tukey's post-hoc test and significance was set at α = 0.05 (denoted by *).
3. Results
3.1. Hydrogel crosslinking and swelling
After application of UV radiation, the hydrogel solutions changed from a liquid to a solid state. Immediately after cross-linking, the samples were generally transparent with some appearing a semi-opaque white color. After swelling in PBS solution for a period of 3 days, all the hydrogel samples became transparent and maintained their aspect ratio as they increased in volume.
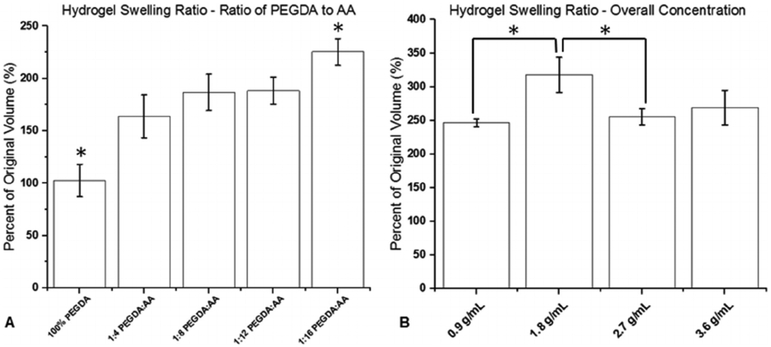
Swelling was proportional to AA concentration, as shown in Fig. 4A. Hydrogel samples without AA barely swelled in the PBS, but samples with a 1:16 ratio of PEGDA to AA swelled to more than 200% of their original size. Increasing the overall concentration of polymer in the hydrogel solutions from 0.9 g/mL to 1.8 g/mL caused a significant increase in swelling as shown in Fig. 4B. However, further increasing the concentration of polymer resulted in a decrease in swelling.
Fig. 4.
Percent change in swelling of hydrogel samples after crosslinking (n = 6). A) Different ratios of PEGDA to AA. B) Different overall polymer concentrations. (* indicates a statistically significant difference with p < 0.05).
The cross-linking density and equilibrium volumetric swelling ratio were calculated for the 1:4 PEGDA:AA and 1:16 PEGDA:AA groups to approximate the ranges of these parameters in this paper, as shown in Table 2 (n = 6). Cross-linking density increased with increasing concentration of AA. When increasing the ratio of AA to PEGDA from 1:4 to 1:16 (a four-fold increase), the cross-linking density increased nearly three-fold. The equilibrium volumetric swelling ratio was almost twice as high for the 1:4 PEGDA:AA group as the 1:16 PEGDA: AA group. The lower cross-link density in the 1:4 PEGDA:AA group likely allowed these samples to swell more than the 1:16 PEGDA:AA group.
Table 2.
The cross-linking density (mmol/L) and equilibrium volumetric swelling ratio are shown for the 1:4 PEGDA:AA and 1:16 PEGDA:AA groups. Data are shown as average ± standard deviation (n = 6).
| Hydrogel Sample | Cross-linking Density (mmol/L) | Equilibrium volumetric swelling ratio |
|---|---|---|
| 1:4 PEGDA:AA | 41 ± 2 | 19.0 ± 0.5 |
| 1:16 PEGDA:AA | 113 ± 15 | 11.4 ± 0.7 |
3.2. FTIR spectroscopy
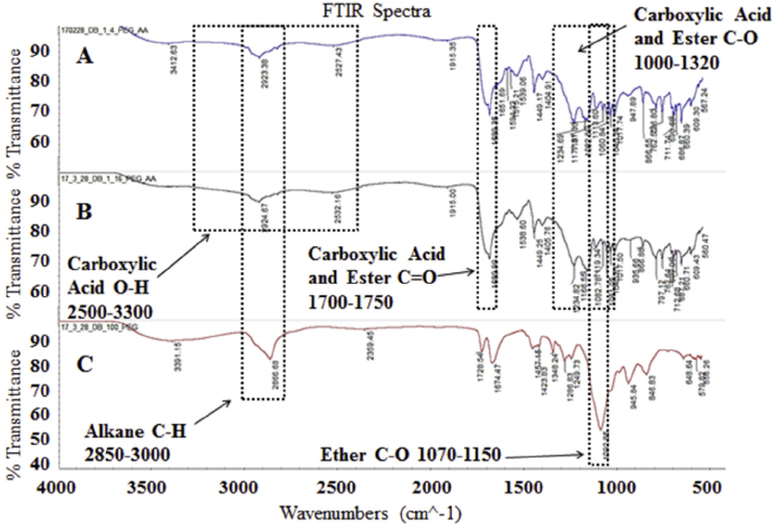
The FTIR spectra for 1:4 PEGDA:AA, 1:16 PEGDA:AA, and 100% PEGDA shown in Fig. 5 verify the structure of the resulting hydrogels. The peaks for alkane C-H bonds and ether C-O bonds are found in all three spectra. However, peaks for carboxylic acid O-H bonds and C=O bonds are found only in the 1:4 PEGDA:AA and 1:16 PEGDA:AA groups. This verifies that AA is being incorporated into the structure of the hydrogel.
Fig. 5.
The FTIR spectra of A) 1:4 PEGDA:AA, B) 1:16 PEGDA:AA, and C) 100% PEGDA. Important peaks are labeled.
3.3. Mechanical testing
After applying tensile stress to the hydrogel samples to failure, the elastic moduli and ultimate tensile stresses were calculated from the resulting stress-strain graphs as shown in Table 3. The samples generally failed in the mid-substance, but some samples failed right on the edge of the clamps. The elastic moduli of the hydrogel samples ranged from 65 kPa to 219 kPa for all samples, and the ultimate tensile stresses ranged from 16 kPa to 77 kPa. There were no significant differences in the elastic moduli from the groups with different ratios of PEGDA to AA; however, the elastic modulus increased with increasing overall polymer concentration. The 2.7 g/mL and 3.6 g/mL groups produced significantly higher moduli than the 0.9 g/mL and 1.8 g/mL groups. The 100% PEGDA group had a significantly lower ultimate tensile stress than groups with different ratios of PEGDA to AA, but there were no other significant differences in ultimate tensile stress based on overall polymer concentration.
Table 3.
Mechanical properties data including elastic modulus (kPa) and ultimate tensile stress (kPa) with n = 4. Samples are grouped by the ratio of PEGDA to AA and by the overall concentration for statistical comparisons. (* indicates a statistically significant difference with p < 0.05).
| Hydrogel Sample | Elastic Modulus (kPa) | Ultimate Tensile Stress (kPa) |
|---|---|---|
| 100% PEGDA | 96.3 ± 18.7 | 26.0 ± 5.6* |
| 1:4 PEGDA:AA | 78.4 ± 7.3 | 56.2 ± 4.5 |
| 1:8 PEGDA:AA | 89.1 ± 8.8 | 47.0 ± 11.2 |
| 1:12 PEGDA:AA | 90.0 ± 13.4 | 61.4 ± 13.7 |
| 1:16 PEGDA:AA | 77.8 ± 7.0 | 44.9 ± 9.5 |
| 0.9 g/mL | 67.3 ± 4.3* | 22.7 ± 8.7 |
| 1.8 g/mL | 96.2 ± 6.1* | 23.0 ± 3.9 |
| 2.7 g/mL | 191.8 ± 20.3 | 36.6 ± 3.4 |
| 3.6 g/mL | 213.6 ± 7.0 | 42.9 ± 23.0 |
3.4. Actuation testing
All actuation tests showed that the hydrogel samples exhibited reversible and repeatable movement when exposed to an electric field. The samples always bent towards the negative electrode, although at different speeds. The forward and reverse movements were roughly the same for all samples tested.
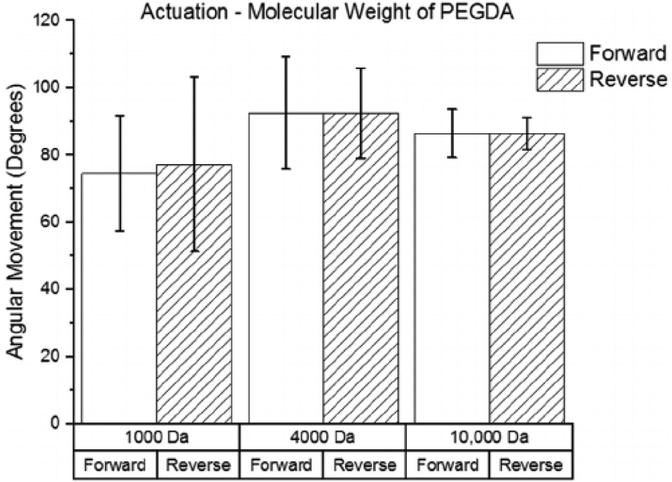
The relationship between movement and the molecular weight of the PEGDA molecule used is shown in Fig. 6. Although the 4000 Da group produced the most angular movement, there were no significant differences in the movement between the three different molecular weights of PEGDA. The average angular movement was between 74 and 93° for all groups, and samples moved roughly the same in the forward and reverse directions. A maximum movement speed of 1.9°/s was obtained by a sample in the 4000 Da group.
Fig. 6.
Effect of molecular weight of PEGDA on angular movement (n = 4). The movements in the forward and reverse directions are shown for each group.
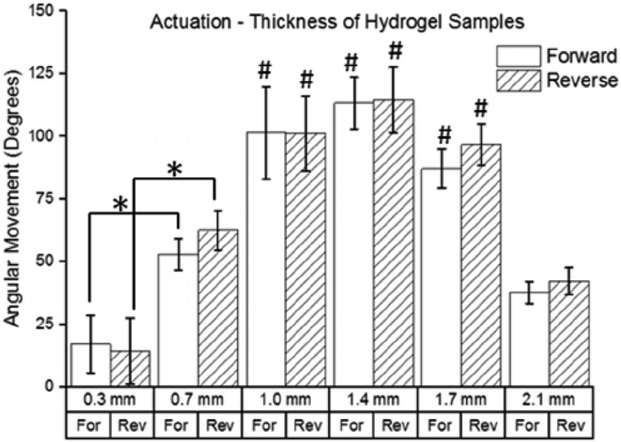
The relationship between angular movement and the thickness of the hydrogel samples is shown in Fig. 7. The results show a bellshaped curve with movement increasing as thickness increases from 0.3 mm to 1.4 mm and movement decreasing as thickness increases from 1.4 mm to 2.1 mm. The 0.3 mm group produced the lowest angular movement with 17.1 and 14.4 degrees of average forward and reverse movement, respectively. The 1.4 mm group produced the greatest angular movement with 113.2 and 114.5 degrees of average forward and reverse movement respectively, which was over 6 times the movement seen in the 0.3 mm group. The 1.4 mm group also produced the maximum movement speed at 2.1°/s. The thickest group tested (2.1 mm) produced only 37.7 and 42.1 degrees of forward and reverse movement, respectively.
Fig. 7.
Effect of hydrogel sample thickness on angular movement (n = 4). The movements in the forward and reverse directions are shown for each group. (* indicates a statistically significant difference from the corresponding movements in other groups with p < 0.05; # indicates statistically significant from the corresponding movement in the 0.3 mm, 0.7 mm, and 2.1 mm groups with p < 0.05).
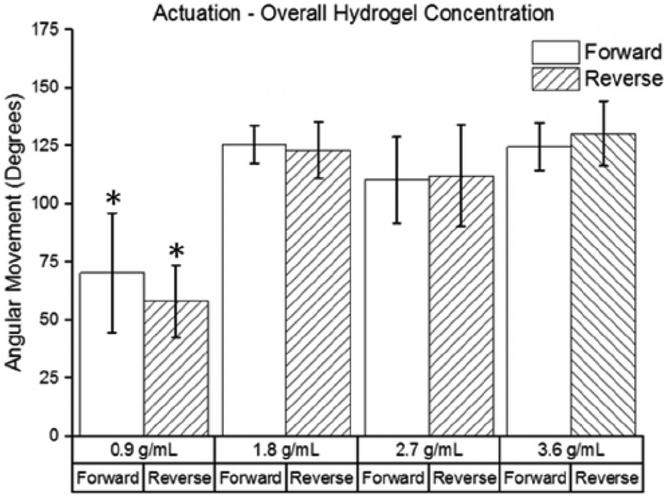
The relationship between angular movement and the overall hydrogel concentration in the hydrogel samples is shown in Fig. 8. The 0.9 g/mL group produced significantly lower angular movement than the other three groups. There were no statistically significant differences between the 1.8 g/mL, 2.7 g/mL, and 3.6 g/mL groups. A maximum movement speed of 2.4°/s was obtained by a sample in the 3.6 g/mL group.
Fig. 8.
Effect of overall polymer concentration on angular movement (n = 4). The movements in the forward and reverse directions are shown for each group. (* indicates a statistically significant difference from the corresponding movements in other groups with p < 0.05).
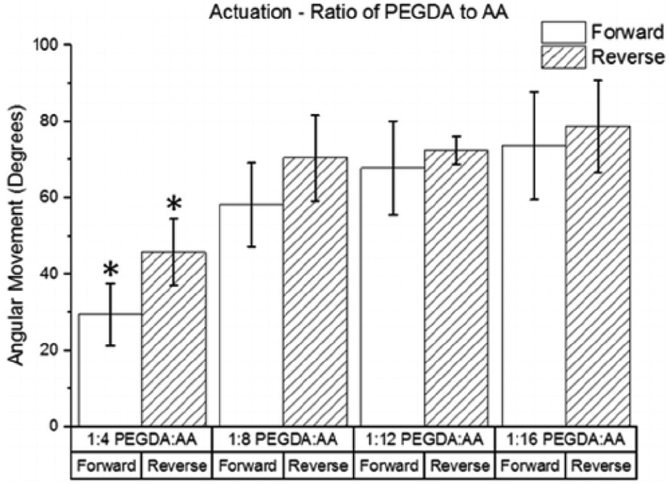
The relationship between movement and the ratio of PEGDA to AA in the hydrogel samples is shown in Fig. 9. The forward and reverse movements in the 1:4 PEGDA:AA group were significantly lower than the corresponding movements in the other three groups. Although the amount of angular movement generally increased with increasing AA concentration, there were no significant differences between the 1:8 PEGDA:AA, 1:12 PEGDA:AA, and 1:16 PEGDA: AA groups. A maximum movement speed of 1.6°/s was obtained by a sample in the 1:16 PEGDA:AA group. The 100% PEGDA group is not shown because it did not produce any movement.
Fig. 9.
Effect of ratio of PEGDA to AA on angular movement (n = 4). The movements in the forward and reverse directions are shown for each group. (* indicates a statistically significant difference from the corresponding movements in other groups with p < 0.05).
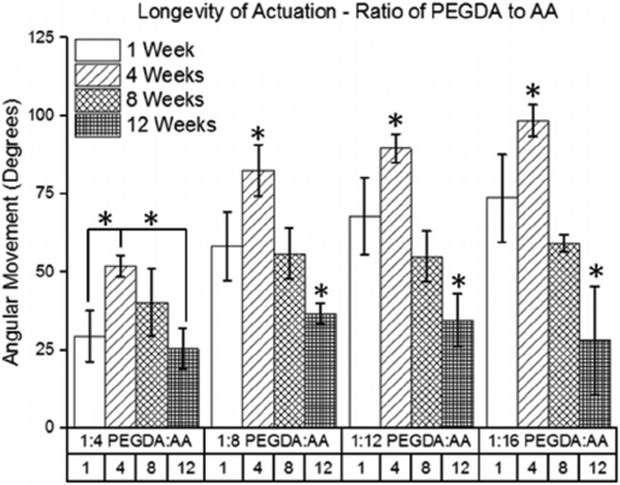
Hydrogel samples with various ratios of PEGDA to AA were able to actuate in an electric field for up to 12 weeks after crosslinking, as shown in Fig. 10. For all groups tested, the greatest angular movement was recorded 4 weeks after the hydrogel samples were crosslinked. The least angular movement was recorded 12 weeks after the hydrogel samples were crosslinked. Further, there was a greater drop in the angular movement from week 4 to week 12 for the groups with a higher concentration of AA. For instance, the angular movement in the 1:4 PEGDA:AA group dropped 51% from week 4 to week 12, but the angular movement in the 1:16 PEGDA: AA group dropped 71% across the same time period.
Fig. 10.
Longevity of angular movement for hydrogel samples with different ratios of PEGDA to AA (n = 4). For simplicity, only movements in the forward direction are shown. (* indicates a statistically significant difference from the time-points in same group with p < 0.05).
3.5. Contractile strength
Hydrogel samples were tested for their ability to move aluminum weights in a submerged system, and the resulting contractile stress measurements are shown in Table 4. The contractile stresses ranged from 297 Pa to 821 Pa for all hydrogel samples shown. There were no significant differences in contractile stress between the four hydrogel sample groups with different overall polymer concentrations. Contractile stress generally increased with increasing concentration of AA; the 1:12 PEGDA:AA and 1:16 PEGDA:AA groups produced significantly higher contractile stress than the 1:4 PEGDA:AA and 1:8 PEGDA:AA groups. Data for the 100% PEGDA samples is not shown because these samples produced no contractile stress.
Table 4.
Contractile strength of hydrogel samples with n = 4. Samples are grouped by the ratio of PEGDA to AA and by the overall concentration for statistical comparisons. (* indicates a statistically significant difference when compared to the 1:4 PEGDA:AA and 1:8 PEGDA:AA groups with p < 0.05).
| Hydrogel Sample | Contractile Stress (Pa) | Hydrogel Sample | Contractile Stress (Pa) |
|---|---|---|---|
| 1:4 PEGDA:AA | 347 ± 43 | 0.9 g/mL | 536 ± 152 |
| 1:8 PEGDA:AA | 461 ± 88 | 1.8 g/mL | 699 ± 131 |
| 1:12 PEGDA:AA | 594 ± 71* | 2.7 g/mL | 612 ± 88 |
| 1:16 PEGDA:AA | 592 ± 47* | 3.6 g/mL | 646 ± 111 |
3.6. C2C12 cell study
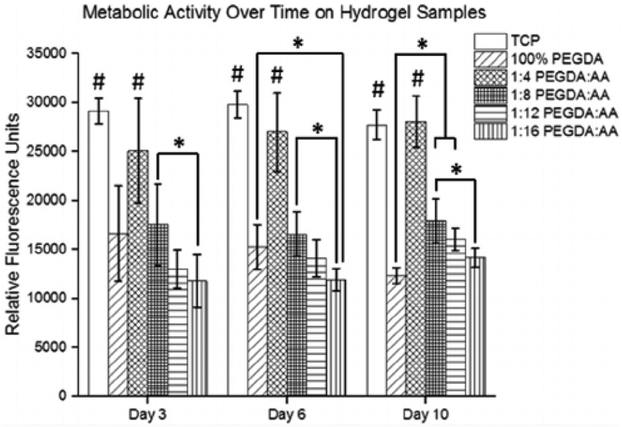
C2C12 cells were seeded on hydrogel samples with different ratios of PEGDA to AA, and the cells survived and were metabolically active through 10 days, as shown in Fig. 11. Tissue culture polystyrene (TCP) was used as a positive control. The cells seeded on TCP and the 1:4 PEGDA:AA hydrogel sample had significantly higher metabolic activity than all other groups at all time-points. There was a trend of decreasing metabolic activity with increasing concentration of AA at all time-points. While most groups had relatively constant or increasing metabolic activity throughout the study period, the 100% PEGDA group had decreasing metabolic activity over time with the lowest metabolic activity occurring on day 10.
Fig. 11.
Metabolic activity data with C2C12 cells as measured by a PrestoBlue® cell viability assay n = 4. (* indicates a statistically significant difference from the corresponding movements in other groups with p < 0.05; # indicates statistically significant from the 100% PEGDA, 1:8 PEGDA:AA, 1:12 PEGDA:AA, and 1:16 PEGDA:AA groups at the same time-point with p < 0.05).
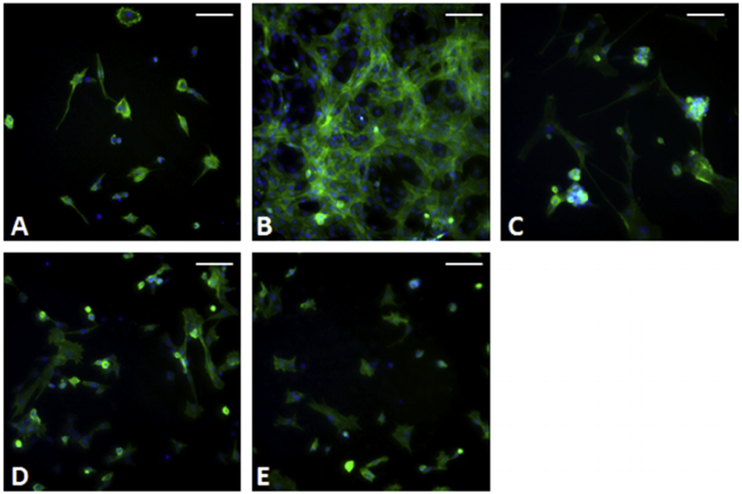
Cellular attachment and morphology were assessed by staining the cells for actin and DNA on day 10, as shown in Fig. 12. Cells were present on all hydrogel samples, although intracellular matrix production varied widely between groups. On the 100% PEGDA samples, the cells seemed to stick together and not expand much on the hydrogel (Fig. 10A). The 1:4 PEGDA:AA samples had the highest level of intracellular matrix production and attachment (Fig. 10B). In addition, there was some evidence of cell fusion, but it was difficult to find myotubes, or immature muscle fibers, that were both distinct and linear. From the 1:8 PEGDA: AA sample to the 1:16 PEGDA:AA sample, there was a trend of decreasing intracellular matrix production and lower cell attachment.
Fig. 12.
Cells were stained with phalloidin for actin (green) and DAPI for DNA (blue) and imaged at 10× magnification. A) 100% PEGDA. B) 1:4 PEGDA:AA. C) 1:8 PEGDA:AA. D) 1:12 PEGDA:AA. E) 1:16 PEGDA:AA. The scale bars are all 100 μm. (For interpretation of the references to colour in this figure legend, the reader is referred to the web version of this article.)
4. Discussion
Despite comparisons of electroactive polymers to muscles, there has been relatively little research on the implementation of electroactive polymers in skeletal muscle tissue engineering. In this paper, we developed and characterized a biocompatible ionic electroactive polymer made of PEGDA and AA in a chemically crosslinked network with the ultimate goal of providing a unique stimulus to developing muscle cells. In order to measure the extent of actuation in an electric field, we devised a highly precise method of applying electrical stimulation and measuring the resulting angular displacement. This method was used to investigate multiple parameters for their effect on the angular movement of hydrogel samples in the shape of rectangular prisms. Finally, we utilized a 10 day cell study with C2C12 mouse myoblasts to judge the biocompatibility of these hydrogel samples with various ratios of PEGDA to AA.
Hydrogels made of various compositions of PEGDA and AA were crosslinked using a photo-initiator solution of 2,2-Dimethoxy-2-phenylacetophenone in 1-Vinyl-2-pyrrolidinone and UV radiation with a wavelength of 365 nm. The resulting hydrogel samples were swelled in PBS and retained their original aspect ratio. Overall, the percentage increase in volume after swelling was proportional to AA concentration, as shown in Fig. 4A. The carboxyl groups of the AA monomers have a high polarity compared to the ether groups present in PEGDA, and the high polarity of the carboxyl groups draws water into the crosslinked polymer network. Predictably, the 100% PEGDA group swelled very little. However, there may be a limit to how much acrylic acid can be packed into a given volume, as suggested by Fig. 4B. At higher overall polymer concentrations, the amount of swelling actually decreased as compared to lower overall polymer concentrations. This may be due to a high chemical crosslink density and a larger number of physical entanglements in the 2.7 g/mL and 3.6 g/mL hydrogel samples which prevents additional water molecules from penetrating the polymer network.
Tensile testing to failure was completed by subjecting hydrogel samples to 5% strain/min, as shown in Table 3. Hydrogel samples with a greater overall polymer concentration were able to form more crosslinks with the surrounding molecules when subjected to UV radiation. Thus, both elastic modulus and ultimate tensile stress were proportional to overall polymer concentration. The ultimate tensile stress of the hydrogel samples was fairly variable, which was likely due to the tendency of some samples to fail within the grips and the variation in the exact structure of the hydrogel polymer network. It was expected that the samples with a higher concentration of AA would produce higher elastic moduli and ultimate tensile stresses, but there were no significant differences in these parameters between any of the groups with different ratios of PEGDA to AA. This trend may be explained by fewer crosslinks being formed in hydrogel samples with a higher concentration of AA. Even though there were was more opportunity for crosslinks in the hydrogel samples with a higher concentration of AA, a lower percentage of available crosslinking sites were activated by the UV radiation due to competition between crosslinking sites. Overall, the elastic moduli found in the hydrogel samples compare favorably to the elastic modulus of native muscle tissue. The elastic modulus of rat vastus lateralis muscle has been reported as 51.27 ± 28.48 kPa, and the elastic modulus of pig medial muscle has been reported as 141.12 ± 42.34 kPa [22]. These values overlap with the values that we found for most hydrogel groups with various ratios of PEGDA to AA and various overall concentrations, respectively (Table 3). Thus, hydrogel samples made of PEGDA and AA are capable of reproducing the mechanical environment of native muscle tissue with respect to elastic modulus.
The response of the hydrogel samples to an electric field of 6.67 V/cm in PBS was measured as an angular displacement. All actuation tests were performed in PBS because PBS approximates the ion concentrations in the extracellular fluid of the human body. The data show that this angular movement is reversible, consistent in both directions, and repeatable. We investigated the effect of various parameters on the actuation response including PEGDA molecular weight, thickness of hydrogel samples, overall polymer concentration, and ratio of PEGDA to AA. It was found that the molecular weight of PEGDA had little effect on the actuation response. This may be due to the fact that the relative concentration of ethylene glycol and AA monomers was roughly the same between groups. In contrast, the thickness of hydrogel samples, overall polymer concentration, and the ratio of PEGDA to AA were all found to significantly affect the actuation response. It was found that the relationship between hydrogel sample thickness and actuation response formed a bell curve. Very thin hydrogel samples had a low number of polar carboxyl groups, which bring in a low amount of water and ions, leading to a small actuation response. However, in very thick hydrogel samples, the stiffness of the sample impeded the actuation response. Thus, with samples that were roughly 1.4 mm thick, the balance of low stiffness and high number of polar carboxyl groups produced the optimal actuation response. For both overall polymer concentration and the ratio of PEGDA to AA, we saw a similar trend in the actuation data. Initially, the actuation response increased with both increasing AA concentration and increasing overall polymer concentration. However, the actuation response reached a plateau at a 1:8 ratio of PEGDA:AA and an overall polymer concentration of 1.8 g/mL. This phenomenon may be explained by the interplay between concentration of water and ions in the samples and the stiffness of the samples. As the overall polymer concentration and AA concentration increase, the number of polar carboxyl groups per unit volume increases, which initially brings in more water and ions. The mechanism of movement in these samples is powered by the movement or ions, so a greater concentration of ions inside the hydrogel should lead to more movement. However, after a certain point, there are diminishing returns in terms of bringing in more water and ions because a more densely packed hydrogel sample has less room for water and ions to permeate. In addition, the increasing stiffness of hydrssogel samples with a higher overall concentration or higher AA concentration eventually impedes movement. Thus, the actuation response was not improved by adding more AA beyond a ratio of PEGDA to AA of 1:8 or increasing the overall polymer concentration above 1.8 g/mL.
The degradation of the actuation response over time in hydrogel samples with various ratios of PEGDA to AA was measured by repeating the actuation tests at 1, 4, 8, and 12 weeks after initial crosslinking. A reversible actuation response was recorded at all time-points for all groups. It was expected that there would be a gradual decrease in the actuation response over time, and that is what was observed from week 4 through week 12. This decreased angular movement in response to an electric field was likely due to the gradual degradation of the hydrogel samples, which did not hold as high of a concentration of water and ions as freshly cross-linked samples. However, an unexpected increase in the actuation response was observed from 1 week to 4 weeks after crosslinking. This may be due to increased swelling in the samples over time prior to eventual degradation that occurs after 4 weeks. These results suggest that altering the swelling conditions of the hydrogel samples may improve the actuation response. In any case, these results show that the hydrogel samples will provide some movement in response to an electric field for at least 12 weeks after crosslinking in a simulated in vitro environment.
The contractile stress of a range of hydrogel samples was measured by applying increasing aluminum weights to the end of the samples as they bent against gravity. The contractile stress measurements were collected with samples submerged in PBS and exposed to 20 V. Because the measurements were collected underwater, the buoyancy of the system was taken into account. Although there was no significant difference between groups with different overall polymer concentrations, the 1.8 g/mL group produced the highest contractile stress. When comparing samples with different ratios of PEGDA to AA, a higher concentration of AA produced greater contractile stress due to the presence of a greater concentration of polar carboxyl groups. The values of contractile stress measured in these experiments (297 Pa–821 Pa) are lower than the contractile stress of native muscle tissue, which is estimated at around 60 kPa–380 kPa [23–26]. The contractile stress of these hydrogel samples may increase with increasing voltage, but high levels of voltage are detrimental to cell growth. Indeed, 20 V is well above the threshold for electrolysis to occur, which creates a harsh environment for cells. However, in some preliminary actuation experiments in which hydrogel samples were exposed to voltages as low as 1 V (below the threshold for electrolysis), angular movement was still observed, and this mechanical response may provide a beneficial stimulus for developing muscle tissue.
To test the biocompatibility of the developed hydrogel samples, C2C12 mouse myoblast cells were seeded on hydrogel samples with various ratios of PEGDA to AA. The cell study was designed to have a period of cell proliferation, where the C2C12 cells divided until they were confluent on the hydrogel samples, and a period of cell differentiation, where the cells fused together to form myotubes, or immature muscle fibers. Metabolic activity, which can be used as an approximation of relative cell number, was measured at the end of the proliferation phase and at two points in the differentiation phase – 3 and 7 days after differentiation media was first applied. The metabolic activity on the 1:4 PEGDA:AA group was just as high as the TCP control at all time-points, but all other groups were significantly lower than TCP at all time-points. These findings can be explained by considering the functional groups on the hydrogel samples and their effect on the acidity of the surrounding media. On the 100% PEGDA samples, the presence of ether groups did not affect the pH of the media, but they did not provide adequate sites for cellular attachment. Thus, the cells seemed to form clusters together rather than spreading out on the samples (Fig. 12A). On the 1:4 PEGDA:AA samples, the presence of carboxyl groups provided polar functional groups to facilitate cell attachment and spreading. However, as the concentration of AA increased, the pH of the media decreased, which created an increasingly hostile environment for cells. Pre-soaking the hydrogel samples in media likely improved cell attachment by allowing proteins in the media to associate to the surface of the samples. However, the C2C12 cells failed to form long, linear myotubes on any of the hydrogel groups, and the hydrogels in this study did not provide optimal sites for cell attachment. This may be caused by a lack of guidance cues on the surface of the hydrogel samples to provide support for attachment and fusion. In future experiments, linear guidance cues will be patterned or attached to the surface of the hydrogel samples to improve both cell attachment and alignment of developed myotubes. These cues may be physical channels and nanofibers or the use of hydrogel actuation to create strain in the substrate and on the cells.
5. Conclusion
In this study, we produced biocompatible, actuating hydrogels made of PEGDA and AA. It was found that the mechanical properties of these hydrogels are in the same range as skeletal muscle, which may provide a beneficial mechanical environment for developing cells. The actuation response was reversible and repeatable, and was found to depend on sample thickness, overall polymer concentration, and ratio of PEGDA to AA. The actuation response decreased over time, but angular movement occurred in a range of samples at 12 weeks after initial crosslinking. Although the contractile stress of these hydrogel samples was below that of native muscle tissue, this system can still be used to apply mechanical stress to cells in an in vitro environment. Cells attached and proliferated on hydrogel samples with a range of ratios of PEGDA to AA, but the 1:4 PEGDA:AA group produced the highest metabolic activity and matrix deposition. In the future, we will produce these hydrogel samples with guidance cues on the surface in the form of electrospun nanofibers and also investigate the effect of hydrogel movement on cellular behavior. The combination of fibrous guidance cues to a strain-inducing, electroactive scaffold should provide beneficial stimulation in the form of electrical, mechanical, and topographical cues. This system has the potential to produce a scaffold that reproduces the environment of developing muscle tissue in vitro, which will then result in a highly mature graft to be used to replace large voids in muscle tissue.
Acknowledgements
We would like to express our sincere gratitude to the following sources for funding this work, including the National Science Foundation under grant ECCS 1408202 and the National Institutes of Health under Ruth L. Kirschstein National Research Service Award T32 GM8339 from the NIGMS. In addition, we would like to thank Dr. Koustubh Dube for assisting with FTIR spectroscopy.
References
- [1].Fan C, Jiang P, Fu L, Cai P, Sun L, Zeng B, Functional reconstruction of traumatic loss of flexors in forearm with gastrocnemius myocutaneous flap transfer, Microsurgery 28 (1) (2008) 71–75. [DOI] [PubMed] [Google Scholar]
- [2].Vekris MD, Beris AE, Lykissas MG, Korompilias AV, Vekris AD, Soucacos PN, Restoration of elbow function in severe brachial plexus paralysis via muscle transfers, Injury 39 (Suppl 3) (2008) S15–S22. [DOI] [PubMed] [Google Scholar]
- [3].Liao H, Zhou G-Q, Development and progress of engineering of skeletal muscle tissue, Tissue Eng. Part B Rev 15 (3) (2009) 319–331. [DOI] [PubMed] [Google Scholar]
- [4].Klumpp D, Horch RE, Kneser U, Beier JP, Engineering skeletal muscle tissue – new perspective in vitro and in vivo, J. Cell. Mol. Med 14 (11) (2010) 2622–2629. [DOI] [PMC free article] [PubMed] [Google Scholar]
- [5].Sirivisoot S, Harrison BS, Skeletal myotube formation enhanced by electrospun polyurethane carbon nanotube scaffolds, Int. J. Nanomedicine 6 (2011) 2483–2497. [DOI] [PMC free article] [PubMed] [Google Scholar]
- [6].Chen M-C, Sun Y-C, Chen Y-H, Electrically conductive nanofibers with highly oriented structures and their potential application in skeletal muscle tissue engineering, Acta Biomater. 9 (2013) 5562–5572. [DOI] [PubMed] [Google Scholar]
- [7].Jun I, Jeong S, Shin H, The stimulation of myoblast differentiation by electrically conductive sub-micron fibers, Biomaterials 30 (2009) 2038–2047. [DOI] [PubMed] [Google Scholar]
- [8].Stern-Straeter J, Bach AD, Stangenberg L, Foerster VT, Horch RE, Stark GB, Beier JP, Impact of electrical stimulation on three-dimensional myoblast cultures – a real-time RT_PCR study, J. Cell. Mol. Med 9 (4) (2005) 883–892. [DOI] [PMC free article] [PubMed] [Google Scholar]
- [9].Haghighipour N, Heidarian S, Shokrgozar MA, Amirizadeh N, Differential effects of cyclic uniaxial stretch on human mesenchymal stem cell into skeletal muscle cell, Cell Biol. Int 36 (2012) 669–675. [DOI] [PubMed] [Google Scholar]
- [10].Liao I-C, Liu JB, Bursae N, Leong KW, Effect of electromechanical stimulation on the maturation of myotubes on aligned electrospun fibers, Cell. Mol. Bioeng 1 (2–3) (2008) 133–145. [DOI] [PMC free article] [PubMed] [Google Scholar]
- [11].Shahinpoor M, Bar-Cohen Y, Simpson JO, Smith J, Ionic polymer-metal composites (IPMCs) as biomimetic sensors, actuators and artificial muscles – a review, Smart Mater. Struct 7 (6) (1998) R15–R30. [Google Scholar]
- [12].Kim KJ, Tadokoro S, Electroactive Polymers for Robotic Applications: Artificial Muscles and Sensors, Springer-Verlag, London, UK, 2007. (Print). [Google Scholar]
- [13].Shahinpoor M, Kim KJ Ionic polymer-metal composites: I, Fundamentals. Smart Mater. Struct 10 (2001) 819–833. [Google Scholar]
- [14].Bar-Cohen Y, Electroactive Polymer (EAP) Actuators as Artificial Muscles: Reality, Potential, and Challenges, second ed., SPIE—The International Society for Optical Engineering, Bellingham, Washington, 2004, ISBN 0-8194-5297-1. [Google Scholar]
- [15].Serra L, Domenech J, Peppas NA, Drug transport mechanisms and release kinetics from molecularly designed poly(acrylic acid-g-ethylene glycol) hydrogels, Biomaterials 27 (2006) 5440–5451. [DOI] [PubMed] [Google Scholar]
- [16].Wang L-P, Ren J, Yao M-Q, Yang X-C, Yang W, Li Y, Synthesis and characterization of self-oscillating P(AA-co-AM)PEG semi-IPN hydrogels based on a pH oscillator in closed system, Chin. J. Polym. Sci 32 (12) (2014) 1581–1589. [Google Scholar]
- [17].McKeon-Fischer KD, Flagg DH, Freeman JW, Poly(acrylic acid)/poly(vinyl alcohol) compositions coaxially electrospun with poly( -caprolactone) and multi-walled carbon nanotubes to create nanoactuating scaffolds, Polymer 52 (2011)4736–4743. [Google Scholar]
- [18].Inada Y, Furukawa M, Sasaki H, Kodera Y, Hiroto M, Nishimura H, Matsushima A, Biomedical and biotechnological application of PEG- and PM-modified proteins, Trends Biotechnol. 13 (3) (1995) 86–91. [DOI] [PubMed] [Google Scholar]
- [19].Bryant SJ, Chowdhury TT, Lee DA, Bader DL, Anseth KS, Crosslinking density influences chondrocyte metabolism in dynamically loaded photo-crosslinked poly(ethylene glycol) hydrogels, Ann. Biomed. Eng 32 (3) (2004) 407–417. [DOI] [PubMed] [Google Scholar]
- [20].Flory PJ, Principles of Polymer Chemistry, Cornell University Press, Ithaca, NY, 1953. [Google Scholar]
- [21].Merrill EW, Dennison KA, Sung C, Partitioning and diffusion of solutes in hydrogels of poly(ethylene oxide), Biomaterials 14 (1993) 1117–1126. [DOI] [PubMed] [Google Scholar]
- [22].McKeon-Fischer KD, Flagg DH, Freeman JW, Coaxial electrospun poly( -caprolactone), multiwalled carbon nanotubes, and polyacrylic acid/polyvinyl alcohol scaffold for skeletal muscle tissue engineering, J. Biomed. Mater. Res. Part A 99A (2011) 493–499. [DOI] [PubMed] [Google Scholar]
- [23].Close RI, Dynamic properties of fast and slow skeletal muscle of the rat after nerve cross-union, J. Physiol. Lond 204 (1969) 331–346. [DOI] [PMC free article] [PubMed] [Google Scholar]
- [24].Burke RE, Tsairis P, Anatomy and innervation ratios in the motor units in cat gastrocnemius, J. Physiol 234 (1973) 769–775. [DOI] [PMC free article] [PubMed] [Google Scholar]
- [25].Lannergren J, Westerblad H, The temperature dependence of isometric contraction of single, intact fibres dissected from a mouse foot muscle, J. Physiol 390 (1987) 285–293. [DOI] [PMC free article] [PubMed] [Google Scholar]
- [26].Kanda K, Hashizume K, Factors causing difference in force output among motor units in the rat medial gastrocnemius muscle, J. Physiol 448 (1992) 677–695. [DOI] [PMC free article] [PubMed] [Google Scholar]


