Abstract
Objective
To examine associations between measures of obesity in middle to early-old age with later-life MRI markers of brain aging.
Methods
We analyzed data from the Northern Manhattan MRI Sub-Study (n = 1,289). Our exposures of interest were body mass index (BMI), waist circumference (WC), waist-to-hip ratio, and plasma adiponectin levels. Our outcomes of interest were total cerebral volume (TCV), cortical thickness, white matter hyperintensity volume (WMHV), and subclinical brain infarcts (SBI). Using multivariable linear and logistic regression models adjusted for sociodemographics, health behaviors, and vascular risk factors, we estimated β coefficients (or odds ratios) and 95% confidence intervals (CIs) and tested interactions with age, sex, and race/ethnicity.
Results
On average at baseline, participants were aged 64 years and had 10 years of education; 60% were women and 66% were Caribbean Hispanic. The mean (SD) time lag between baseline and MRI was 6 (3) years. Greater BMI and WC were significantly associated with thinner cortices (BMI β [95% CI] −0.089 [−0.153, −0.025], WC β [95% CI] −0.103 [−0.169, −0.037]) in fully adjusted models. Similarly, compared to those with BMI <25, obese participants (BMI ≥30) exhibited smaller cortical thickness (β [95% CI] −0.207 [−0.374, −0.041]). These associations were particularly evident for those aged <65 years. Similar but weaker associations were observed for TCV. Most associations with WMHV and SBI did not reach statistical significance.
Conclusions
Adiposity in early-old age is related to reduced global gray matter later in life in this diverse sample. Future studies are warranted to elucidate causal relationships and explore region-specific associations.
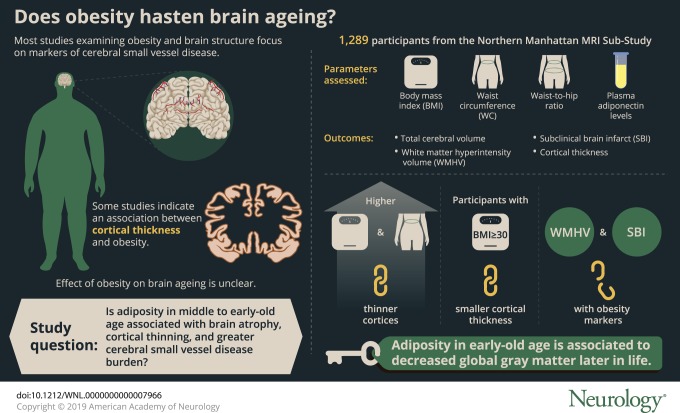 Maintaining a healthy weight is an important metric defining optimal brain health,1 but the mechanism through which obesity may affect brain aging is unclear. Obesity is associated with hypertension, diabetes, dyslipidemia, and chronic inflammation, all of which are related to worse brain health.2 In addition, adipocytokines, such as adiponectin, have been associated with neuroprotective mechanisms and may serve as biomarkers for risk stratification.3
Most studies examining measures of obesity and brain structure have focused on markers of cerebral small vessel disease4–10 and volumetric measures of brain structure.4–13 Also, many of these studies have been conducted in predominately non-Hispanic white samples, despite the greater burden of obesity and dementia in minority populations.14,15 Further, few epidemiologic studies have examined cortical thickness in relation to obesity. Though cortical thickness and gray matter volumes similarly predict Alzheimer disease, cortical thickness is less confounded by head size and surface area and may represent a distinct biological entity from cerebral volume.16,17 Some studies of cortical thickness and obesity have been conducted in small, clinical, and nonrepresentative samples,18,19 but a few larger studies have shown that greater weight is related to cortical thinning.20,21 However, results are generally mixed.19,22,23
In the present study, we hypothesized that global obesity and central adiposity would be related to brain atrophy, cortical thinning, and greater cerebral small vessel disease burden. We analyzed data from the Northern Manhattan Study (NOMAS), an ongoing longitudinal cohort study of diverse, clinically stroke-free older adults. We also examined how these associations varied by age, sex, and race/ethnicity.
Methods
Source and analytic samples
Recruitment of the original NOMAS cohort began between 1993 and 2001 and has been described previously.24 Briefly, potential participants were identified via random digit-dialing and screened for the following eligibility criteria: (1) clinically stroke-free, (2) aged >40 years old, and (3) lived in Northern Manhattan for at least 3 months in a household with a telephone. The original NOMAS cohort (n = 3,298) underwent a demographic and clinical interview (in English or Spanish) with trained bilingual research associates as well as a physical and neurologic examination with study neurologists. From 2003 to 2008, participants from the original NOMAS cohort were recruited into the NOMAS MRI Sub-Study. Eligibility criteria for the MRI Sub-Study included (1) clinically stroke-free, (2) aged >50 years old, and (3) no contraindications to MRI. An additional 199 household members currently living with enrolled NOMAS participants were also recruited at this time to maximize enrollment in the MRI substudy, resulting in 1,290 participants enrolled. Our analytic sample consisted of participants from the NOMAS MRI Sub-Study who had available total cerebral volume (TCV), white matter hyperintensity volume (WMHV), and subclinical brain infarct (SBI) data available (n = 1,289). Cortical thickness data were available in a subsample of these participants (n = 947).
Standard protocol approvals, registrations, and participant consents
All participants provided written informed consent, and the study was approved by institutional review boards at the University of Miami and Columbia University Medical Center.
Predictors of interest: Measures of obesity
Data on predictors of interest were obtained from the original NOMAS baseline visit for participants who were recruited into the NOMAS MRI Sub-Study from the original NOMAS cohort. For household members who were newly recruited into the NOMAS MRI Sub-Study between 2003 and 2008, predictor data were from the time of the MRI visit.
Anthropomorphic measurements, including height, weight, and waist and hip circumferences, were obtained using standardized protocols as previously described.25 Briefly, body mass index (BMI) was calculated as weight in kilograms divided by height in meters squared (kg/m2) and assessed continuously and categorically using cutoffs from the Centers for Disease Control and Prevention (CDC) (obese: BMI ≥30, overweight: 25 to <30, and reference: BMI <25).26 Only 9 participants were underweight (BMI <18.5), and thus we included them in the reference category. Waist and hip circumferences were measured in inches with a flexible tape measure while participants were standing and wearing no heavy outer garments. Waist circumference (WC) was measured at the level of the umbilicus, and hip circumference was measured at the level of the bilateral greater trochanters, as previously described.25 Waist-to-hip ratio (WHR) was computed as WC divided by hip circumference. We also assessed central obesity defined by WC (WC >40 inches for men and WC >35 inches for women27) and WHR (WHR >0.9 for men and WHR >0.85 for women28).
In a subsample of participants, adiponectin concentrations were measured from stored frozen plasma (n = 1,066) as previously described.29 Briefly, adiponectin concentrations were measured using a commercially available double antibody immunoassay (Linco Research, Millipore, Billerica, MA; Cat #HADP-61HK). Samples were diluted (1:5,000) prior to assay since human adiponectin serum concentrations are in the μg/mL range and the assay uses standards ranging from 1 to 100 ng/mL. Adiponectin concentrations were assessed continuously and in quartiles.
Outcomes of interest: MRI markers of brain aging
Brain MRIs were obtained between 2003 and 2008 on a single 1.5T Philips Intera scanner (Philips, Best, the Netherlands) at Columbia University Medical Center. Measurement of total intracranial volume (TIV), TCV, and WMHV using T1 (spoiled gradient recalled echo) and fluid-attenuated inversion recovery sequences has been described previously.30 Briefly, images were sent to the University of California, Davis, for analysis. To obtain TIV, nonbrain elements were removed manually by operator-guided tracing of the dura mater within the cranium (including the middle cranial fossa and excluding the posterior fossa and brainstem). To obtain TCV, whole brain voxels from the segmentation of T1-weighted images were summed. To obtain WMHV, voxels exhibiting an image intensity ≥3.5 SD above the mean image intensity were summed, then multiplied by pixel dimensions and section thickness.
For cortical thickness measurements, images were analyzed at the University of Miami Miller School of Medicine using the Freesurfer image analysis suite version 5.1 (surfer.nmr.mgh.harvard.edu/). Freesurfer measurements were limited to 947 MRI Sub-Study participants due to image quality requirements. T1-weighted MRI underwent motion correction, skull stripping, and transformation into Talairach space. Then images were segmented, gray and white matter boundaries were identified, and images underwent further automated topology correction and surface deformation.31,32 To obtain overall mean cortical thickness, we averaged the mean left and right hemisphere cortical thickness measurements.
Determination of SBIs has been published previously.33 Briefly, a superimposed image of the subtraction, proton density, and T2-weighted images at 3 times magnified view was used to assist in the interpretation of lesion characteristics. Two raters were used to determine the presence of infarcts, and agreement between them has been generally good (previously published κ values: 0.73–0.90).34
Covariates
Standardized questions adapted from the Behavioral Risk Factor Surveillance System from the CDC were used to obtain self-reported data on medical and risk factor history. Participants self-identified their race/ethnicity in response to questions modeled after the US Census. The difference in years between the NOMAS baseline visit and the MRI visit was computed. Smoking status was self-reported as never (reference), current, or former. Physical activity was measured using a questionnaire adapted from the National Health Interview Survey of the National Center for Health Statistics. Moderate to heavy physical activity was defined as engaging in one or more physically intense activities within a typical 14-day period as previously described.35 Moderate alcohol consumption was measured using a modified Block National Cancer Institute Food Frequency questionnaire, and defined as current drinking of >1 drink per month up to 2 drinks per day as previously described.36 Antihypertensive, diabetic, and cholesterol-lowering medication usage was also self-reported. Systolic and diastolic blood pressures were computed as the average of 2 blood pressure readings (with a 10-minute rest) from the right brachial artery using a calibrated sphygmomanometer. Blood glucose was measured from serum using standard protocols. Low-density lipoprotein (LDL) and high-density lipoprotein (HDL) cholesterol were measured using standard enzymatic procedures in an automated spectrometer. Participants underwent a neurocognitive battery at MRI, which has been detailed in previous publications.30 Briefly, interrelationships between individual neuropsychological test scores were explored using factor analysis and a Scree plot of eigenvalues to determine the number of constructs (i.e., domains). Individual test scores were converted to z scores, and domain-specific z scores were computed as the mean of relevant individual test z scores. Cognitive impairment was defined as having at least one domain-specific z score ≤−1.5.
Statistical analysis
Sample characteristics were summarized as means (with SD) for normally distributed, continuous data, medians (with 1st and 3rd quartiles) for skewed continuous data, and frequencies (with percents) for categorical data. We compared covariate distributions across BMI categories using 2-sample t tests (for normally distributed continuous variables), Kruskal-Wallis tests (for non-normal continuous variables), and χ2 tests for categorical data.
We modeled TCV, WMHV, and cortical thickness using unadjusted and multivariable linear regression models. We modeled SBI using unadjusted and multivariable logistic regression models. To aid in comparison of point estimates, TCV and cortical thickness were converted into z score units. Due to the right-skewed distribution of WMHV, we applied a natural log-transformation to WMHV after the addition of a small constant to achieve normality and homoscedasticity of residuals in linear models. We also confirmed assumptions of logistic models by checking that the continuous predictors of interest were linearly related to the logit graphically. Beta estimates and 95% confidence limits for log-WMHV were transformed using the following formula: (ebeta − 1) × 100, such that a one-unit increase in the predictor is associated with a β-unit percent change in WMHV.37 Beta estimates (or odds ratios [ORs]) and 95% confidence intervals (CIs) are presented from these analyses. Listwise deletion was used to address missing covariate data in all analyses. All hypothesis testing was 2-sided, and α was a priori set at 5% for all main outcomes.
Covariates for the models above were chosen based on a priori knowledge of the potential confounders and mediators between obesity and brain health, as well as known predictors of our outcomes of interest. To assess multicollinearity, only covariates with a variance inflation factor <10 were included in models.38 Model 1 consisted of known confounders of the association of interest: age at baseline, sex, race/ethnicity, years of education, years between baseline and MRI, smoking status, moderate to heavy physical activity, and moderate alcohol consumption. Model 2 consisted of covariates from model 1 and further adjusted for potential mediators (i.e., vascular risk factors): systolic blood pressure, diastolic blood pressure, antihypertensive medication use, fasting blood glucose, diabetic medication use, HDL cholesterol, LDL cholesterol, and cholesterol-lowering medication use. For the outcomes of TCV and WMHV, TIV was also added as a covariate to account for differences in head size. Finally, we also explored potential effect modification by age, sex, and race/ethnicity in post hoc analyses by adding the appropriate 2-way multiplicative interaction terms to model 1. Stratified analyses were conducted when the p value for the interaction term was ≤0.05.
We conducted sensitivity analyses to address potential selection bias, reverse causation by cognitive status, missing data, and the non-normal distribution of WMHV. First, we compared covariate distributions between participants included and excluded from the MRI cohort, with and without cortical thickness data available, and household members with original cohort members. These comparisons were tested using 2-sample t tests (for normally distributed continuous variables), Wilcoxon rank-sum tests (for non-normal continuous variables), and χ2 tests for categorical data. We also re-ran fully adjusted main analyses among participants who were recruited from the original cohort (i.e., excluding household members recruited at MRI, n = 1,090). Second, we re-ran fully adjusted main analyses among those who were deemed cognitively unimpaired (n = 1,087). Third, we re-ran fully adjusted main analyses using 10 multiply imputed datasets, assuming a multivariate normal distribution.39 Fourth, we re-ran WMHV analyses using multivariable quantile regression models adjusted for model 1 covariates to model the expected median WMHV (as opposed to the expected mean of log WMHV).
All analyses were conducted in SAS 9.4 (SAS Institute, Cary, NC). Figures were generated using ggplot2 package40 in R (r-project.org/) and coded through RStudio (rstudio.com/). Data for tables e-6 through e-9 are available from Dryad (doi.org/10.5061/dryad.2ss22k3).
Data availability statement
Anonymized data not published within this article can be shared by request by any qualified investigator.
Results
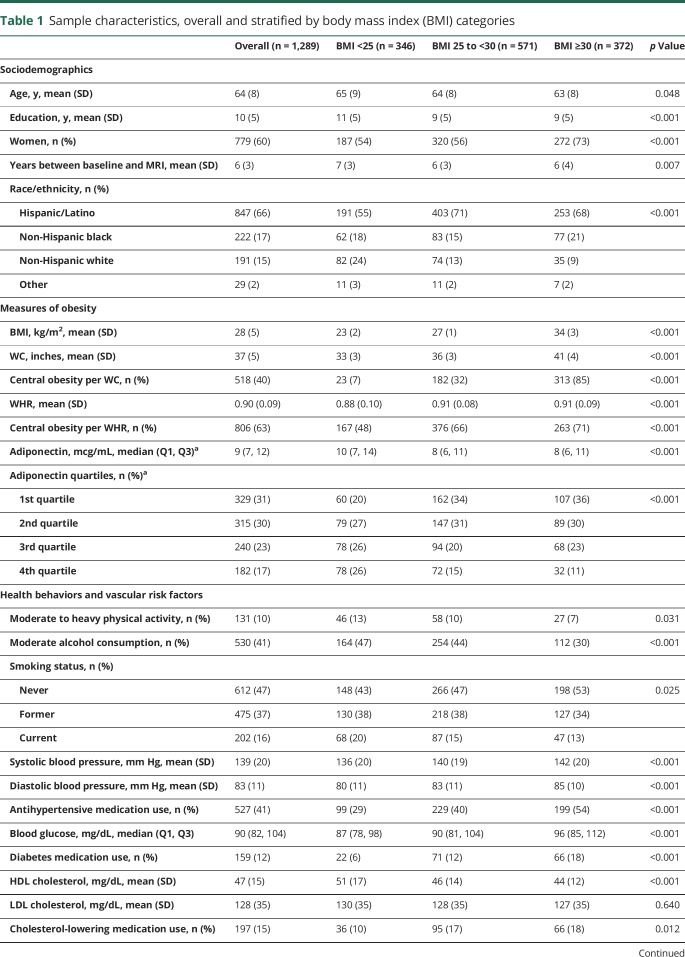
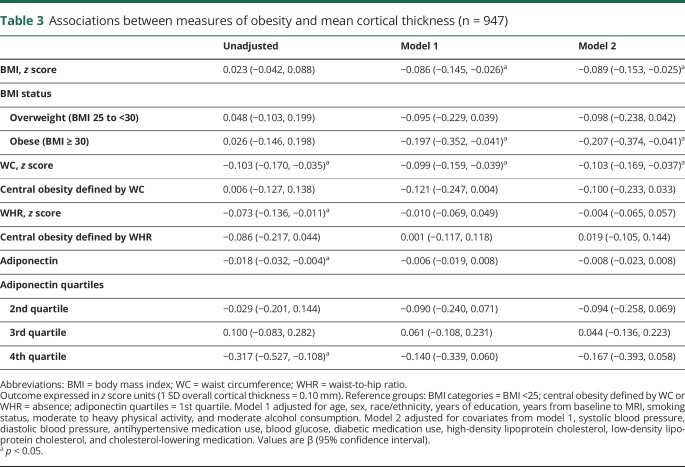
Sample characteristics at study entry stratified by BMI category are displayed in table 1. On average, participants were aged 64 years (SD 8 years) and had 10 years of education (SD 5 years). The majority of participants were women (60%) and Hispanic/Latino (66%). Main predictors as well as covariates were differentially distributed across BMI category groups (table 1). Compared to those without MRI data available, the sample with MRI data available had a greater proportion of participants who were overweight and in the lower quartiles of adiponectin concentration, as well as a lower proportion of participants with central obesity defined by WC and lower median adiponectin levels (table e-6, doi.org/10.5061/dryad.2ss22k3). Compared to those without cortical thickness data available, the sample with cortical thickness data available had slightly lower BMI, WC, and WHR, as well as a lower proportion of obese participants defined by BMI, WC, and WHR, and participants in the lower quartiles of adiponectin concentration (table e-7, doi.org/10.5061/dryad.2ss22k3). Similar patterns were observed when comparing those recruited from the original NOMAS cohort to household members recruited at MRI (table e-8, doi.org/10.5061/dryad.2ss22k3).
Table 1.
Sample characteristics, overall and stratified by body mass index (BMI) categories
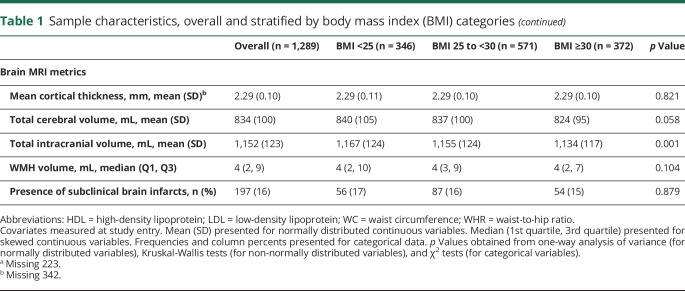
Associations between measures of obesity and TCV are presented in table 2. Greater BMI was associated with smaller TCV (model 1, β [95% CI] −0.024 [−0.046, −0.001]). The strength of this association remained consistent after adjustment for vascular risk factors, though this became null (table 2, model 2). Greater WC was also associated with smaller TCV (model 1, β [95% CI] −0.022 [−0.044, 0.000]). The strength of this association remained consistent after adjustment for vascular risk factors, though the association became null (table 2, model 2). Relative to the 1st quartile of adiponectin concentration, those with adiponectin concentrations in the 2nd quartile exhibited greater TCV (model 1, β [95% CI] 0.063 [0.001, 0.125]). The strength of this association remained similar after adjustment for vascular risk factors (table 2, model 2). Linear associations between TCV and other obesity markers did not reach statistical significance in adjusted models (table 2).
Table 2.
Associations between measures of obesity and total cerebral volume (n = 1,289)
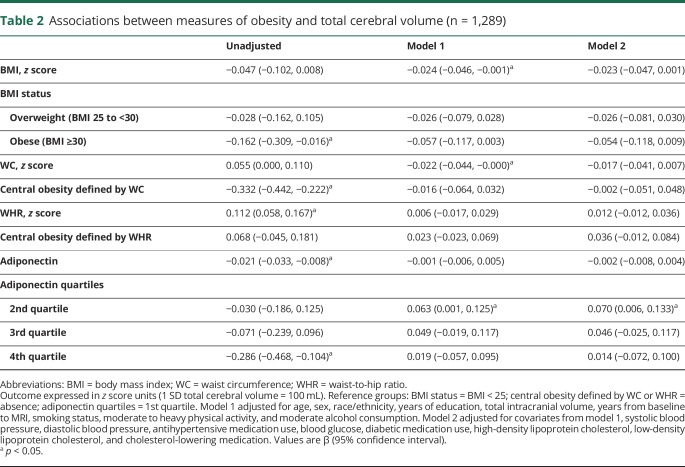
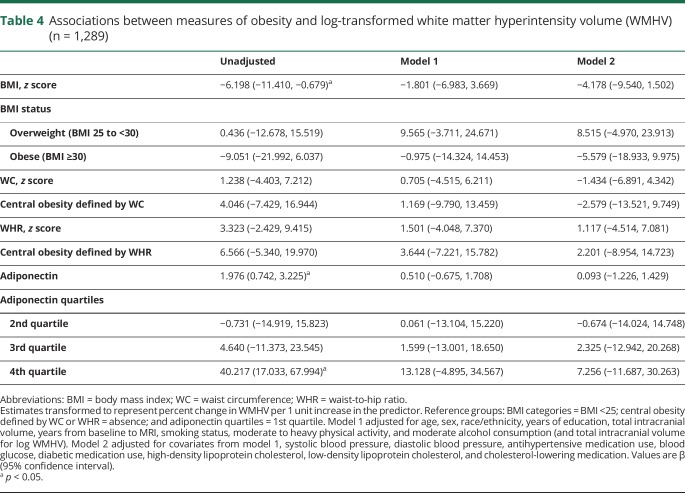
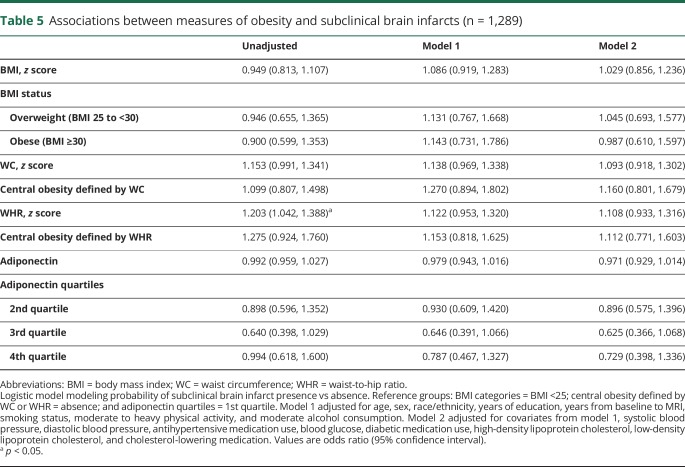
Associations between measures of obesity and cortical thickness are presented in table 3. Greater BMI was associated with a thinner cortex (model 1, β [95% CI] −0.086 [−0.145, −0.026]). The strength of this association remained consistent after adjustment for vascular risk factors (table 3, model 2). In addition, obese status (BMI ≥30) was associated with smaller cortical thickness (model 1, β [95% CI] −0.197 [−0.352, −0.041]). The strength of this association remained similar after adjustment for vascular risk factors (table 3, model 2). Greater WC was also associated with a thinner cortex (model 1, β [95% CI] −0.099 [−0.159, −0.039]). The strength of this association remained similar after adjustment for vascular risk factors (table 3, model 2). Associations between cortical thickness and other obesity markers did not reach statistical significance in adjusted models (table 3). Similarly, associations of obesity measures with log WMHV in linear or quantile regression models or with subclinical brain infarcts in logistic models were largely null (tables 4 and (5 and table e-9, doi.org/10.5061/dryad.2ss22k3).
Table 3.
Associations between measures of obesity and mean cortical thickness (n = 947)
Table 4.
Associations between measures of obesity and log-transformed white matter hyperintensity volume (WMHV) (n = 1,289)
Table 5.
Associations between measures of obesity and subclinical brain infarcts (n = 1,289)
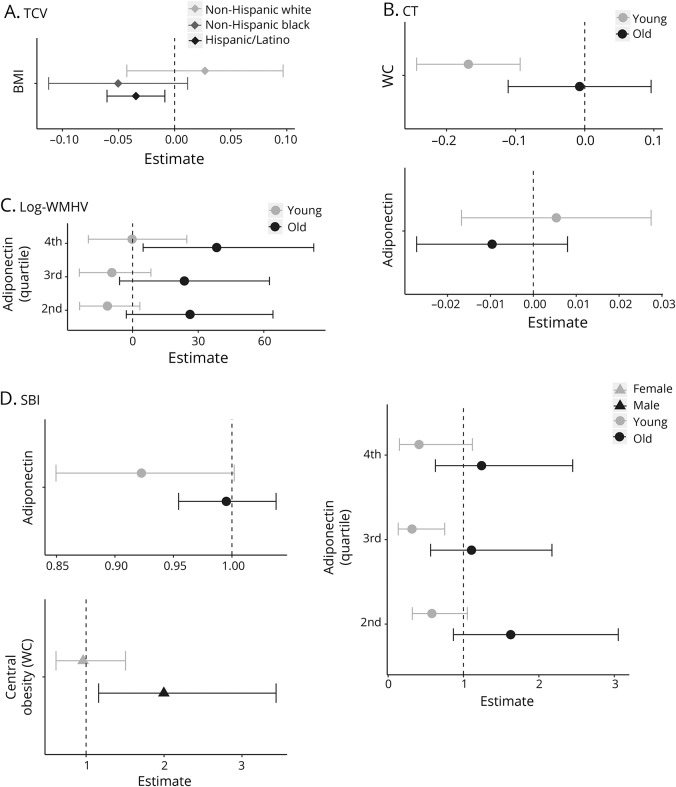
Figure 1 illustrates associations stratified by race/ethnicity, age, and sex. The association between BMI and TCV differed across racial/ethnic groups. In stratified analyses (figure 1A), greater BMI was related to lower TCV among Hispanic/Latino participants (β [95% CI] −0.034 [−0.060, −0.009]). Associations for non-Hispanic black and white participants were null, though a similar effect estimate was observed was observed for non-Hispanic black participants (β [95% CI] −0.050 [−0.112, 0.012]).
Figure 1. Stratified analyses for total cerebral volume (TCV), cortical thickness (CT), log white matter hyperintensity volume (WMHV), and subclinical brain infarcts (SBI).
(A) TCV. (B) CT. (C) Log WMHV. (D). SBI. Stratified analyses conducted when 2-way multiplicative interaction term p value ≤0.05. Points represent β coefficients from multivariable linear regression models or odds ratios from logistic regression models. Models adjusted for covariates from model 1: age, sex, race/ethnicity (except for TCV), years of education, total intracranial volume (for TCV and log WMHV), years from baseline to MRI, smoking status, moderate to heavy physical activity, and moderate alcohol consumption. Young = age <65, old = age ≥65. Dotted line represents the null value. Log WMHV: estimates transformed such that one unit increase in predictor is associated with percent change in WMHV. WC = waist circumference.
Associations between WC and adiponectin and cortical thickness differed across age groups (figure 1B). Similarly, associations between adiponectin quartiles, log WMHV, and SBI also differed by age (figure 1, C and D). Among younger participants (aged <65 years, figure 1B), greater WC was related to thinner cortices (β [95% CI] −0.168 [−0.243, −0.093]). Among older participants (aged ≥65 years), WC was not strongly related to cortical thickness (β [95% CI] −0.007 [−0.111, 0.096]). For both WMHV and SBI, estimates for adiponectin suggested opposite effects in young vs old participants, but these associations were largely null (figure 1, B and C). Associations with WC and SBI also differed by sex (figure 1D). Among men, greater central obesity defined by WC was related to greater odds of SBI (OR [95% CI] 1.998 [1.161, 3.437]), but this was not observed for women (OR [95% CI] 0.962 [0.614, 1.507]).
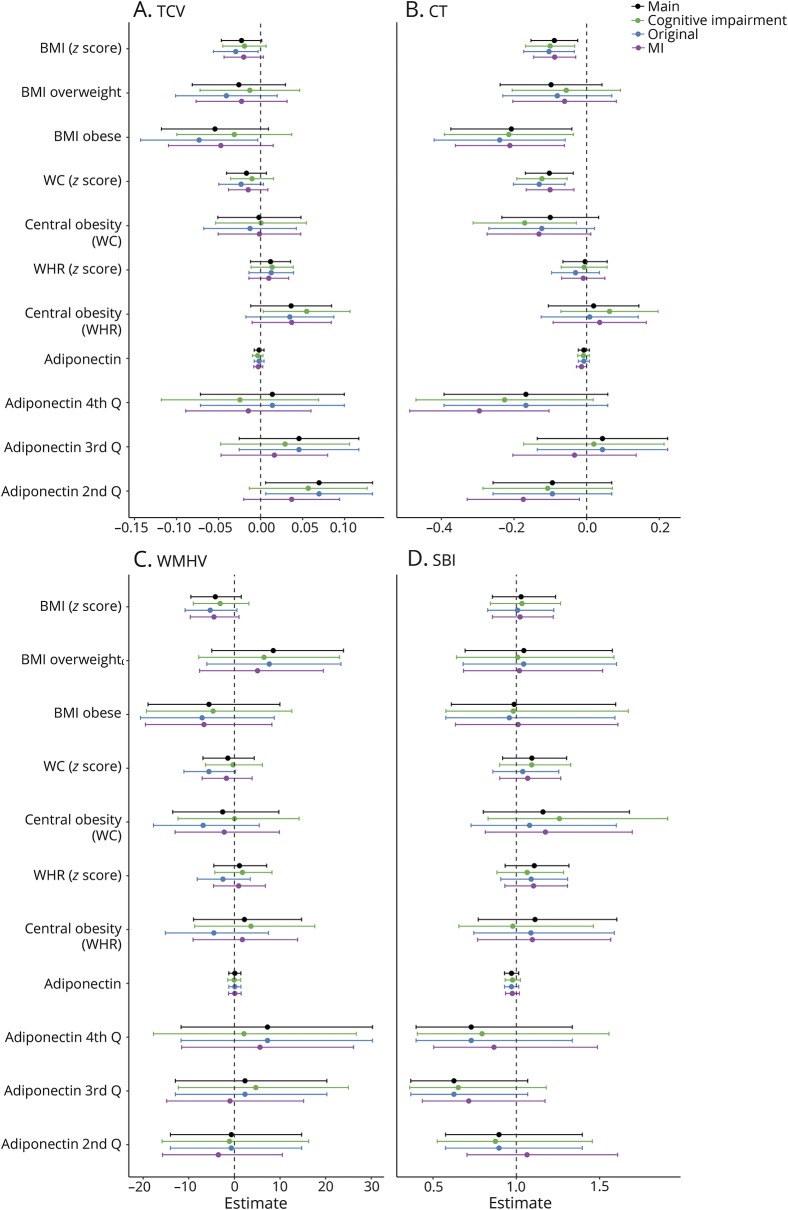
Finally, sensitivity analyses conducted among those cognitively unimpaired, original cohort members, and in 10 multiply imputed datasets yielded largely similar estimates and inferences as the fully adjusted main models (figure 2).
Figure 2. Sensitivity analyses.
(A) Total cerebral volume (TCV). (B) Cortical thickness (CT). (C) White matter hyperintensity volume (WMHV). (D). Subclinical brain infarct (SBI). Points represent β coefficients from multivariable linear regression models or odds ratios from logistic regression models (for SBI). Models adjusted for covariates from model 2: age, sex, race/ethnicity, education, years from baseline to MRI, total intracranial volume (for TCV and WMHV), smoking status, moderate to heavy physical activity, moderate alcohol consumption, systolic blood pressure, diastolic blood pressure, antihypertensive medication use, blood glucose, diabetic medication use, high-density lipoprotein cholesterol, low-density lipoprotein cholesterol, and cholesterol-lowering medication. For WMHV, estimates transformed to represent percent change in WMHV per 1 unit increase in the predictor. Green = subsample of those cognitively unimpaired (n = 1,087). Blue = subsample of original Northern Manhattan Study cohort members (n = 1,090). Purple = analyses conducted in ×10 multiply imputed datasets. BMI = body mass index; WC = waist circumference; MI = myocardial infarction; WHR = waist-to-hip ratio.
Discussion
In this racially and ethnically diverse urban cohort, greater BMI and WC were most strongly associated with cortical thinning, consistent with our original hypothesis. To a lesser extent, greater BMI and WC, as well as lower adiponectin levels, were related to smaller cerebral volumes. In contrast to our original hypothesis, measures of cerebral small vessel disease were not related to obesity. Finally, associations also varied in strength by age, sex, and race/ethnicity, but these findings should be confirmed in larger studies with greater power to detect effect modification. Taken together, these data support the inclusion of weight status as a part of the American Heart Association/American Stroke Association definition of optimal brain health1 and imply that obesity, especially in those <65 years of age and in Hispanic/Latino patients, may damage gray matter structure specifically.
Our results with TCV are concordant with previous studies reporting that greater weight and central adiposity are associated with smaller brain volumes.7,10–12 However, others have reported opposite associations,4,5 consistent with the notion that weight loss may precede dementia onset.41 Though null, estimates remained similar to the sociodemographic-adjusted model after adjustment for vascular risk factors, implying that these factors did not strongly mediate this association. We also found that these associations were stronger in Hispanic/Latino participants, which is consistent with the increased burden of obesity in this group.15 A similar pattern was observed in non-Hispanic black participants, though this did not reach statistical significance; these findings should be replicated in larger studies with greater power to detect effect modification by race/ethnicity. In addition, we found weak associations between adiponectin and TCV, and current data on adiponectin and TCV are limited. Though previous work has shown that adiponectin is associated with hippocampal volume,13 more work is warranted to elucidate the association with TCV and evaluate whether adiponectin can act as a viable biomarker of brain injury.
The literature on obesity markers and cortical thickness in large, epidemiologic studies is limited, and data from the present study contribute to this sparse literature. Consistent with our findings, some studies report that greater BMI and central adiposity are associated with cortical thinning.20,21,23 Yet others have found the opposite or U-shaped associations.19,22,23 In addition, current data on adiponectin and cortical thickness are limited, but one other study also yielded null associations, consistent with our main findings.13 Finally, our stratified analyses suggest that these associations are especially pronounced in those aged <65 years (i.e., early-old age), consistent with the hypothesis that midlife exposure to poor cardiometabolic health increases risk for detrimental brain aging in late life.10
Contrary to our hypothesis, measures of obesity were not strongly related to markers of cerebral small vessel disease. Estimates for WMHV were inconsistent in direction, and CIs were wide. Estimates for SBIs were more consistent and implied that obesity is associated with greater odds of SBI. However, these results were largely null, and thus should be interpreted with caution. Several studies have found that greater BMI, visceral fat, and central adiposity are associated with greater cerebral small vessel disease burden.6,8,9 Similar to the literature on gray matter metrics, there is also evidence of a paradoxical association between obesity and cerebral small vessel disease.4,5,7 Adjustment for cardiovascular risk factors did indeed change the strength of some associations with WMHV, which implies strong confounding or mediation from these risk factors. In addition, age and sex modified these associations, such that those aged <65 had lesser odds of SBI with greater adiponectin, and men had greater odds of SBI with greater WC compared to women. Further work in larger samples is warranted to confirm these associations.
Differences in findings between cortical thickness and TCV suggest that the detrimental effects of obesity may be more important for gray matter compared to white matter, since TCV includes white matter, and associations with measures of cerebral small vessel disease were largely null. Alternatively, the stronger associations observed for cortical thickness compared to TCV may also reflect residual confounding by cortical surface area.16,17 In the context of the radial unit hypothesis,42 cortical thickness has been posited to reflect the number of cells within a column compared to surface area, which reflects the number of columns, thus representing biologically distinct entities.17 Since the calculation of cerebral volume takes both surface area and thickness into account, it represents a combination of 2 important features of cerebral architecture.17 Taken together, this study suggests that obesity is particularly relevant for global gray matter structure, especially among those in early-old age.
There are several mechanisms by which obesity may affect gray matter structure. First, obesity is associated with comorbid hypertension, diabetes, and hyperlipidemia, which are known determinants of poor brain health.2 However, our results are independent of these risk factors, as they were included in our models as covariates. Second, the chronic inflammatory state caused by obesity could also affect neuroinflammatory processes that contribute to neurodegeneration.43 We examined this by adding inflammatory marker variables to the model, and estimates and inferences were relatively unchanged (data not shown). However, we had limited availability of inflammatory markers within this analytic sample, and thus may have reduced power to detect associations. In addition, though we examined one adipocytokine (adiponectin) and found largely null results, others may be more important mediators of these associations and should be examined in future studies. Finally, obesity is known to drive metabolic changes, such as increased insulin resistance, that also affect cortical hypometabolism, consistent with data suggesting that atrophy and hypometabolism occur close together in the temporal sequence of the Alzheimer disease course.44
Though our data support the notion that obesity is a risk factor, some evidence suggests that underweight is related to cortical atrophy,4,5,22 reflecting that weight loss may characterize the dementia prodrome.41 The timing of weight measurement in the life course is an important determinant of whether overweight or underweight is related to worse brain health.41 Given our lack of repeated measures of weight, we were unable to test whether weight trajectories would be related to our MRI markers of interest. However, this obesity paradox should be further explored, since growing evidence suggests that midlife risk factors are important determinants of cognitive health10 and weight loss may precede dementia onset.41 In addition, reverse causation may also explain these paradoxical results.45 Our sensitivity analyses in those who were cognitively unimpaired suggest that reverse causation did not substantially affect our findings.
Paradoxically, we found associations with WC but not with WHR, which may reflect differences in what is measured by these metrics. Arguably, WC is more directly linked to the measurement of visceral fat compared to WHR, which might be confounded by height and muscle mass.46 The confounding of WHR by height is also relevant to brain aging outcomes because height is a correlate of early-life health and determinant of cognitive decline and dementia.47 Finally, changes in weight do not necessarily translate to changes in WHR. Therefore, our results may more specifically reflect associations between visceral fat and cortical structure.
Limitations of this study should be noted. First, as in many aging cohorts, survival bias could underestimate the associations of interest. Our sensitivity analyses suggest that our estimates may be underestimated. Second, missingness of data due to measurement of certain predictors and outcomes in subsamples may also bias our estimates. In our sensitivity analyses using multiple imputation, estimates and inferences were largely unchanged. Third, the sampling of the MRI Sub-Study, especially introduction of the household members, could have introduced a healthy cohort bias into our estimates and underestimated our associations. Our sensitivity analysis in the subsample of original cohort members yielded similar estimates and inferences as our main analyses. Fourth, this analysis is cross-sectional, and thus causality cannot be inferred from these analyses. Fifth, though we tested for modification by important sociodemographic factors, these results should be interpreted with caution and considered hypothesis-generating. Studies with greater power to detect subgroup associations should be conducted to confirm the observed associations. Finally, as in most epidemiologic studies, residual and unmeasured confounding may be present.
Overall, this is among the largest studies to examine several measures of obesity with MRI metrics of brain aging and also represents data from an urban race–ethnic diverse population. Greater BMI, obesity, and greater WC are related to reduced gray matter in this sample. Future studies are warranted to elucidate the causal relationships as well as to explore associations with the specific brain regions.
Acknowledgment
The authors thank the Northern Manhattan Study Project Manager, Janet De Rosa, MPH.
Glossary
- BMI
body mass index
- CDC
Centers for Disease Control and Prevention
- CI
confidence interval
- HDL
high-density lipoprotein
- LDL
low-density lipoprotein
- NOMAS
Northern Manhattan Study
- OR
odds ratio
- SBI
subclinical brain infarct
- TCV
total cerebral volume
- TIV
total intracranial volume
- WC
waist circumference
- WHR
waist-to-hip ratio
- WMHV
white matter hyperintensity volume
Appendix. Authors


Footnotes
CME Course: NPub.org/cmelist
Study funding
This work was funded by NINDS (R01NS29993, F30NS103462) and the Evelyn F. McKnight Brain Institute.
Disclosure
M. Caunca, H. Gardener, M. Simonetto, Y. Cheung, N. Alperin, and M. Yoshita report no disclosures relevant to the manuscript. C. DeCarli serves as a consultant for Novartis Pharmaceuticals. M. Elkind receives compensation for providing consultative services for BioTelemetry/Cardionet, Bristol-Myers Squibb–Pfizer Partnership, Boehringer Ingelheim, Daiichi-Sankyo, Janssen Pharmaceuticals, and Sanofi-Regeneron Partnership; receives research support from diaDexus, Inc., Bristol-Myers Squibb/Sanofi Pharmaceuticals Partnership, and the NIH/National Institute of Neurological Disorders and Stroke; has given expert legal opinions on behalf of Organon (NuvaRing and stroke litigation) and Hi-Tech; and serves on the National, Founders Affiliate, and New York City Chapter Boards of the American Heart Association/American Stroke Association. He receives royalties from UpToDate for chapters related to stroke. R. Sacco receives federal grant support (R01 NS 29993, CTSA UL1 TR002736), private foundation support (American Heart Association Bugher Center), and pharma research support (Boehringer Ingelheim). C. Wright receives royalties for 2 chapters on vascular dementia from UpToDate. T. Rundek reports no disclosures relevant to the manuscript. Go to Neurology.org/N for full disclosures.
References
- 1.Gorelick PB, Furie KL, Iadecola C, et al. Defining optimal brain health in adults: a presidential advisory from the American Heart Association/American Stroke Association. Stroke 2017;48:e284–e303. [DOI] [PMC free article] [PubMed] [Google Scholar]
- 2.Gardener H, Wright CB, Rundek T, Sacco RL. Brain health and shared risk factors for dementia and stroke. Nat Rev Neurol 2015;11:651–657. [DOI] [PubMed] [Google Scholar]
- 3.Letra L, Santana I, Seiça R. Obesity as a risk factor for Alzheimer's disease: the role of adipocytokines. Metab Brain Dis 2014;29:563–568. [DOI] [PubMed] [Google Scholar]
- 4.Albanese E, Davis B, Jonsson PV, et al. Overweight and obesity in midlife and brain structure and dementia 26 years later: the AGES-Reykjavik study. Am J Epidemiol 2015;181:672–679. [DOI] [PMC free article] [PubMed] [Google Scholar]
- 5.Driscoll I, Gaussoin SA, Wassertheil-Smoller S, et al. Obesity and structural brain integrity in older women: the Women's Health Initiative Magnetic Resonance Imaging Study. J Gerontol A Biol Sci Med Sci 2016;71:1216–1222. [DOI] [PMC free article] [PubMed] [Google Scholar]
- 6.Kim KW, Seo H, Kwak MS, Kim D. Visceral obesity is associated with white matter hyperintensity and lacunar infarct. Int J Obes 2017;41:683–688. [DOI] [PubMed] [Google Scholar]
- 7.Windham BG, Lirette ST, Fornage M, et al. Associations of brain structure with adiposity and changes in adiposity in a middle-aged and older biracial population. J Gerontol A Biol Sci Med Sci 2017;72:825–831. [DOI] [PMC free article] [PubMed] [Google Scholar]
- 8.Dearborn JL, Schneider ALC, Sharrett AR, et al. Obesity, insulin resistance, and incident small vessel disease on magnetic resonance imaging: atherosclerosis risk in communities study. Stroke 2015;46:3131–3136. [DOI] [PMC free article] [PubMed] [Google Scholar]
- 9.Repple J, Opel N, Meinert S, et al. Elevated body-mass index is associated with reduced white matter integrity in two large independent cohorts. Psychoneuroendocrinology 2018;91:179–185. [DOI] [PubMed] [Google Scholar]
- 10.Debette S, Seshadri S, Beiser A, et al. Midlife vascular risk factor exposure accelerates structural brain aging and cognitive decline. Neurology 2011;77:461–468. [DOI] [PMC free article] [PubMed] [Google Scholar]
- 11.Debette S, Wolf C, Lambert JC, et al. Abdominal obesity and lower gray matter volume: a Mendelian randomization study. Neurobiol Aging 2014;35:378–386. [DOI] [PubMed] [Google Scholar]
- 12.Brooks SJ, Benedict C, Burgos J, et al. Late-life obesity is associated with smaller global and regional gray matter volumes: a voxel-based morphometric study. Int J Obes 2013;37:230–236. [DOI] [PMC free article] [PubMed] [Google Scholar]
- 13.Wennberg AM, Gustafson D, Hagen CE, et al. Serum adiponectin levels, neuroimaging, and cognition in the Mayo clinic study of aging. J Alzheimers Dis 2016;53:573–581. [DOI] [PMC free article] [PubMed] [Google Scholar]
- 14.Mayeda ER, Glymour MM, Quesenberry CP, Whitmer RA. Inequalities in dementia incidence between six racial and ethnic groups over 14 years. Alzheimers Dement 2016;12:216–224. [DOI] [PMC free article] [PubMed] [Google Scholar]
- 15.Hales CM, Carroll MD, Fryar CD, Ogden CL. Prevalence of obesity among adults and youth: United States, 2015-2016. NCHS Data Brief 2017;1–8. [PubMed] [Google Scholar]
- 16.Schwarz CG, Gunter JL, Wiste HJ, et al. A large-scale comparison of cortical thickness and volume methods for measuring Alzheimer's disease severity. NeuroImage Clin 2016;11:802–812. [DOI] [PMC free article] [PubMed] [Google Scholar]
- 17.Panizzon MS, Fennema-Notestine C, Eyler LT, et al. Distinct genetic influences on cortical surface area and cortical thickness. Cereb Cortex 2009;19:2728–2735. [DOI] [PMC free article] [PubMed] [Google Scholar]
- 18.Schwarz NF, Nordstrom LK, Pagen LHG, et al. Differential associations of metabolic risk factors on cortical thickness in metabolic syndrome. NeuroImage Clin 2018;17:98–108. [DOI] [PMC free article] [PubMed] [Google Scholar]
- 19.Kaur S, Gonzales MM, Strasser B, et al. Central adiposity and cortical thickness in midlife. Psychosom Med 2015;77:671–678. [DOI] [PubMed] [Google Scholar]
- 20.Shaw ME, Sachdev PS, Abhayaratna W, Anstey KJ, Cherbuin N. Body mass index is associated with cortical thinning with different patterns in mid- and late-life. Int J Obes 2017;42:455–461. [DOI] [PubMed] [Google Scholar]
- 21.Shaw ME, Abhayaratna WP, Anstey KJ, Cherbuin N. Increasing body mass index at midlife is associated with increased cortical thinning in Alzheimer's disease-vulnerable regions. J Alzheimers Dis 2017;59:113–120. [DOI] [PubMed] [Google Scholar]
- 22.Kim H, Kim C, Seo SW, et al. Association between body mass index and cortical thickness: among elderly cognitively normal men and women. Int Psychogeriatrics 2015;27:121–130. [DOI] [PubMed] [Google Scholar]
- 23.Kim HJ, Kim C, Jeon S, et al. Association of body fat percentage and waist-hip ratio with brain cortical thickness: a study among 1777 cognitively normal subjects. Alzheimer Dis Assoc Disord 2015;29:279–286. [DOI] [PubMed] [Google Scholar]
- 24.Sacco RL, Anand K, Lee HS, et al. Homocysteine and the risk of ischemic stroke in a triethnic cohort: the Northern Manhattan Study. Stroke 2004;35:2263–2269. [DOI] [PubMed] [Google Scholar]
- 25.Suk SH, Sacco RL, Boden-Albala B, et al. Abdominal obesity and risk of ischemic stroke: the Northern Manhattan Stroke Study. Stroke 2003;34:1586–1592. [DOI] [PubMed] [Google Scholar]
- 26.Centers for Disease Control and Prevention: Defining Adult Overweight and Obesity [online]. 2016. Available at: cdc.gov/obesity/adult/defining.html. Accessed February 15, 2018.
- 27.Grundy SM, Cleeman JI, Daniels SR, et al. Diagnosis and management of the metabolic syndrome: an American Heart Association/National Heart, Lung, and Blood Institute scientific statement. Circulation 2005;112:2735–2752. [DOI] [PubMed] [Google Scholar]
- 28.Waist Circumference and Waist–Hip Ratio: Report of a WHO Expert Consultation. Geneva: WHO; 2011. [Google Scholar]
- 29.Gardener H, Sjoberg C, Crisby M, et al. Adiponectin and carotid intima-media thickness in the Northern Manhattan Study. Stroke 2012;43:1123–1125. [DOI] [PMC free article] [PubMed] [Google Scholar]
- 30.Dong C, Nabizadeh N, Caunca M, et al. Cognitive correlates of white matter lesion load and brain atrophy: the Northern Manhattan Study. Neurology 2015;85:441–449. [DOI] [PMC free article] [PubMed] [Google Scholar]
- 31.Dale AM, Fischl B, Sereno MI. Cortical surface-based analysis: I: segmentation and surface reconstruction. Neuroimage 1999;9:179–194. [DOI] [PubMed] [Google Scholar]
- 32.Fischl B, Dale AM. Measuring the thickness of the human cerebral cortex from magnetic resonance images. Proc Natl Acad Sci USA 2000;97:11050–11055. [DOI] [PMC free article] [PubMed] [Google Scholar]
- 33.Prabhakaran S, Wright CB, Yoshita M, et al. Prevalence and determinants of subclinical brain infarction: the Northern Manhattan Study. Neurology 2008;70:425–430. [DOI] [PMC free article] [PubMed] [Google Scholar]
- 34.DeCarli C, Massaro J, Harvey D, et al. Measures of brain morphology and infarction in the Framingham Heart Study: establishing what is normal. Neurobiol Aging 2005;26:491–510. [DOI] [PubMed] [Google Scholar]
- 35.Sacco RL, Gan R, Boden-Albala B, et al. Leisure-time physical activity and ischemic stroke risk: the Northern Manhattan Stroke Study. Stroke 1998;29:380–387. [DOI] [PubMed] [Google Scholar]
- 36.Elkind MS, Sciacca R, Boden-Albala B, Rundek T, Paik MC, Sacco RL. Moderate alcohol consumption reduces risk of ischemic stroke: the Northern Manhattan Study. Stroke 2006;37:13–19. [DOI] [PubMed] [Google Scholar]
- 37.UCLA: Statistical Consulting Group. How can I interpret log transformed variables in terms of percent change in linear regression? SAS FAQ [online]. Available at: stats.idre.ucla.edu/sas/faq/how-can-i-interpret-log-transformed-variables-in-terms-of-percent-change-in-linear-regression/. Accessed February 16, 2018.
- 38.O'Brien RM. A caution regarding rules of thumb for variance inflation factors. In: Qual Quant [online serial]. Springer Netherlands; 2007;41:673–690. Available at: link.springer.com/10.1007/s11135-006-9018-6. Accessed December 12, 2018. [Google Scholar]
- 39.Lee KJ, Carlin JB. Multiple imputation for missing data: fully conditional specification versus multivariate normal imputation. Am J Epidemiol 2010;171:624–632. [DOI] [PubMed] [Google Scholar]
- 40.Wickham H. ggplot2: Elegant Graphics for Data Analysis. New York: Springer-Verlag; 2009. [Google Scholar]
- 41.Singh-Manoux A, Dugravot A, Shipley M, et al. Obesity trajectories and risk of dementia: 28 years of follow-up in the Whitehall II Study. Alzheimers Dement 2018;14:178–186. [DOI] [PMC free article] [PubMed] [Google Scholar]
- 42.Rakic P. Specification of cerebral cortical areas. Science 1988;241:170–176. [DOI] [PubMed] [Google Scholar]
- 43.Heneka MT, Carson MJ, El Khoury J, et al. Neuroinflammation in Alzheimer's disease. Lancet Neurol 2015;14:388–405. [DOI] [PMC free article] [PubMed] [Google Scholar]
- 44.Jack CRJ, Knopman DS, Jagust WJ, et al. Tracking pathophysiological processes in Alzheimer's disease: an updated hypothetical model of dynamic biomarkers. Lancet Neurol 2013;12:207–216. [DOI] [PMC free article] [PubMed] [Google Scholar]
- 45.Kivimaki M, Luukkonen R, Batty GD, et al. Body mass index and risk of dementia: analysis of individual-level data from 1.3 million individuals. Alzheimers Dement 2018;14:601–609. [DOI] [PMC free article] [PubMed] [Google Scholar]
- 46.Dobbelsteyn CJ, Joffres MR, MacLean DR, Flowerdew G. A comparative evaluation of waist circumference, waist-to-hip ratio and body mass index as indicators of cardiovascular risk factors: the Canadian Heart Health Surveys. Int J Obes Relat Metab Disord 2001;25:652–661. [DOI] [PubMed] [Google Scholar]
- 47.Guven C, Lee WS. Height and cognitive function at older ages: is height a useful summary measure of early childhood experiences? Health Econ 2013;22:224–233. [DOI] [PubMed] [Google Scholar]
Associated Data
This section collects any data citations, data availability statements, or supplementary materials included in this article.
Data Availability Statement
Anonymized data not published within this article can be shared by request by any qualified investigator.


