Abstract
Objective
To identify heterogeneity in cognitive profiles of patients with probable Alzheimer disease (AD) who have mild to moderate dementia and satisfy inclusion and exclusion criteria for a typical AD clinical trial, and to determine whether cognitive profiles are systematically related to the clinical course and neuropathologic features of the disease.
Methods
Neuropsychological test data from patients with mild to moderate probable AD (n = 4,711) were obtained from the National Alzheimer's Coordinating Center. Inclusion and exclusion criteria usually used in AD clinical trials were applied. Principal component analysis and model-based clustering were used to identify cognitive profiles in a subset of patients with autopsy-verified AD (n = 800) and validated in the overall (nonautopsy) sample and an independent cohort with similar test data. Relationships between cognitive profile, clinical characteristics, and rate of decline were examined with mixed-effects models.
Results
In the autopsy-confirmed sample, 79.6% of patients had a typical AD cognitive profile (greater impairment of episodic memory than other cognitive functions), and 20.4% had an atypical profile (comparable impairment across cognitive domains). Similar results were obtained in the overall (typical 79.8%, atypical 20.2%) and validation (typical 71.8%, atypical 28.2%) samples. Atypicality was associated with younger age, male sex, lower probability of APOE ε4, less severe global dementia, higher depression scores, lower Braak stage at autopsy, and slower cognitive decline.
Conclusion
We can reliably identify distinct cognitive profiles among patients with clinically diagnosed probable AD that are associated with tangle pathology and with different rates of decline. This may have implications for clinical trials in AD, especially therapies targeting tau.
An important source of variability that may bias the results of therapeutic trials for Alzheimer disease (AD) is heterogeneity in the presentation and course of cognitive deficits that are expressed within its clinical syndrome. Although AD is most commonly characterized by initial predominant impairment in learning and memory, variants of AD with primary deficits in language (i.e., logopenic primary progressive aphasia), visuospatial abilities (i.e., posterior cortical atrophy), or executive functions (i.e., executive variant AD) with relative sparing of memory have been identified.1–10 The use of best practices for assessment of dementia11 and standardized clinical criteria for the diagnosis of AD dementia12–14 allow many of these variants to be identified, and patients with these variants are usually excluded from AD clinical trials because they are likely to progress in an atypical fashion and have predominant deficits that are not sensitively measured by widely used clinical trial cognitive outcome measures. AD trial cohorts often are further restricted to patients with mild to moderate dementia severity to ensure sufficient range to measure change over time. While these inclusion criteria provide a relatively homogeneous sample, the relative degree of impairment in memory vs other cognitive abilities may still vary in a systematic manner that can be identified and considered in the analysis and interpretation of AD clinical trial results. Therefore, the present study investigates cognitive heterogeneity in patients with probable AD with mild to moderate dementia who satisfy the inclusion and exclusion criteria of a typical AD clinical trial and whether cognitive profiles are systematically related to the clinical course and neuropathologic features of the disease.
Methods
Participants
Data from participants in the NIH Alzheimer's Disease Centers program were downloaded from the National Alzheimer's Coordinating Center (NACC) database as of the September 2017 data freeze. Sample 1 consisted of 4,711 participants diagnosed between 2005 and 2015 who met National Institute of Neurological and Communicative Disorders and Stroke–Alzheimer's Disease and Related Disorders Association diagnostic criteria for probable AD,15 scored 16 to 24 (inclusive) on the Mini-Mental State Examination (MMSE), and had neuropsychological test data available. Sample 2 consisted of 692 participants enrolled after March 2015 (when NACC Uniform Data Set [UDS] version 3 was implemented and some study procedures were changed) who met National Institute on Aging–Alzheimer’s Association diagnostic criteria for probable AD dementia,12 scored 7 to 19 (inclusive) on the Montreal Cognitive Assessment (MoCA), and had neuropsychological test data available. A MoCA range of 7 to 19 is equivalent to an MMSE range of 16 to 24,16 and both ranges are indicative of mild to moderate dementia severity. Participants were not included in either sample if they had a clinical diagnosis of primary progressive aphasia, posterior cortical atrophy, frontotemporal dementia, Parkinson disease, corticobasal syndrome, dementia with Lewy bodies (DLB), cerebrovascular disease (CVD), prion disease, traumatic brain injury, normal pressure hydrocephalus, or other neurologic disease contributing to the cognitive impairment. Clinical data from the UDS visit at which a participant was initially diagnosed with probable AD dementia were used in analyses.
Procedure
At each approximately annual visit, participants received a standardized dementia evaluation17 that included medical and family history, physical and neurologic examination, neuropsychological testing, functional assessment with the Clinical Dementia Rating (CDR) scale18 and Functional Assessment Questionnaire (FAQ),19 and assessment of depressive symptomology with the Geriatric Depression Scale (GDS).20 A categorical decision of whether depression was contributing to cognitive dysfunction was also made according to a clinician's judgment.
Neuropsychological measures
The NACC neuropsychological test battery administered from 2005 to 2015 (UDS version 2) consisted of the MMSE and measures of verbal learning and memory (Logical Memory Test [story A only] I and II), attention and executive function (Digit Span Forward and Digit Span Backward; Trail-Making A and B; Digit Symbol Substitution), and language/semantic memory (30-item Boston Naming Test, Animal Fluency).21 In March 2015, the NACC protocol (UDS version 3) replaced several tests with comparable nonproprietary measures and added 3 tests to broaden the scope of the battery. Details of the revised battery and demonstration of its comparability to the original are described elsewhere.16,22
Neuropathologic diagnosis
Neuropathologic findings were available for 976 participants from sample 1. Diagnostic classification was based on Braak staging of neurofibrillary tangles23 and Consortium to Establish a Registry for Alzheimer’s Disease (CERAD) scoring of neocortical neuritic plaque density.24 Definite AD was defined as Braak stage III to VI plus moderate or frequent neocortical plaques. With these criteria, the UDS clinical diagnosis of probable AD has been shown to have ≈71% sensitivity and specificity and 83% positive predictive value.25 Other pathologic diagnoses such as frontotemporal lobar degeneration (FTLD; Picks, corticobasal ganglionic degeneration, progressive supranuclear palsy), DLB, and CVD (e.g., infarct, lacune, hemorrhage, microbleed, microinfarct) were made according to standard published criteria.
Statistical methods
Data from sample 1 were used to identify potential cognitive subtypes and to investigate their association with clinical features, rate of decline, and pathologic findings. Data from sample 2 were used to investigate whether the subtypes identified from sample 1 would replicate in an independent sample with potentially different baseline characteristics and similar, but not identical, neuropsychological test measures. Neuropsychological test scores were standardized within each sample, and all measures were coded so that a higher test score indicated better performance. Because time-to-completion scores on the Trail-Making Test were truncated (maximum time 150 seconds for part A and 300 seconds for part B), a rate measure was calculated by dividing the number of correct lines drawn by testing time. Computations used R26 version 3.4.1.
Identifying and validating AD cognitive subgroups
Principal component analysis (PCA; using the stats:princomp function) and model-based clustering (using the mclust package,27,28 allowing for different means and covariance structures with number of clusters determined by bayesian information criterion29) were used to identify characteristic patterns of performance on neuropsychological test scores within each sample. First, PCA was used to identify the linear combinations, or factor loadings, of the original test scores that best constructed 2 informative and independent components. Then, these first 2 principal component scores for each participant were used in model-based clustering to identify subgroups of participants with distinct patterns of test performance. Analyses initially were performed using sample 1 participants with definite AD pathology and then all of sample 1 (with restriction to 2 clusters); finally, analyses were repeated again using sample 2 as an independent validation cohort.
Characterizing AD cognitive subgroups
Linear regression was used to explore association between cluster membership (i.e., AD cognitive subtype) and demographic variables, clinical characteristics, global cognitive test scores, and neuropathologic features. AD pathology (Braak stage and CERAD plaque score) was coded as an ordinal factor.
Linear mixed-effects models were used to examine the association of AD cognitive subtype with the rate of longitudinal decline by investigating the interaction between time slope and subtype. Models controlled for baseline cognitive score and APOE genotype and included a random intercept and slope for each participant. Only the first 2 years of follow-up data were used in these analyses because of apparent informative censoring after 2 years (i.e., more severely impaired participants were more likely to discontinue). Similar analyses were used to investigate the stability of the AD cognitive subtype classification over time.
Missing data
Missing test scores in the UDS dataset are designated as missing due to cognitive problems, other noncognitive problems, or not collected at that assessment. For scores missing due to cognitive problems, we imputed the worst possible score for the measure. For scores missing due to noncognitive reasons, we imputed a score using linear regression with predictors age, education, MMSE or MoCA score, CDR Sum of Boxes score, and all available neuropsychological measures, computed in the R package mice.30
Standard protocol approvals, registrations, and patient consents
Written informed consents were obtained from participants at each Alzheimer's Disease Center (ADC) and approved by the ADC’s Institutional Review Board. Research using the NACC database was approved by the University of Washington Institutional Review Board.
Data availability policy
NACC has developed and maintains a large relational database of standardized clinical and neuropathologic research data collected from the National Institute on Aging–funded ADCs across the United States. NACC data are freely available to all researchers.
Results
Participant characteristics
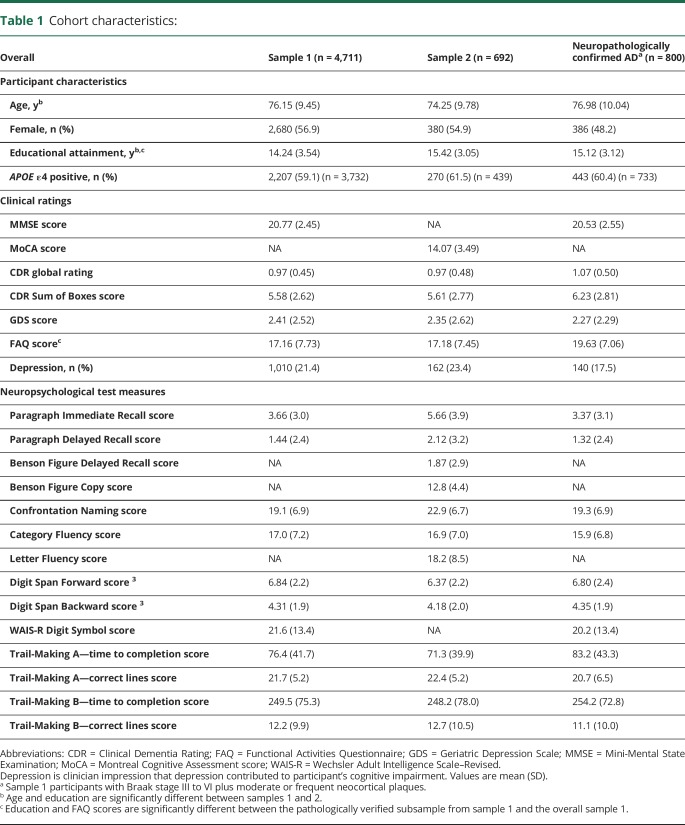
The pathologically verified subsample from sample 1 did not differ from the overall sample 1 in age, MMSE score, CDR global rating, GDS score, or percent APOE ε4 genotype but was more educated and had worse FAQ scores (table 1). Sample 2 did not differ from sample 1 in CDR global rating, FAQ score, GDS score, sex distribution, or percent APOE ε4 genotype but was younger and more educated.
Table 1.
Cohort characteristics:
PCA of neuropsychological tests
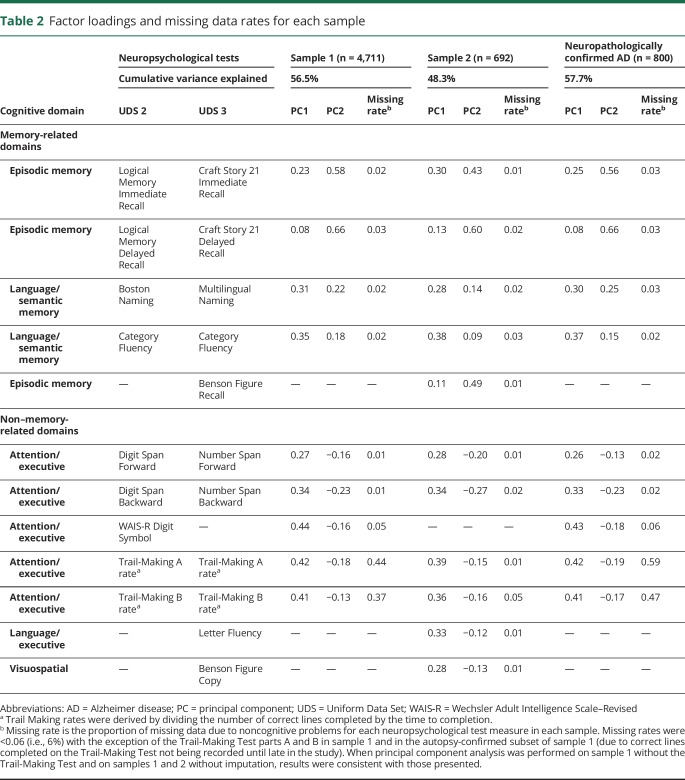
The results of the PCAs were consistent across sample 1 (the discovery dataset), the autopsy-confirmed subset of sample 1 (the gold standard dataset), and sample 2 (the independent validation dataset). Each PCA identified 2 independent, mean zero principal components that together explained 47% to 58% of variance. Factor loadings for each principal component were similar in the 3 analyses and were not sensitive to the imputation (table 2). The first principal component (PC1) had positive factor loadings for all neuropsychological tests, thus reflecting overall cognitive performance or dementia severity (i.e., a positive score for PC1 indicates above the mean on cognitive performance, and a negative score indicates below the mean). The second principal component (PC2) had positive factor loadings for neuropsychological tests of episodic memory and naming and negative factor loadings for nonmemory tests; thus, a higher PC2 score reflects relatively better performance on memory-related cognitive tests and relatively worse performance on non–memory-related tests. Therefore, PC2 can be interpreted as a continuous measure that discriminates between cognitive profiles within probable AD, independently of cognitive severity (i.e., PC1). This pattern of factor loadings for PC2 was reproduced in all 3 samples. Results were nearly identical in each sample after the exclusion of the ≈20% of participants for whom depression was considered to have contributed to the cognitive impairment. The correlation between factor loadings for PC2 computed separately from samples 1 and 2 (using only tests that were identical or analogous in both samples) was 0.99, indicating strong reproducibility. Thus, we conclude that ≈50% of the variance in UDS neuropsychological test scores in patients with probable AD is due jointly to overall cognitive severity and to the relative pattern of severity of memory vs nonmemory deficits. Furthermore, these 2 factors can be consistently measured across independent cohorts using standardized data from similar (although different) neuropsychological tests.
Table 2.
Factor loadings and missing data rates for each sample
Identification of subtypes of neuropsychological deficit patterns
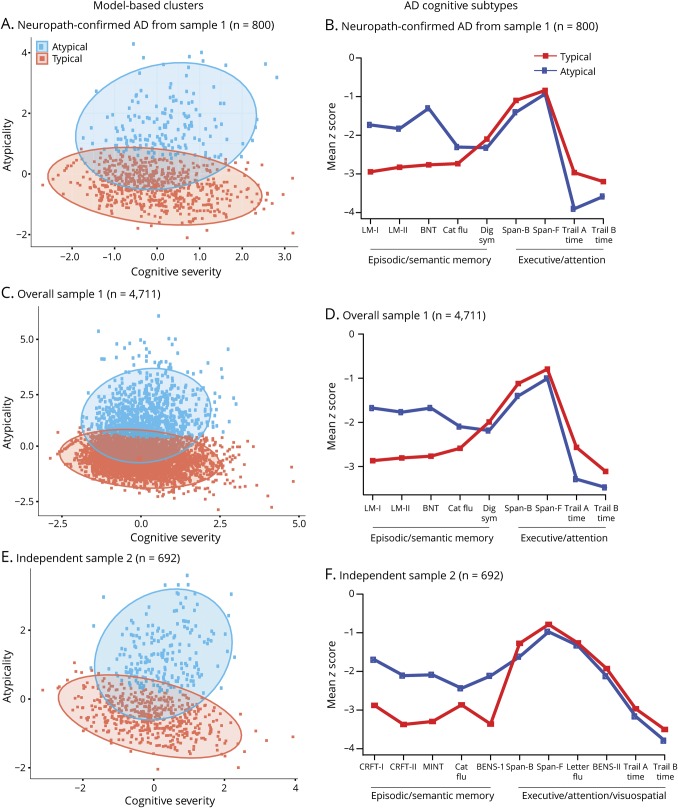
To identify subgroups with distinct neuropsychological profiles, model-based clustering was applied to the autopsy-verified subset of sample 1 (as the gold standard) using the derived factor scores for cognitive severity (PC1) and cognitive profile (PC2). Two clusters of participants were determined by the model (figure 1A): cluster 1 (n = 637, 79.6% of participants) was generally above the sample mean on the cognitive profile factor (PC2, mean 2.0) and nearly centered at the mean on cognitive severity (PC1, mean 0.3); and cluster 2 (n = 163, 20.4% of participants) was generally below the mean on the cognitive profile factor (mean −0.5) and nearly centered at the mean on cognitive severity (mean −0.08). Thus, the 2 clusters are separated by cognitive profile but are largely overlapping on cognitive severity. The ≈80% of participants in cluster 2 were thus classified as having a typical AD cognitive profile, while the remaining 20% of participants (cluster 1) were classified as having an atypical AD cognitive profile.
Figure 1. Results of model-based clustering and z scores on neuropsychological test measures.
Clustering results and z scores on neuropsychological test measures for participants from the neuropathologically confirmed subsample of (A and B) sample 1, (C and D) overall sample 1, and (E and F) independent sample 2. In panels A, C, and E, each ellipse is the estimated 95th percentile for each cluster (95% of the estimated population lies within this ellipse). In panels B, D, and F, test measures were grouped as episodic/semantic memory (left) and nonmemory (right) cognitive domains. Because normative data were not available to compute z scores for Trail-Making rate, time to completion is displayed. AD = Alzheimer disease; BENS-I = Benson Figure Delayed Recall; BENS-II = Benson Figure Copy; BNT = Boston Naming Test; CatFlu = Category Fluency; CRFT-I = Craft 21 Story Immediate Recall; CRFT-II = Craft 21 Story Delayed Recall; Dig sym = Wechsler Adult Intelligence Scale–Revised Digit Symbol; LM-I = Logical Memory Immediate Recall; LM-II = Logical Memory Delayed Recall; MINT = Multilingual Naming Test; Span-B = Digit Span Backward; Span-F = Digit Span Forward; Trail A Time = Trail-Making Test Part A—time to completion; Trail B Time = Trail-Making Test Part B—time to completion; Letter Flu = Letter Fluency.
When the same clustering procedure was applied to sample 1 (the entire sample) and the number of clusters was set at 2 (based on results from the autopsy-verified subset), similar clusters were observed, and a similar proportion of typical (n = 3,761, 79.8%) vs atypical (n = 950, 20.2%) classification was obtained (figure 1C). An analysis without predetermining the number of clusters gave similar results but further split the 2 main clusters into subclusters. When the identical clustering procedure was applied to sample 2, 2 clusters (typical and atypical) were again identified, with similar characteristics (typical n = 497, 71.8% of sample vs atypical n = 195, 28.2% of sample; figure 1E).
To further explore the consistency of the classification procedure across different cohorts, we applied the sample 1 classification rule to the PC scores identified from participants in sample 2 and investigated whether the sample 1–based rule and the sample 2–based classification agreed in their assignment to a typical or atypical AD cognitive profile. The agreement rate was 94.7%: all 497 typical sample 2 participants (as shown in figure 1E) were also called typical with the sample 1–determined rule; of the 195 atypical sample 2 participants, 37 were misclassified as typical with the sample 1 rule. For completeness, the classification rules from samples 1 and 2 are given below, and the R code to compute these assignments from the underlying raw neuropsychological test scores is available on the Alzheimer's Disease Cooperative Study website (data-archive.adcs.ucsd.edu).
The classification rule is given by:
 |
we classify Y as typical; otherwise, we classify it as atypical. Here, X is the pair of scores (PC1, PC2) for the participant, computed from the standardized neuropsychological test scores with the factor loadings given in table 2 and standardized with the data in table 1, and  and
and  are 2-dimensional normal densities with
 for typical AD and atypical AD in sample 1. In sample 1,
  is 0.72 and
  is 0.28; these are the estimated proportions from the model for typical AD and atypical AD. In sample 2,
  is 0.65 and
  is 0.35, and
  .
.
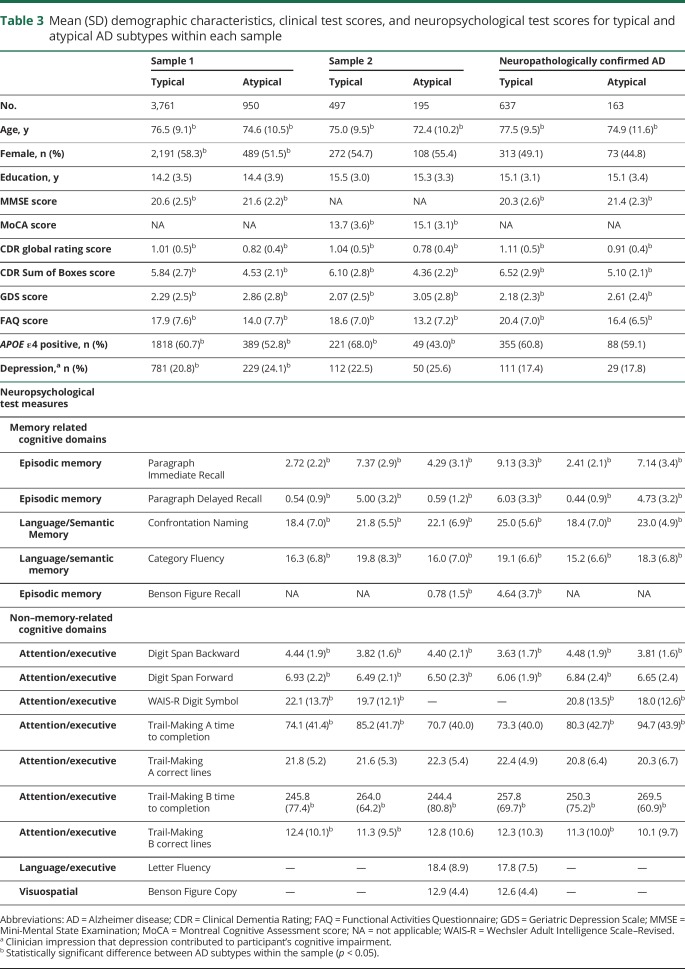
Mean differences in the individual neuropsychological test scores for the typical and atypical AD subtypes are illustrated graphically in figure 1, B, D, and F. Raw test scores are scaled to z scores based on normative data from ≈3,600 cognitively normal UDS participants.21,22 Atypical participants had better performance than typical participants on episodic and semantic memory measures on average but slightly worse performance on measures of attention and executive function. Table 3 compares demographic features and clinical and neuropsychological test scores for typical and atypical participants within each of the 3 datasets.
Table 3.
Mean (SD) demographic characteristics, clinical test scores, and neuropsychological test scores for typical and atypical AD subtypes within each sample
Demographic and clinical characteristics of neuropsychological subtypes
Univariate linear models showed that higher scores on PC2 (i.e., a higher measure of atypicality in cognitive profile) are significantly associated with younger age, male sex, lower probability of APOE ε4, less severe global dementia, higher GDS scores, and greater likelihood that the clinician believes depression contributes to cognitive impairment (all p < 0.001). A multivariate linear regression model (omitting clinician-rated depression because of collinearity with GDS score) showed that all variables significant in the univariate models remained significantly associated with atypicality, with similar effect sizes.
Neuropathologic characteristics of neuropsychological subtypes
Approximately 82% (800 of 976) of individuals diagnosed with probable AD in sample 1 met neuropathologic criteria for AD at autopsy. The 176 misdiagnosed cases included 14 with FTLD, 49 with DLB, 62 with CVD, and 56 with low levels of AD pathology that did not reach diagnostic thresholds. Cognitive profile classification of these individuals was as follows: FTLD 78.6% typical (11 typical, 3 atypical), DLB 55.1% typical (27 typical, 22 atypical), CVD 69.3% typical (43 typical, 19 atypical), and low level of pathology 78.6% typical (44 typical, 12 atypical).
A number of the 800 individuals who met neuropathologic criteria for AD had a secondary pathologic diagnosis. These included 4 with secondary FTLD, 269 with secondary DLB, and 271 with secondary CVD. Cognitive profile classification of these individuals was as follows: AD and secondary FTLD 100% typical (4 typical, 0 atypical), AD and secondary DLB 82.1% typical (221 typical, 48 atypical), and AD and secondary CVD 81.9% typical (222 typical, 49 atypical). Those with AD and no secondary pathologic diagnosis included 79.9% typical (163 typical, 41 atypical).
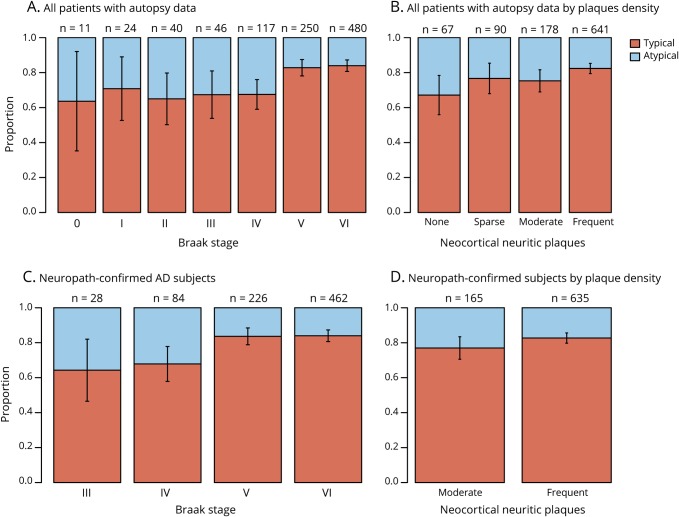
Overall, a lower Braak stage was associated with a higher likelihood of an atypical cognitive profile (figure 2A); 32% (76 of 238) of Braak stage 0 to IV, 17.2% (43 of 250) of Braak stage V, and 16.0% (77 of 480) of Braak stage VI were classified as atypical (Braak stage was missing for 8 participants). Linear regression showed a strong inverse relationship between atypicality score (PC2) and Braak stage treated as an ordinal predictor (p < 0.001). There was only a marginally significant negative linear relationship between atypicality score and degree of neocortical plaque pathology (p = 0.04; figure 2B). When both neuropathologic measures were included in a multivariate model, there was a highly significant negative effect of Braak stage (p < 0.001), as well as no significant effect of plaque pathology. Similar results were obtained when these analyses were restricted to the 800 participants with neuropathologically confirmed AD (figures 2, C and D). Univariate linear regression models showed no significant relationship between degree of atypicality in cognitive profile and the presence of FTLD pathology (n = 18), DLB pathology (n = 318), or CVD pathology (n = 333).
Figure 2. Proportion of typical and atypical participants by Braak and CERAD rating.
Distribution of cognitive subtype by Braak stage and Consortium to Establish a Registry for Alzheimer’s Disease (CERAD) plaque density rating (A and B) for all sample 1 participants with autopsy (n = 976) and (C and D) restricted to those with pathologically confirmed Alzheimer disease (AD) (n = 800). Number over each bar is the sample size for that stage/level. Classification was based on clustering results of sample 1.
Stability of neuropsychological subtype classification over time
Because the UDS clinical and neuropsychological evaluations were repeated approximately annually, 2,944 of the 4,711 participants with probable AD in sample 1 had ≥2 evaluations, including the baseline evaluations used to determine the table 2 factor loadings and thus define the cognitive atypicality score (PC2). We used these fixed factor loadings in table 2 to calculate the degree of cognitive atypicality from test scores at each subsequent evaluation. For participants in the atypical cluster at baseline, the mean cognitive atypicality score was 2.02 at baseline and 1.33 at the second evaluation and then decreased by only 0.34 over the next 2 annual evaluations. For those in the typical cluster at baseline, the mean cognitive atypicality score was −0.50 at baseline and −0.33 at the second evaluation and then increased by only 0.11 over the next 2 evaluations. Thus, the cognitive atypicality score is relatively stable over a 4-year interval.
Rates of decline of neuropsychological subtypes over time
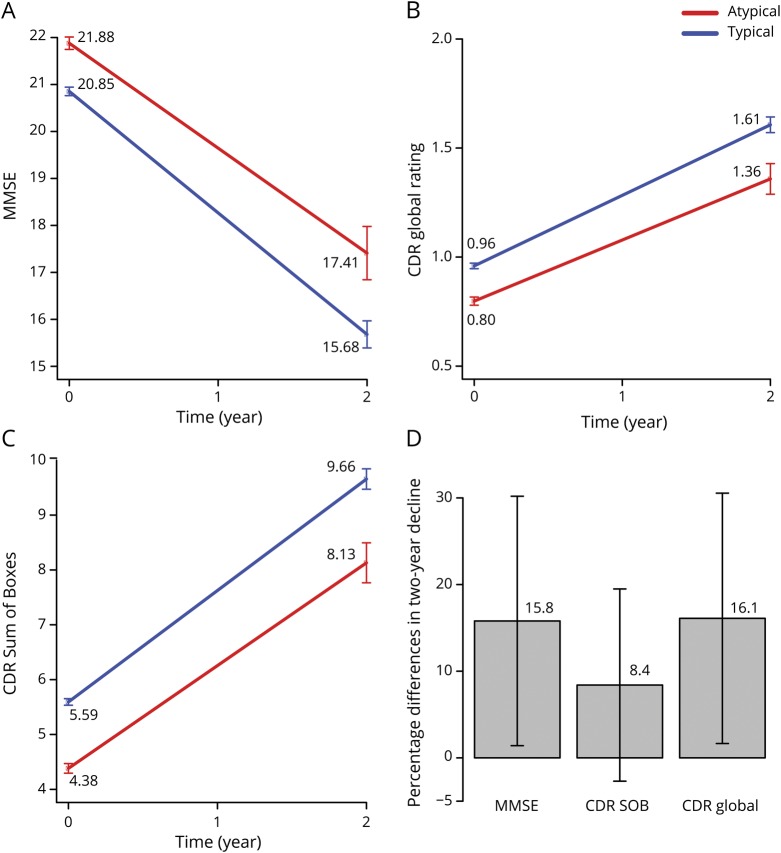
The rate of global cognitive/clinical decline was compared between participants with typical and those with atypical cognitive profile at baseline using linear mixed-effects models. Decline was measured by MMSE score, CDR Sum of Boxes score, and CDR global ratings over 2 years with 3 annual evaluations in sample 1 (baseline, year 1, year 2). Predictors were time (year), AD cognitive subtype, and time by AD cognitive subtype interaction. As expected, patients worsened significantly over time, with estimated trends for MMSE score of −2.59 (−2.73, −2.44) points per year, CDR global ratings of 0.32 (0.31, 0.34) point per year, and CDR Sum of Boxes score of 2.03 (1.94, 2.12) points per year (figure 3). The interaction between time and AD cognitive subtype was statistically significant for MMSE score (0.35 [0.03, 0.67] point per year) and CDR global ratings (−0.04 [-0.08, −0.001] point per year), indicating that atypical patients declined more slowly than typical patients. Mean 2-year decline on the MMSE was 4.47 points for the cognitively atypical patients with AD and 5.17 points for the cognitively typical patients, a 15.7% difference in total change between subtypes. The mean 2-year increase in CDR global ratings was 0.56 points for the cognitively atypical patients with AD and 0.65 points for the cognitively typical patients, a 16.1% difference. The mean 2-year increase in CDR Sum of Boxes score was 3.75 points for the cognitively atypical patients with AD and 4.07 points for the cognitively typical patients, an 8.5% difference.
Figure 3. Model fitted lines comparing rate of change over 2 years for typical and atypical AD.
Predicted rate of decline over 2 years for typical vs atypical Alzheimer disease (AD) cognitive subtypes based on mixed effects models from sample 1 for (A) Mini-Mental State Examination (MMSE), (B) Clinical Dementia Rating (CDR) global rating, and (C) CDR Sum of Boxes (SOB). (D) Differences in proportion of 2-year decline between typical and atypical AD with 95% confidence interval bars.
Discussion
Our objectives were to identify heterogeneity in cognitive profiles of patients with mild to moderate probable AD dementia and to determine whether cognitive profiles are systematically related to the clinical course and neuropathologic features of the disease. To achieve our objectives, we determined an empirically derived classification rule based on neuropsychological test scores that revealed cognitive subgroups within a sample of patients with mild to moderate dementia with probable AD; validated the classification rule in an independent sample of patients with AD, tested with a similar set of neuropsychological measures; assessed the stability of subtype classification over time and compared rates of cognitive and functional decline among cognitive subgroups; and compared neuropathologic features among cognitive subgroups.
Model-based clustering of PCA factor scores produced typical (79.6% of the sample) and atypical (20.4% of the sample) cognitive profile subgroups in a sample with autopsy-verified AD. The typical profile was characterized by greater deficits in episodic and semantic memory than in attention and executive functions, whereas the atypical profile had similar levels of impairment across all cognitive domains. From another perspective, the atypical profile could be viewed as having milder-than-expected memory impairment given the severity of deficits in attention and executive functions. Similar results were obtained in the discovery (typical 79.8%, atypical 20.2%) and independent validation (typical 71.8%, atypical 28.2%) samples. Furthermore, the exclusion of participants for whom depression may have contributed to cognitive impairment did not alter this pattern of results. The reproducibility of these subtypes was evidenced by a strong correlation in factor loadings between samples and the similarity of the identified cognitive profiles and is notable given minor differences in the specific neuropsychological tests that were administered across the original and validation samples.
The 2-cluster solution we observed is consistent with previous results. Although the prevalence of the atypical cognitive subtype was lower (20%–28%) in the present study than in some previous reports (e.g., 29%–52%5), this difference could be related to our exclusion of clinically diagnosed variant phenotypes of AD (e.g., logopenic primary progressive aphasia, posterior cortical atrophy) that would usually not be included in an AD clinical trial. These phenotypic AD variants were not excluded in other studies,1–6 which may explain why they identified a preserved memory subtype that we did not observe.
A strength of our study is the neuropathologic validation of the clinical diagnosis of probable AD in a large subset of patients. Approximately 82% of those diagnosed with probable AD met neuropathologic criteria for AD, and 68% of those had a secondary pathologic diagnosis in addition to AD (e.g., DLB, CVD). The distribution of atypical cognitive profiles in patients with autopsy-verified AD was similar in those with (typical 81.6%, atypical 18.4%) and in those without (typical 79.9%, atypical 20.1%) secondary pathology. There was a slightly higher percentage of atypical cognitive profiles in those who had been clinically misdiagnosed (i.e., those with non-AD pathology only; typical 70.5%, atypical 29.5%) compared to the overall sample, but this difference was not significant. These findings suggest that the atypical cognitive profile we observed in a subset of patients is not due to the presence of non-AD pathology but more likely is driven by variability in the severity and distribution of AD pathology. Furthermore, our results suggest that identification of an atypical cognitive profile will not be particularly helpful in differentiating between those with and those without AD pathology, supporting the need to measure amyloid and tau biomarkers in the selection of participants for clinical trials.
Consistent with the notion that variability in AD pathology drives the typical-atypical distinction, we found that the typical cognitive profile was associated with higher Braak stages than the atypical cognitive profile. There was a strong inverse relationship between Braak stage and atypicality score that was not modified significantly by level of neocortical plaque pathology. There was no significant independent relationship between level of plaque pathology (i.e., amyloid burden) and atypicality score. These results suggest that the typical-atypical distinction is determined largely by tangle pathology. The milder-than-expected memory impairment (given the severity of deficits in executive functions and attention) of the atypical group suggests that they have less pathology in the entorhinal cortex, hippocampus, and surrounding temporal lobe neocortex than those in the typical subgroup. This is consistent with their lower average Braak stage (which reflects both severity and distribution of tangle pathology) and lower likelihood of having an APOE ε4 genotype compared to the typical subgroup. Other researchers have also reported more extensive tangle pathology and a higher prevalence of APOE ε4 in patients with AD with substantial relative memory impairment.1 The typical-atypical classification does not simply reflect stage of disease, however, because subgroup classification remained stable across longitudinal assessments (i.e., patients with an atypical profile did not develop a typical profile over time). Our ability to address the effect of comorbid pathologies on degree of atypicality was limited by the lack of systematic characterization of the severity of comorbid neuropathology in the NACC database.
Comparison of rates of cognitive and functional decline among cognitive subgroups showed that the atypical cognitive profile was associated with slower decline on the MMSE (typical 2.59 points per year, atypical 2.17 points per year) and the CDR (global rating: typical 0.32 point per year, atypical 0.27 point per year; Sum of Boxes: typical 2.03 points per year, atypical 1.87 points per year). Over 2 years, there was an ≈16% difference in rate of decline on both the MMSE and the CDR global rating, as well as an 9% difference on the CDR Sum of Boxes score. These differences in rate of decline are noteworthy given the typical therapeutic effect sizes reported in AD trials, suggesting that cognitive heterogeneity may be a source of variability that should be considered in trial design and interpretation. For example, a trial that included 80% typical and 20% atypical patients (the composition of our sample) would need ≈10% more participants (678 vs 616) than a trial that included only typical patients to achieve 90% power to observe a 25% difference between treatment and control groups in 2-year rate of decline on the MMSE. However, if the composition of the group were 50% typical and 50% atypical, a distribution that has been observed in several cohorts,5 ≈30% more participants (794 vs 616 for 90% power) would be needed. Thus, cognitive heterogeneity could have a considerable effect on statistical power, depending on the prevalence of atypicality.
The decision rule we developed with model-based clustering methods can be used to classify patients with probable AD into typical and atypical subtypes in other samples tested with the same or similar neuropsychological tests. When we used the rule developed in sample 1 to classify patients in the autopsy-confirmed subsample or in the independent validation sample, there were low misclassification rates (5% and 1%), high sensitivity (both 100%), and good specificity (81% and 94%) in relation to classification using their own models. Thus, cognitive subtype can be determined easily in the future by applying our proposed decision rule.
Our study has several limitations. First, data on timing and reasons for dropout were limited, restricting the opportunity for modeling of early dropouts who might have had more aggressive decline within the 4-year study timeline. However, the rates of dropout in the typical and atypical subgroups were similar. Second, the neuropathologic diagnosis of AD was based on a relatively low threshold of Braak stage III or higher with a CERAD neuritic plaque rating of moderate or frequent. Our overall pattern of results did not change, however, when we used more stringent neuropathologic diagnostic criteria (Braak stage V or higher with a CERAD neuritic plaque rating of frequent, data not shown). Finally, the UDS neuropsychological test battery is brief and limited in scope, which may have precluded our ability to detect additional cognitive subtypes; however, similar 2-cluster solutions have been reported in 4 different AD cohorts using 4 different neuropsychological test batteries,5 suggesting that this is a robust finding. Nevertheless, more detailed neuropsychological assessment may reveal additional cognitive subtypes, particularly in early dementia.
Despite these limitations, our results show that we can reliably identify distinct cognitive profiles among patients with clinically diagnosed probable AD. These cognitive profiles are differentially associated with tangle pathology and have different rates of decline; hence, cognitive heterogeneity in probable AD may have implications for clinical trials, especially therapies targeting tau.
Acknowledgment
Portions of this research were presented at the 69th Annual Meeting of the American Academy of Neurology in Los Angeles, CA, May 2018.
Glossary
- AD
Alzheimer disease
- ADC
Alzheimer’s Disease Center
- CDR
Clinical Dementia Rating
- CERAD
Consortium to Establish a Registry for Alzheimer’s Disease
- CVD
cardiovascular disease
- DLB
dementia with Lewy bodies
- FAQ
Functional Assessment Questionnaire
- FTLD
frontotemporal lobar degeneration
- GDS
Geriatric Depression Scale
- MMSE
Mini-Mental State Examination
- MoCA
Montreal Cognitive Assessment
- NACC
National Alzheimer's Coordinating Center
- PCA
principal component analysis
- PC1
first principal component
- PC2
second principal component
- UDS
Uniform Data Set
Appendix. Authors
Study funding
The authors acknowledge their funding sources: D.M.J. by National Institute on Aging/NIH P50 AG05131; D.P.S. by P50 AG05131, R01 AG049810, the Helen A. Jarret Chair for Alzheimer's Disease Research; and H.F. through National Institute on Aging/NIH U19 AG010483 and P50 AG005131. The NACC database is funded by National Institute on Aging/NIH grant U01 AG016976. NACC data are contributed by the National Institute on Aging–funded ADCs: P30 AG019610 (principal investigator [PI] Eric Reiman, MD), P30 AG013846 (PI Neil Kowall, MD), P50 AG008702 (PI Scott Small, MD), P50 AG025688 (PI Allan Levey, MD, PhD), P50 AG047266 (PI Todd Golde, MD, PhD), P30 AG010133 (PI Andrew Saykin, PsyD), P50 AG005146 (PI Marilyn Albert, PhD), P50 AG005134 (PI Bradley Hyman, MD, PhD), P50 AG016574 (PI Ronald Petersen, MD, PhD), P50 AG005138 (PI Mary Sano, PhD), P30 AG008051 (PI Thomas Wisniewski, MD), P30 AG013854 (PI M. Marsel Mesulam, MD), P30 AG008017 (PI Jeffrey Kaye, MD), P30 AG010161 (PI David Bennett, MD), P50 AG047366 (PI Victor Henderson, MD, MS), P30 AG010129 (PI Charles DeCarli, MD), P50 AG016573 (PI Frank LaFerla, PhD), P50 AG005131 (PI James Brewer, MD, PhD), P50 AG023501 (PI Bruce Miller, MD), P30 AG035982 (PI Russell Swerdlow, MD), P30 AG028383 (PI Linda Van Eldik, PhD), P30 AG053760 (PI Henry Paulson, MD, PhD), P30 AG010124 (PI John Trojanowski, MD, PhD), P50 AG005133 (PI Oscar Lopez, MD), P50 AG005142 (PI Helena Chui, MD), P30 AG012300 (PI Roger Rosenberg, MD), P30 AG049638 (PI Suzanne Craft, PhD), P50 AG005136 (PI Thomas Grabowski, MD), P50 AG033514 (PI Sanjay Asthana, MD, FRCP), P50 AG005681 (PI John Morris, MD), and P50 AG047270 (PI Stephen Strittmatter, MD, PhD).
Disclosure
Y. Qiu, D. Jacobs, and K. Messer report no disclosures relevant to the manuscript. D. Salmon has been a consultant for Takeda Pharmaceuticals, Inc and Aptinyx, Inc. H. Feldman reports grants from Biohaven Pharmaceuticals and Toyama Pharmaceuticals and development grant funding from Probiodrug; service agreements with Eisai Pharmaceuticals, Genentech/Roche Pharmaceuticals, Banner Health Institute, Samus Therapeutics, Merck Pharmaceuticals, Tau RX, Arkuda Therapeutics, and Samumed; speaker fees from World Events Forum, Medscape, Optum, and San Diego Academy of Family Physicians; and travel expenses from Axon Neurosciences, Alion Pharmaceuticals, Probiodrug, and Dominantly Inherited Alzheimer's Disease. Go to Neurology.org/N for full disclosures.
References
- 1.Crane PK, Trittschuh E, Mukherjee S, et al. Incidence of cognitively defined late-onset Alzheimer's dementia subgroups from a prospective cohort study. Alzheimers Dement 2017;13:1307–1316. [DOI] [PMC free article] [PubMed] [Google Scholar]
- 2.Davidson JE, Irizarry MC, Bray BC, et al. An exploration of cognitive subgroups in Alzheimer's disease. J Int Neuropsychol Soc 2010;16:233–243. [DOI] [PMC free article] [PubMed] [Google Scholar]
- 3.Peter J, Abdulkadir A, Kaller C, et al. Subgroups of Alzheimer's disease: stability of empirical clusters over time. J Alzheimers Dis 2014;42:651–661. [DOI] [PubMed] [Google Scholar]
- 4.Scheltens NM, Galindo-Garre F, Pijnenburg YA, et al. The identification of cognitive subtypes in Alzheimer's disease dementia using latent class analysis. J Neurol Neurosurg Psychiatry 2016;87:235–243. [DOI] [PubMed] [Google Scholar]
- 5.Scheltens NME, Tijms BM, Koene T, et al. Cognitive subtypes of probable Alzheimer's disease robustly identified in four cohorts. Alzheimers Dement 2017;13:1226–1236. [DOI] [PMC free article] [PubMed] [Google Scholar]
- 6.Stopford CL, Snowden JS, Thompson JC, Neary D. Variability in cognitive presentation of Alzheimer's disease. Cortex 2008;44:185–195. [DOI] [PubMed] [Google Scholar]
- 7.Barnes J, Dickerson BC, Frost C, Jiskoot LC, Wolk D, van der Flier WM. Alzheimer's disease first symptoms are age dependent: evidence from the NACC dataset. Alzheimers Dement 2015;11:1349–1357. [DOI] [PMC free article] [PubMed] [Google Scholar]
- 8.Dickerson BC, Wolk DA; Alzheimer's Disease Neuroimaging Initiative. Dysexecutive versus amnesic phenotypes of very mild Alzheimer's disease are associated with distinct clinical, genetic and cortical thinning characteristics. J Neurol Neurosurg Psychiatry 2011;82:45–51. [DOI] [PMC free article] [PubMed] [Google Scholar]
- 9.Mez J, Cosentino S, Brickman AM, Huey ED, Manly JJ, Mayeux R. Dysexecutive versus amnestic Alzheimer disease subgroups: analysis of demographic, genetic, and vascular factors. Alzheimer Dis Assoc Disord 2013;27:218–225. [DOI] [PMC free article] [PubMed] [Google Scholar]
- 10.Vardy ER, Ford AH, Gallagher P, et al. Distinct cognitive phenotypes in Alzheimer's disease in older people. Int Psychogeriatr 2013;25:1659–1666. [DOI] [PubMed] [Google Scholar]
- 11.Knopman DS, DeKosky ST, Cummings JL, et al. Practice parameter: diagnosis of dementia (an evidence-based review): report of the Quality Standards Subcommittee of the American Academy of Neurology. Neurology 2001;56:1143–1153. [DOI] [PubMed] [Google Scholar]
- 12.McKhann GM, Knopman DS, Chertkow H, et al. The diagnosis of dementia due to Alzheimer's disease: recommendations from the National Institute on Aging-Alzheimer's Association workgroups on diagnostic guidelines for Alzheimer's disease. Alzheimers Dement 2011;7:263–269. [DOI] [PMC free article] [PubMed] [Google Scholar]
- 13.Dubois B, Feldman HH, Jacova C, et al. Research criteria for the diagnosis of Alzheimer's disease: revising the NINCDS-ADRDA criteria. Lancet Neurol 2007;6:734–746. [DOI] [PubMed] [Google Scholar]
- 14.Dubois B, Feldman HH, Jacova C, et al. Advancing research diagnostic criteria for Alzheimer's disease: the IWG-2 criteria. Lancet Neurol 2014;13:614–629. [DOI] [PubMed] [Google Scholar]
- 15.McKhann G, Drachman D, Folstein M, Katzman R, Price D, Stadlan EM. Clinical diagnosis of Alzheimer's disease: report of the NINCDS-ADRDA Work Group under the auspices of Department of Health and Human Services Task Force on Alzheimer's Disease. Neurology 1984;34:939–944. [DOI] [PubMed] [Google Scholar]
- 16.Monsell SE, Dodge HH, Zhou XH, et al. Results from the NACC Uniform Data Set Neuropsychological Battery Crosswalk Study. Alzheimer Dis Assoc Disord 2016;30:134–139. [DOI] [PMC free article] [PubMed] [Google Scholar]
- 17.Morris JC, Weintraub S, Chui HC, et al. The uniform data set (UDS): clinical and cognitive variables and descriptive data from Alzheimer Disease Centers. Alzheimer Dis Assoc Disord 2006;20:210–216. [DOI] [PubMed] [Google Scholar]
- 18.Morris JC. The Clinical Dementia Rating (CDR): current version and scoring rules. Neurology 1993;43:2412–2414. [DOI] [PubMed] [Google Scholar]
- 19.Pfeffer RI, Kurosaki TT, Harrah CH, Jr, Chance JM, Filos S. Measurement of functional activities in older adults in the community. J Gerontol 1982;37:323–329. [DOI] [PubMed] [Google Scholar]
- 20.Yesavage JA, Brink TL, Rose TL, et al. Development and validation of a geriatric depression screening scale: a preliminary report. J Psychiatr Res 1984;17:37–49. [DOI] [PubMed] [Google Scholar]
- 21.Weintraub S, Salmon D, Mercaldo N, et al. The Alzheimer's Disease Centers' uniform data set (UDS): the neuropsychological test battery. Alzheimer Dis Assoc Disord 2009;23:91–101. [DOI] [PMC free article] [PubMed] [Google Scholar]
- 22.Weintraub S, Besser L, Dodge HH, et al. Version 3 of the Alzheimer Disease Centers' neuropsychological test battery in the uniform data set (UDS). Alzheimer Dis Assoc Disord 2018;32:10–17. [DOI] [PMC free article] [PubMed] [Google Scholar]
- 23.Braak H, Braak E. Neuropathological stageing of Alzheimer-related changes. Acta Neuropathol 1991;82:239–259. [DOI] [PubMed] [Google Scholar]
- 24.Mirra SS, Heyman A, McKeel D, et al. The Consortium to Establish a Registry for Alzheimer's Disease (CERAD), part II: standardization of the neuropathologic assessment of Alzheimer's disease. Neurology 1991;41:479–486. [DOI] [PubMed] [Google Scholar]
- 25.Beach TG, Monsell SE, Phillips LE, Kukull W. Accuracy of the clinical diagnosis of Alzheimer disease at National Institute on Aging Alzheimer Disease Centers. J Neuropathol Exp Neurol 2012;71:266–273. [DOI] [PMC free article] [PubMed] [Google Scholar]
- 26.R Core Team. R: A Language and Environment for Statistical Computing. Vienna: R Foundation for Statistical Computing; 2017. Available at: R-project.org/. [Google Scholar]
- 27.Fraley C, Raftery AE, Murphy TB, Scrucca L. mclust Version 4 for R: Normal Mixture Modeling for Model-Based Clustering, Classification, and Density Estimation, Technical Report No. 597. Seattle: University of Washington, Department of Statistics; 2012. [Google Scholar]
- 28.Fraley C, Raftery AE. Model-based clustering, discriminant analysis and density estimation. J Am Stat Assoc 2002;97:611–631. [Google Scholar]
- 29.Schwarz G. Estimating the dimension of a model. Ann Stat 1978;6:461–464. [Google Scholar]
- 30.Buuren SV, Groothuis-Oudshoorn K. Mice: multivariate imputation by chained equations in R. J Stat Softw 2011;45:1–67. [Google Scholar]
Associated Data
This section collects any data citations, data availability statements, or supplementary materials included in this article.
Data Availability Statement
NACC has developed and maintains a large relational database of standardized clinical and neuropathologic research data collected from the National Institute on Aging–funded ADCs across the United States. NACC data are freely available to all researchers.


