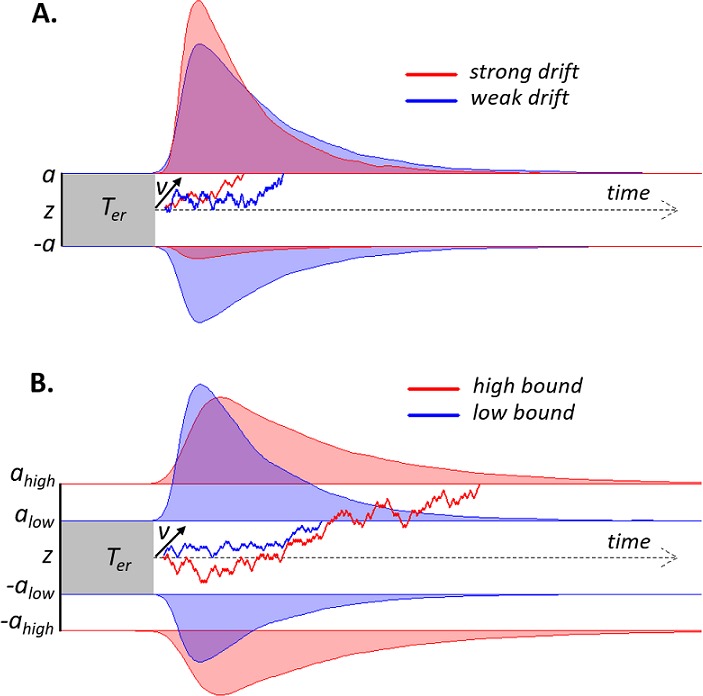
Figure 1. Schematic of drift diffusion model (DDM) with varying drift rates.

(A) and varying decision bounds (B). Noisy sensory evidence is accumulated over time, until the decision variable reaches one of two bounds (a or -a), corresponding to correct and incorrect choices. The efficiency of information accumulation is given by v (mean drift rate). The time for sensory encoding and response execution is given by Ter. By increasing the separation between decision bounds, the probability of being correct increases, at the expense of prolonged reaction times. RT distributions (upper bounds) and error distributions (lower bounds) are depicted for different levels of drift rate (A) and decision bound (B).
