Abstract
Fluorescein angiography (FA) is the current clinical imaging standard for vascular related retinal diseases such as macular degeneration and diabetic retinopathy. However, FA is considered invasive and can provide only two-dimensional imaging. In comparison, optical coherence tomography angiography (OCTA) is noninvasive and can generate three-dimensional imaging; investigations of OCTA already demonstrated great promise in retinal vascular imaging. Yet, to further develop and apply OCTA, strengths and weaknesses between OCTA and FA need to be thoroughly compared. To avoid complications in image registration, an ideal comparison requires co-registered and simultaneous imaging by both FA and OCTA. In this Letter, we developed a system with integrated laser-scanning ophthalmoscope FA (SLO-FA) and OCTA, and conducted simultaneous dual-modality retinal vascular imaging in rodents. In imaging healthy rodent eyes, OCTA can resolve retinal capillaries better than SLO-FA does, particularly deep capillaries. In imaging rodent eyes with laser-induced choroidal neovascularization (CNV), OCTA can identify CNV that eludes SLO-FA detection.
OCIS codes: (110.4500) Optical coherence tomography, (170.3880) Medical and biological imaging, (170.4460) Ophthalmic optics and devices, (170.4580) Optical diagnostics for medicine
Aberrant neovascularization is involved in several vision-threatening eye diseases [1]. To cure or slow down neovascularization, early medical intervention is necessary, which requires precise detection of neovascularization and longitudinal treatment monitoring. The current detection standard is fluorescein angiography (FA) [2]. FA requires fluorescent dye injection followed by imaging after the dye has circulated within the retinal vascular network. There are, however, several potential limitations. First, FA requires injection of sodium fluorescein, which may induce adverse side effects in patients [3]. Second, FA can only achieve two-dimensional imaging, which cannot resolve different retinal vascular layers. Third, FA has limited imaging depth, precluding imaging of deep retinal and choroidal vessels [4].
In comparison, optical coherence tomography angiography (OCTA) is a noninvasive and depth-resolved method [5–7]. OCTA depends on blood flow-induced intrinsic contrast to visualize vasculature. There are several advantages for OCTA. First, OCTA requires no exogenous agents, which avoids potential deleterious side effects. Second, OCTA has micrometer level axial resolution, which resolves different vessel layers in both retina and choroid. Third, OCTA penetrates more than 1 mm, which covers all retinal and most choroidal vessel layers. These strengths have accounted for the rising popularity of OCTA in retinal and choroidal studies. Previous research demonstrated that OCTA can image different retinal vascular layers precisely [5], and recent studies highlighted that OCTA can detect choroidal neovascularization (CNV) accurately [8,9].
To further explore the clinical applications of both FA and OCTA, we need to compare their performance in angiography imaging and disease detection. However, existing studies compared sequentially obtained FA and OCTA images [9,10], where potential artifacts may bias the conclusion. Here, we developed an integrated scanning laser ophthalmoscopy FA (SLO-FA) and OCTA system to compare the strengths and weakness of these two modalities in retinal vascular imaging. A similar system was previously reported with a focus on glial cells in transgenic rodent models [11]. In this Letter, we conducted simultaneous dual-modal imaging in normal rats/mice and, in choroidal neovascularization (CNV), in a laser-induced CNV mouse model.
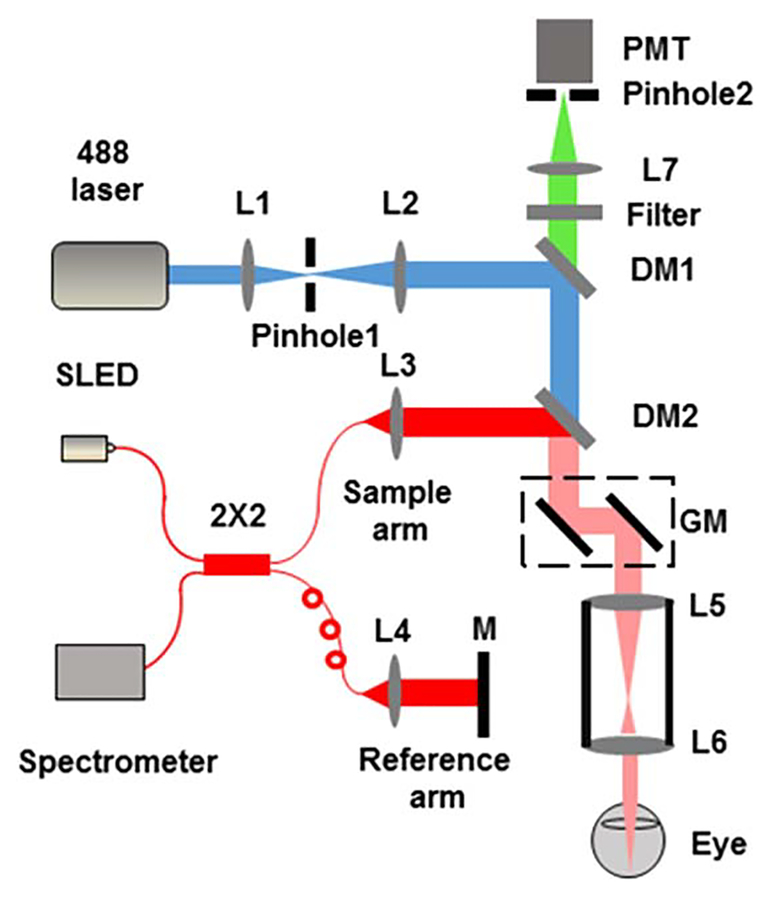
Figure 1 shows the schematic of the experimental system. The SLO-FA used a 488 nm laser (161C-410–21, Spectra Physics) as the illumination source. The 488 nm beam was spatially filtered by a 50 μm pinhole (P50S, Thorlabs) and expanded to 2 mm in diameter by a pair of lenses (L1 and L2). After passing through two dichroic mirrors (DM1, LPD02–488RU-25, Semrock; DM2, FM02, Thorlabs), the expanded beam reached a pair of galvanometers (QS-7, Nutfield Technology) and entered the pupil after two telescope lenses (L5 and L6). The fluorescence emission was filtered by a 30 μm pinhole (P30S, Thorlabs), collected by a PMT (Hamamatsu), and digitized by a Gage card (CS1622, Gage) at a 200 MHz sampling rate.
Fig. 1.
Schematic of the integrated OCT and SLO. L1 to L7 are lenses (corresponding focal lengths of L1–L7 are 25 mm, 50 mm, 11 mm, 11 mm, 75 mm, 15 mm, and 30 mm, respectively); M, mirror; GM, galvanometer; DM1 and DM2, dichroic mirrors; PMT, photomultiplier; SLED, superluminescent diode.
The OCTA used a broadband SLED for illumination (center wavelength: 840 nm; bandwidth: 95 nm; IPSDW0825C-0314, InPhenix). The illumination beam was first coupled into a 50 × 50 fiber coupler (OZ optics) and then split into the sample arm and reference arm. In the sample arm, the OCTA probing beam merged into the SLO-FA probing beam by DM2. Interference signals between the sample and reference arm were collected by a homemade spectrometer, which consisted of a grating (Wasatch, 1200 lines/mm), a focusing lens (Thorlabs, focal length 150 mm), and a line camera (Basler, 2048 pixels, 140 KHz highest sampling rate, 50 KHz in our current experiment).
OCTA required multiple scanning at a single location to visualize vasculature. In this Letter, we performed five overlapping B-scans at every location, with 400 A-lines in each B-scan. We scanned 512 discrete B-scan positions to produce a volu-metric map of the retinal and choroidal vascular network. The final image volume of OCTA is 400 × 512 × 2048 pixels (x-400, y-512, z-2048); the image size of SLO-FA is 400 × 512 (x-400, y-512). Both OCTA and SLO-FA had the same B-scan frame rate, which was 25 frame/s, and it took 20.5 s to acquire the entire image volume.
Important parameters for SLO-FA and OCTA include resolutions and imaging depths. In SLO-FA, the lateral resolution is determined by illumination numerical aperture (NA) and excitation wavelength (488 nm). We calculated the illumination NA as 0.044 for rats and 0.088 for mice using the following equation:
| (1) |
where n is vitreous refractive index (1.33), d is illumination beam diameter (400 μm), and l is the eye axial length (6 mm for rats and 3 mm for mice). We then calculated corresponding theoretical lateral resolution as 5.7 μm in rats and 2.85 μm in mice, according to equations described in [12]. The optical section thickness (OST) of SLO-FA was determined by the value of collection NA and diameter of pinhole2. In this Letter, the size of the galvanometers (10 mm in width, tilted at 45°) and focal length of L7 (30 mm) determined the collection NA as
| (2) |
We followed [12] to estimate the OST:
| (3) |
where n is vitreous refractive index (1.33), PH is the diameter of pinhole2 (30 μm), and λem is the wavelength of the fluorescence emission (515 nm). The OST was 294 μm for both rats and mice in this Letter. In OCT, the theoretical lateral resolution was around 12 μm in rats and 6 μm in mice; the axial resolution was 3.2 μm in both rats and mice; the imaging depth was 1200 μm. Due to high aberration of the rodent’s eye, actual resolutions should be lower than the theoretical values. We carefully aligned the optical axes of the SLO and OCT beams and adjusted both imaging focal planes to the retinal capillary vessel layer during experiments. The illumination powers were 0.2 mW for SLO-FA and 1 mW for OCTA, which satisfied the ocular laser safety limit provided by the American National Standard for Safe Use of Lasers (ANSI) and [13].
During experiments, we used a mixture of isoflurane with compressed normal air to anesthetize rats, and the ketamine–xylazine cocktail to anesthetize mice. Details about aesthetic procedures were described in our previous papers [14,15]. Before imaging, we dilated the rodents’ pupils with a 1% tropicamide ophthalmic solution and paralyzed the iris sphincter muscle with a 0.5% tetracaine hydrochloride ophthalmic solution. Artificial teardrops (Systane, Alcon Laboratories, Inc.) were applied every other minute to prevent corneal dehydration. To prepare the CNV mouse model, we performed laser photocoagulation to rupture Bruch’s membrane in the mouse eye with an argon 532 nm laser (IRIDEX Oculight GLx), which was attached to a slit lamp delivery system (30SL-M, Carl Zeiss). During laser treatment, we used a glass coverslip to flatten the cornea and focused the laser beam onto the retina. Successful laser applications resulted in “bubble” formation during photocoagulation. We imaged the CNV lesions in the mice six days after laser treatment. SLO-FA required contrast agent (sodium fluorescein, Sigma) administration before imaging. We injected 0.1 ml of 10% sodium fluorescein into rats through the tail vein and 0.1 ml of 2.5% sodium fluorescein into mice through the peritoneum. Six minute after dye injection, we performed OCTA and SLO-FA imaging simultaneously. All experimental procedures complied with the ARVO Statement for the Use of Animals in Ophthalmic and Vision Research; the experimental protocol was approved by the Institutional Animal Care and Use Committee at Northwestern University.
To process OCTA data, we applied the split-spectrum analysis [5] and evenly divided the 95 nm bandwidth into four nonoverlapping sub-bands, with each sub-band being 23.75 nm. We reconstructed corresponding B-scan images from each sub-band. The retinal vasculature was visualized through complex signal differences between sequential B-scans at the same location. Details can be found in [6,7].
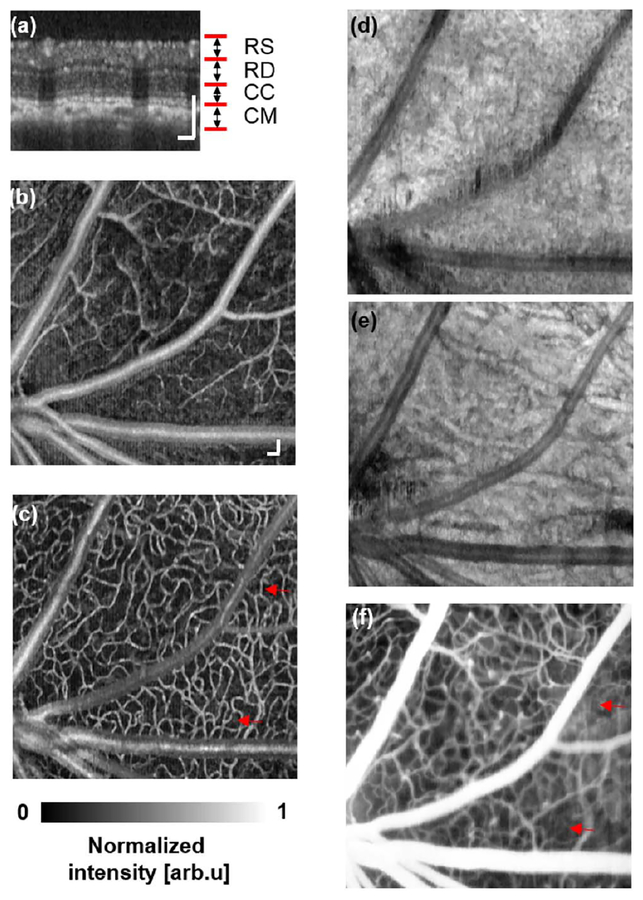
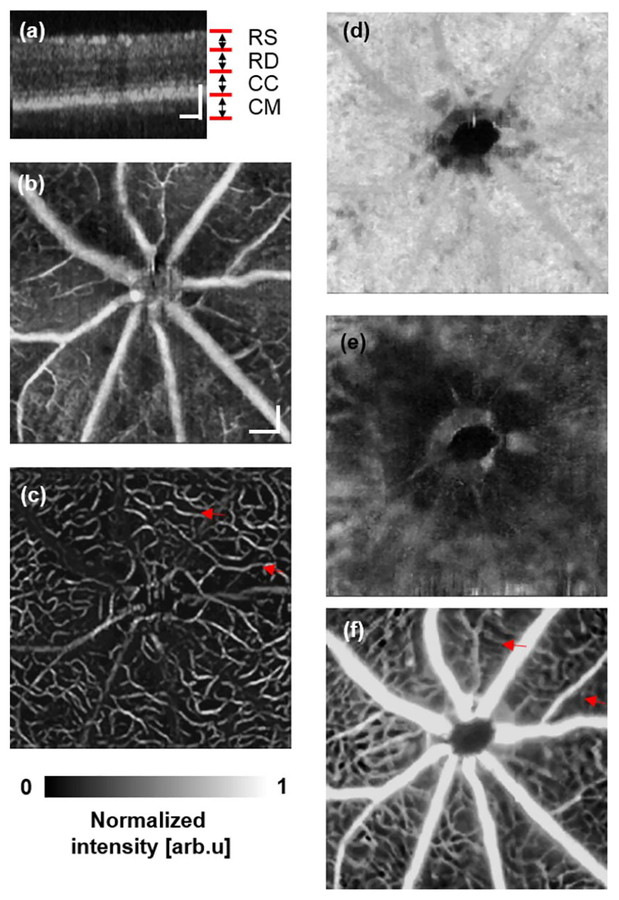
Figure 2 shows both OCTA and SLO-FA images from a normal rat. The depth-resolved OCTA [Fig. 2(a)] captured different vascular layers, including the retinal superficial vessel layer [Fig. 2(b)], retinal deep capillary bed layer [Fig. 2(c)], chorocapillary layer [Fig. 2(d)], and choroidal major vessel layer [Fig. 2(e)]. In comparison, SLO-FA provided only a two-dimensional image, stacking different vessel layers together. Similar results were also observed from a normal mouse, as shown in Fig. 3. The OCTA resolved the retinal superficial vessel layer [Fig. 3(b)], retinal deep capillary bed layer [Fig. 3(c)], chorocapillary layer [Fig. 3(d)], and choroidal major vessel layer [Fig. 3(e)]. The SLO-FA, however, only generated a two-dimensional image.
Fig. 2.
Simultaneous OCTA and SLO-FA imaging of a normal rat. (a) OCT B-scan image. RS, retinal superficial vessel layer; RD, retinal deep capillary vessel layer; CC, choriocapillary layer; CM, choroidal major vessel layer. (b) Retinal superficial vessel layer imaged by OCTA. (c) Retinal deep capillary bed imaged by OCTA. (d) Choriocapillary bed layer imaged by OCTA. (e) Choroidal major vessel layer imaged by OCTA. (f) SLO-FA image. Bar: 100 μm.
Fig. 3.
Simultaneous OCTA and SLO-FA imaging of a normal mouse. (a) OCT B-scan image. RS, retinal superficial vessel layer; RD, retinal deep capillary vessel layer; CC, choriocapillary layer; CM, choroidal major vessel layer. (b) Retinal superficial vessel layer imaged by OCTA. (c) Retinal deep capillary bed imaged by OCTA. (d) Choriocapillary bed layer imaged by OCTA. (e) Choroidal major vessel layer imaged by OCTA. (f) SLO-FA image. Bar: 100 μm.
Though most vessels in OCTA and SLO-FA were clear, some capillaries were visible only in OCTA, but missing in SLO-FA, as highlighted by the red arrows in Figs. 2(c), 2(f), 3(c), and 3(f). Other groups also reported the missing deep retinal capillaries in SLO-FA as compared with OCTA [10]. Regarding OCTA quality of the choroidal major vessel layer, results from the rat were better than the mouse, which was presumably caused by higher aberration in mouse eyes.
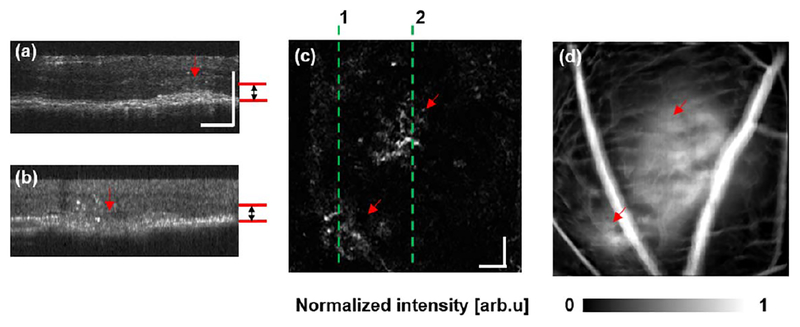
We also compared CNV detection between OCTA and SLO-FA in the laser-induced CNV mouse model [16]. OCTA characterized CNV as a pattern of vascular hyper-reflectance within the outer retina, and SLO-FA indicated CNV by an area of leakage [9]. Among the eight mice with CNV examined, we successfully detected CNV in all mice using OCTA and only six using SLO-FA. An example of CNV detected by both OCTA and SLO-FA is shown in Fig. 4. Figures 4(a) and 4(b) are depth-resolved OCT B-scans from the positions highlighted by the dashed lines in Fig. 4(c). The red arrows indicate the CNV lesions. We extracted the signal between Bruch’s membrane and the outer plexiform layer [marked by the red lines in Figs. 4(a) and 4(b) to reconstruct the en face image [Fig. 4(c)], where CNV lesions are visible as highlighted by the two arrows. Corresponding leakage from CNV lesions are also obvious in SLO-FA Fig. 4(d)].
Fig. 4.
Mouse CNV detected by both OCTA and SLO-FA. (a), (b) Cross-sectional OCT B-scan images. (c) CNV detected by OCTA. The en face OCTA imaging was extracted from the depth range defined by the red lines in (a) and (b). The dashed lines 1 and 2 are the locations of the B-scans shown in (a) and (b), respectively. (d) SLO-FA image showing the detected CNV leakage. Bar: 100 μm.
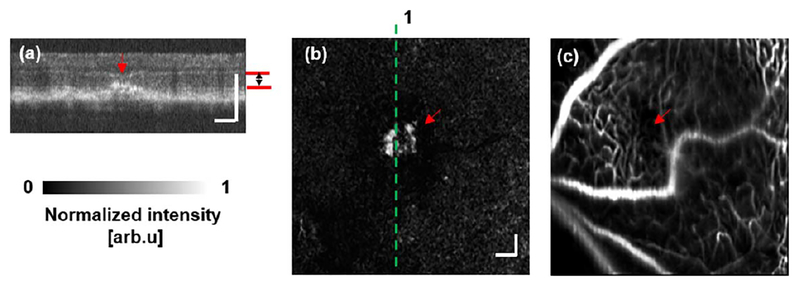
Figure 5 shows the results from one of the subjects whose CNV was not detected by SLO-FA. Figure 5(a) shows the OCT B-scan from the position indicated by the dashed line in the en face image, Fig. 5(b), where the CNV lesion is highlighted by the red arrow. In Fig. 5(b), CNV is visible. In contrast, no obvious leakage was present in the simultaneously acquired SLO-FA image [Fig. 5(c)].
Fig. 5.
Mouse CNV detected by OCTA, but not SLO-FA. (a) Sample OCT cross-sectional B-scan image. (b) CNV imaged by OCTA. The en face OCTA image was extracted from the depth range defined by the red lines in (a). The dashed line 1 indicates the location of the B-scan image shown in (a). (c) SLO-FA showing no detected leakage. Bar: 100 μm.
In this Letter, we developed a simultaneous OCTA and SLO-FA imaging system and compared the angiographic results between OCTA and SLO-FA in rodents. We noticed that OCTA was better at imaging three-dimensional vascular network, as well as resolving retinal capillaries in deep tissues. SLO-FA only provided two-dimensional images and revealed superficial retinal vessels, in contrast to OCTA [Figs. 2(c) and 2(f)]. The missing capillaries might be caused by the limited optical section thickness of SLO-FA. Another possible reason for missing capillaries in SLO-FA was light scattering within the retina. Light scattering can degrade the wavefront quality of fluorescence signals, preventing deep capillary imaging in SLO-FA [17]. With wavefront correction by adaptive optics, however, SLO-FA recaptured certain missing retinal capillaries [17].
We also tested CNV detection with the simultaneous OCTA and SLO-FA system. Across the eight tested CNV mice, we found that OCTA detected CNV better than SLO-FA. OCTA visualized the CNV in the outer retinal layer in every examined mouse, while SLO-FA only succeeded in detecting CNV leakage in six out of the eight CNV mice. For the two missing cases, one possibility is that leakage of these CNVs is small, and light scattering in SLO-FA deteriorates the signals and prevents the leakage from being detected [18]. It is also possible that there may be no leakage from CNV lesions. Despite advantages from OCTA, SLO-FA has a unique strength over OCTA in detecting leakage from abnormal vessels as shown in Fig. 4(d). Changes in leakage rate over time may provide useful information for various retinal/choroidal pathological studies [9]. One limit in the current research is the small sample size (n = 2), which cannot lead to comprehensive conclusions beyond feasibility demonstration.
Acknowledgment.
W. Liu is supported by the HHMI International Graduate Research Fellowship. H. F. Zhang has financial interests in Opticent Health Inc., which, however, did not support this work.
Funding. National Institutes of Health (NIH) (1R01EY019951, 1R24EY022883, 1DP3DK108248); National Science Foundation (NSF) (CBET-1055379, DBI-1353952).
REFERENCES
- 1.Lee P, Wang CC, and Adamis AP, Surv. Ophthalmol 43, 245 (1998). [DOI] [PubMed] [Google Scholar]
- 2.van Velthoven ME, Faber DJ, Verbraak FD, van Leeuwen TG, and de Smet MD, Prog. Retinal Eye Res. 26, 57 (2007). [DOI] [PubMed] [Google Scholar]
- 3.Marcus DF, Bovino JA, and Williams D, Arch. Ophthalmol 102, 825 (1984). [DOI] [PubMed] [Google Scholar]
- 4.Kim DY, Fingler J, Zawadzki RJ, Park SS, Morse LS, Schwartz DM, Fraser SE, and Werner JS, Proc. Natl. Acad. Sci. USA 110, 14354 (2013). [DOI] [PMC free article] [PubMed] [Google Scholar]
- 5.Jia Y, Tan O, Tokayer J, Potsaid B, Wang Y, Liu JJ, Kraus MF, Subhash H, Fujimoto JG, and Hornegger J, Opt. Express 20, 4710 (2012). [DOI] [PMC free article] [PubMed] [Google Scholar]
- 6.Yi J, Chen S, Backman V, and Zhang HF, Biomed. Opt. Express 5, 3603 (2014). [DOI] [PMC free article] [PubMed] [Google Scholar]
- 7.An L, Qin J, and Wang RK, Opt. Express 18, 8220 (2010). [DOI] [PMC free article] [PubMed] [Google Scholar]
- 8.Jia Y, Bailey ST, Hwang TS, McClintic SM, Gao SS, Pennesi ME, Flaxel CJ, Lauer AK, Wilson DJ, Hornegger J, Fujimoto JG, and Huang D, Proc. Natl. Acad. Sci. USA 112, E2395 (2015). [DOI] [PMC free article] [PubMed] [Google Scholar]
- 9.Jia Y, Bailey ST, Wilson DJ, Tan O, Klein ML, Flaxel CJ, Potsaid B, Liu JJ, Lu CD, Kraus MF, Fujimoto JG, and Huang D, Ophthalmology 121, 1435 (2014). [DOI] [PMC free article] [PubMed] [Google Scholar]
- 10.Spaide RF, Klancnik JM Jr., and Cooney MJ, JAMA Ophthalmol 133, 45 (2015). [DOI] [PubMed] [Google Scholar]
- 11.Zhang P, Zam A, Jian Y, Wang X, Burns ME, Sarunic MV, Pugh EN, and Zawadzki RJ, Proc. SPIE 9307, 930701 (2015). [Google Scholar]
- 12.Park J, Choi C, and Kihm KD, Exp. Fluids 37, 105 (2004). [Google Scholar]
- 13.Delori FC, Webb RH, and Sliney DH, J. Opt. Soc. Am. A 24, 1250 (2007). [DOI] [PubMed] [Google Scholar]
- 14.Song W, Wei Q, Liu W, Liu T, Yi J, Sheibani N, Fawzi AA, Linsenmeier RA, Jiao S, and Zhang HF, Sci. Rep 4, 6525 (2014). [DOI] [PMC free article] [PubMed] [Google Scholar]
- 15.Song W, Wei Q, Feng L, Sarthy V, Jiao S, Liu X, and Zhang HF, J. Biophoton 6, 505 (2013). [DOI] [PMC free article] [PubMed] [Google Scholar]
- 16.Liu T, Hui L, Wang YS, Guo JQ, Li R, Su JB, Chen JK, Xin XM, and Li WH, Graefes Arch. Clin. Exp. Ophthalmol 251, 1293 (2013). [DOI] [PubMed] [Google Scholar]
- 17.Pinhas A, Dubow M, Shah N, Chui TY, Scoles D, Sulai YN, Weitz R, Walsh JB, Carroll J, Dubra A, and Rosen RB, Biomed. Opt. Express 4, 1305 (2013). [DOI] [PMC free article] [PubMed] [Google Scholar]
- 18.Mendis KR, Balaratnasingam C, Yu P, Barry CJ, McAllister IL, Cringle SJ, and Yu DY, Invest. Ophthalmol. Visual Sci 51, 5864 (2010). [DOI] [PubMed] [Google Scholar]


