. 2019 Aug 27;8:e46754. doi: 10.7554/eLife.46754

Figure 3. Maintenance of heteromerization between paralogs leads to greater functional similarity.

The similarity score is the average proportion of shared terms (100% * Jaccard's index) across pairs of paralogs for GO molecular functions, GO biological processes and gene deletion phenotypes. The mean values of similarity scores and of the correlation of genetic interaction profiles are compared between HM and HM&HET pairs for SSDs and WGDs. P-values are from Wilcoxon tests.

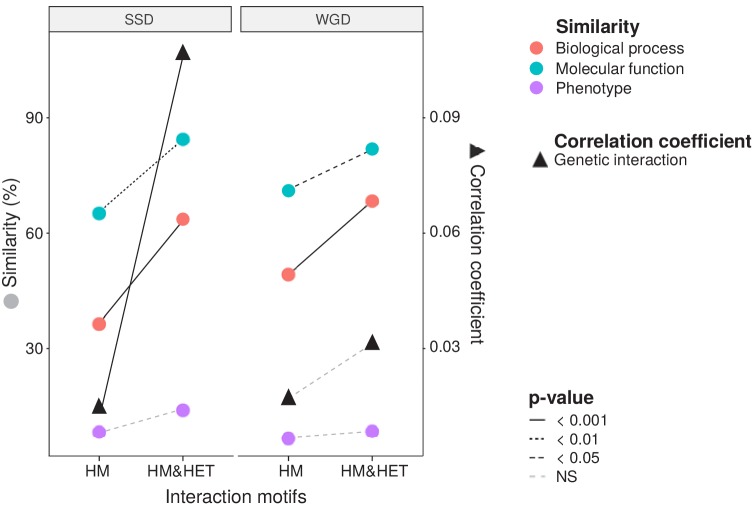
Figure 3.

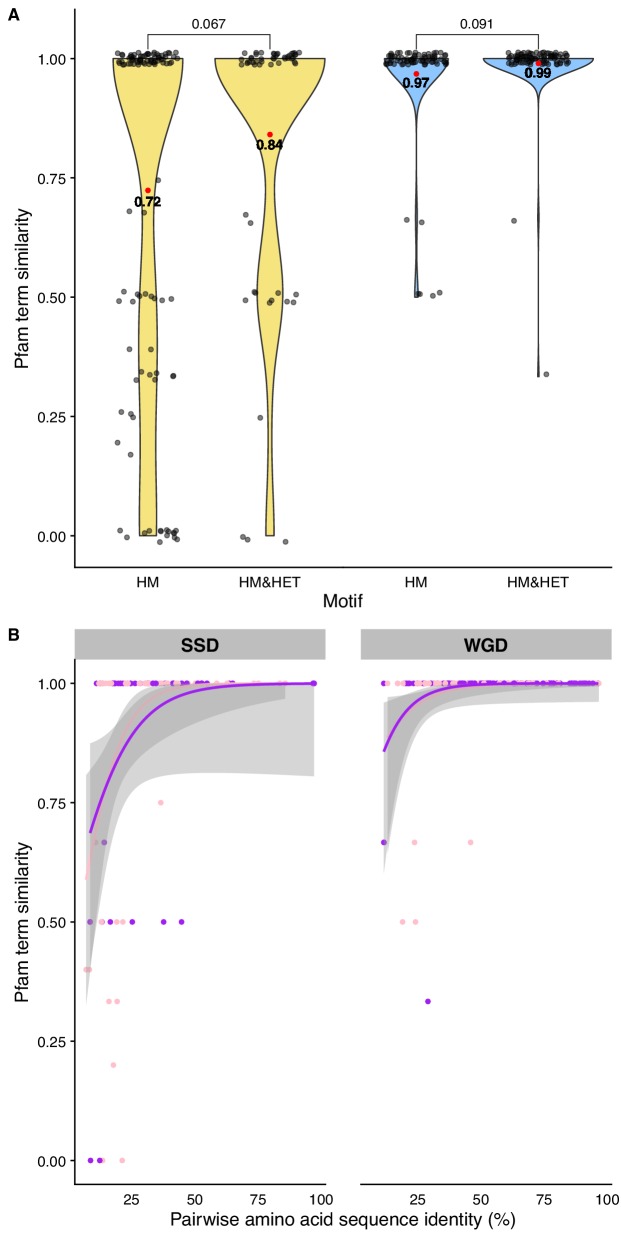
Figure 3—figure supplement 1. Comparison of Pfam domain composition similarity between pairs of paralogs.

Figure 3—figure supplement 1.

(A) Pfam domain composition similarity (Jaccard’s index) between SSDs (yellow) and WGDs (blue) for each interaction motif (HM or HM&HET). (B) Pfam domain composition similarity as a function of pairwise amino acid sequence identity for HM motifs (pink) and HM&HET motifs (purple). Regression lines were smoothed using the GLM function with the quasibinomial family.
Figure 3—figure supplement 2. Comparison of functional similarity between HM and HM&HET pairs.

Figure 3—figure supplement 2.

The similarity of function (100% * Jaccard’s index) between SSDs (yellow) and WGDs (blue) was estimated using GO terms for (A) molecular functions and for (B) biological processes. The similarity of function was also estimated using (C) growth phenotypes and (D) the correlation of genetic interaction profiles. P-values are from Wilcoxon tests.
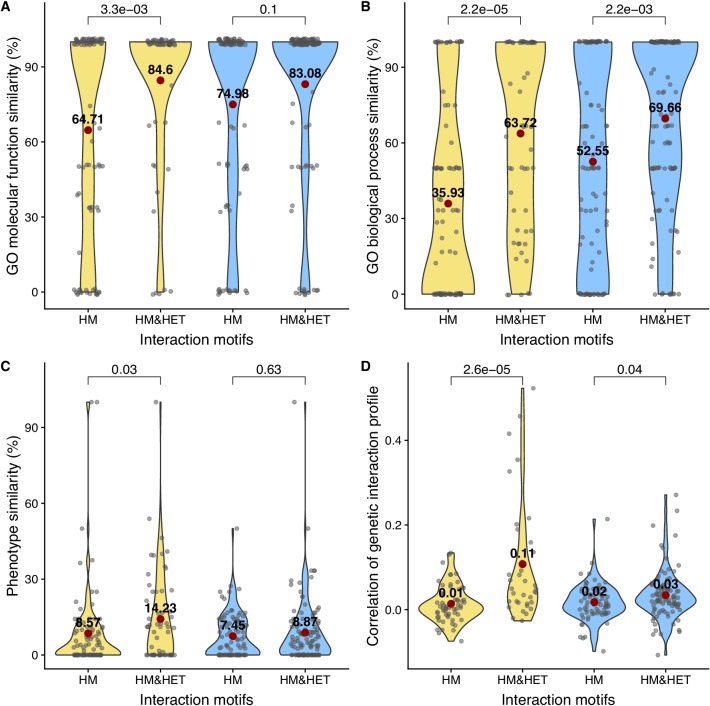
Figure 3—figure supplement 3. Comparison of functional similarity between WGDs, considering homeologs and true ohnologs separately.

Figure 3—figure supplement 3.

The similarity of function (100% * Jaccard’s index) between homeologs (dark blue) and true ohnologs (light blue) was estimated using GO terms for (A) molecular functions and for (B) biological processes. The similarity of functions was also estimated using (C) growth phenotypes and (D) the correlation of genetic interaction profiles. P-values are from Wilcoxon tests.
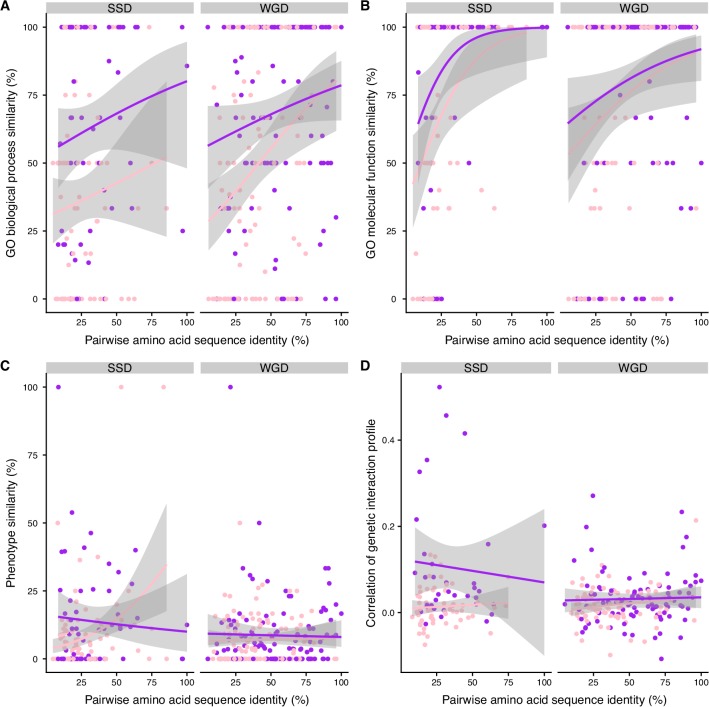
Figure 3—figure supplement 4. Functional similarity between paralogs as a function of their pairwise amino acid sequence identity.

Figure 3—figure supplement 4.

The similarity of function (100% * Jaccard’s index) between paralogs for HM (pink) and HM&HET (purple) as a function of pairwise amino acid sequence identity for SSDs and WGDs. Similarity of function was estimated using (A) molecular functions and (B) biological processes GO terms, (C) growth phenotypes and (D) the correlation of genetic interaction profiles. The regression lines were smoothed using the R geom_smooth function.