. 2019 Aug 27;8:e46754. doi: 10.7554/eLife.46754

Figure 6. Loss of heteromerization between paralogs may result from regulatory divergence.

(A) Correlation coefficients (Spearman’s r) between the expression profiles of paralogs. The data derives from mRNA relative expression across 1000 growth conditions (Ihmels et al., 2004). HM and HM&HET are compared for SSDs (yellow) and WGDs (blue). P-values are from t-tests. (B) Correlation of expression profiles between paralogs forming only HM (pink) or HM&HET (purple) as a function of their amino acid sequence identity. The data was binned into six equal categories for representation only. (C) Similarity of GO cellular component, GFP-based localization, and transcription factor binding sites (100% * Jaccard’s index) are compared between HM and HM and HET for SSDs and WGDs. P-values are from Wilcoxon tests.

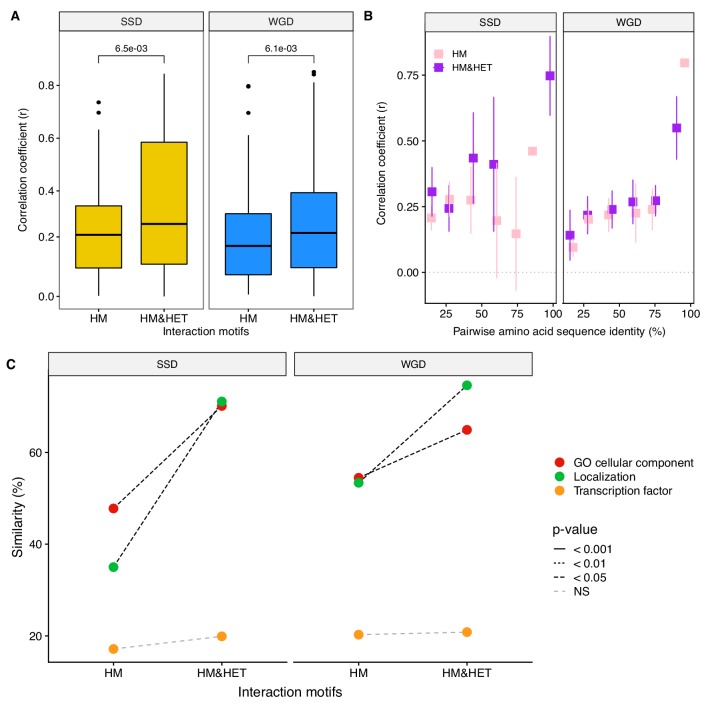
Figure 6.

Figure 6—figure supplement 1. The loss of HETs may result from regulatory divergence (single cell RNAseq data; Gasch et al., 2017).

Figure 6—figure supplement 1.

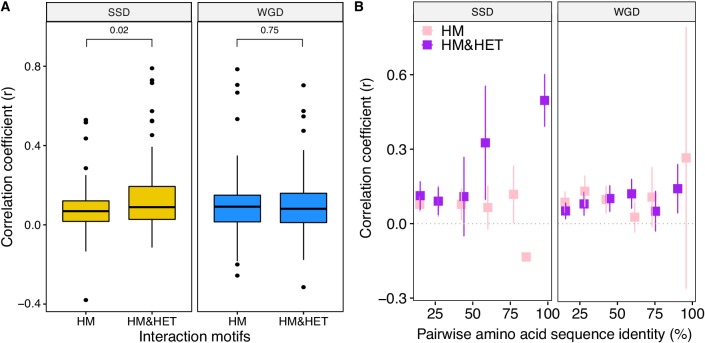
(A) Correlation (Spearman's r) between the expression profile of paralogs are compared among the different interaction motifs for SSDs (yellow) and WGDs (blue). P-values are from t-tests. (B) Correlation of expression profiles between paralogs forming only HM (pink) or HM&HET (purple) as a function of their pairwise amino acid sequence identity.
Figure 6—figure supplement 2. Expression of WGDs and consequences on interaction motifs.

Figure 6—figure supplement 2.

Correlation coefficients (Spearman’s r) between the expression profiles of paralogs (A) from mRNA relative expression across 1000 growth conditions (Ihmels et al., 2004) and (B) from single-cell RNAseq (Gasch et al., 2017) are compared between homeologs and true ohnologs. Correlation coefficients (Spearman’s r) (C) across growth conditions and (D) from single-cell RNAseq data (Gasch et al., 2017) are compared among the different interaction motifs for homeologs and true ohnologs. Correlation coefficients (E) across growth conditions and (F) from single-cell RNAseq as a function of the percentage of pairwise amino acid sequence identity between paralogs forming only HM or HM&HET. (G) Similarity of transcription factor binding sites (100% * Jaccard’s index). (H) Similarity of GO cellular components. (I) Similarity of localization. P-values are from Wilcoxon tests.
Figure 6—figure supplement 3. Interaction motifs and similarity of functions for SSDs and WGDs.

Figure 6—figure supplement 3.

The similarity of regulation (100% * Jaccard’s index) for (A) transcription factor binding sites, (B) GO cellular components and (C) localization. P-values are from Wilcoxon tests.
Figure 6—figure supplement 4. Similarity of regulation between paralogs as a function of their pairwise amino acid sequence identity.

Figure 6—figure supplement 4.

The similarity of co-expression of HM (pink) and HM&HET (purple) pairs was compared while controlling for pairwise amino acid sequence identity for both SSD and WGD. Similarity of co-expression was estimated using (A) cellular component similarity GO term, (B) similarity of localization and (C) similarity of transcription factor binding sites. The regression lines were smoothed using glm method with quasibinomial family.