

Abstract
Background:
Methionine is an essential amino acid found in rich quantities in average American diet such as meats, fish and eggs. Excessive consumption of such food often exceeds the normal requirement of the methionine in our body; which found to be related to the development of neurodegenerative disorders. However, the mechanistic pathways of methionine’s influence on the brain are unclear. The present study is focus on the effects of high methionine, low folate and low vitamin B6/B12 (HM-LF-LV) diet on the dysfunction of neuronal and vascular specific markers in the brain.
Methods:
C57BL6/J male mice (8–10 week old) were fed with HM-LF-LV diet for a 6 week period. Cognitive function of mice was determine by measuring short-term memory using a Novel Object Recognition test (NORT). Neuronal dysfunction were evaluate by measuring the levels of Neuronal nuclear antigen (NeuN), Neuron-specific-enolase (NSE) and Fluoro-jade C(FJC) fluorescence; while cerebrovascular disruption were evaluate by assessing levels of endothelial junction proteins Vascular Endothelial-Cadherin (VE-Cadherin) and Claudin-5 in harvested brain tissue. Cerebrovascular permeability was assess by evaluating microvascular leakage of fluorescently labeled albumin in vivo. Endothelial and Neuronal Nitric Oxide Synthase (eNOS, nNOS) regulation and vascular inflammation (ICAM: intercellular adhesion molecules) were also evaluate in brain tissue. All assessments were conduct at weekly intervals throughout the study duration.
Results:
NORT showed a significant temporal decrease in short-term memory of mice fed on HM-LF-LV diet for 6 weeks compared to the wild-type control group. Our experimental data showed that neuronal dysfunction (decreased NeuN levels and increased FJC positive neurons in brain) was more prominent in HM-LF-LV diet fed mice compared to normal diet fed control mice. In experimental mice, cerebrovascular disruption was found to be elevated as evident from increased pial venular permeability (microvascular leakage) and decreased in VE-Cadherin expression compared to control. Slight decrease in nNOS and increase in eNOS in experimental mice suggest a trend towards the decrease in potential for neuronal development due to the long-term HM-LF-LV diet fed.
Conclusions:
Collectively, our results suggest that a diet containing high methionine, low folate and low vitamin B6/B12 results in increased neuronal degeneration and vascular dysfunction, leading to short-term memory loss. Interestingly, significant neuronal damage precedes vascular dysfunction.
Keywords: Homocysteine, neuronal dysfunction, cerebrovascular damage, Blood-brain barrier, cognitive dysfunction
Introduction
Methionine is an essential amino acid found in high quantities in average American diet such as nuts, beef, lamb, cheese, turkey, pork, fish, shellfish, soy, eggs, dairy, and beans. It is recommended that the average sedentary adult male and female should consume 56g and 46g of proteins respectively to meet daily metabolic requirements. As reported by the World health organization, the estimated daily allowance of methionine for an adult is 13mg/kg of body weight (FAO/WHO, 1973). Homocysteine (Hcy) is a non-essential sulfur-containing amino acid that is derived from methionine metabolism (Obeid and Herrmann, 2006). Folate and vitamins B6 and B12 are essential components in the metabolism of (Hcy), which occurs through remethylation to methionine or transsulfuration to cysteine (Siri et al. 1998). However, excessive consumption of such food often exceeds the normal requirement of the methionine in our body. Experimental data in the field of epidemiology and genetics suggest that people with elevated homocysteine levels are at increased risk of developing dementia, Alzheimer’s disease (AD), Parkinson’s disease, cerebrovascular leakage and stroke (Clarke et al. 1998; Miller et al. 1999; Hankey and Eikelboom, 2001; Mattson and Shea, 2003; Smith, 2008; Lominadze et al. 2006; Hainsworth et al. 2016). Thus, the intake of high methionine, low folate and low vitamin B6/B12 (HM-LF-LV) diet may lead to the development of neurodegenerative disorders. Dietary and nutri-epigenetic studies have begun to illuminate the effect diet has on physiology through their impact on the transcriptional, translational and post-translational mechanisms that governs it. The essential amino acid methionine has become a compound of interest as a growing number of studies are revealing its molecular role in physiological remodeling. Previous studies have established a causal relationship between high methionine levels and complications such as arteriosclerosis, osteoporosis, growth retardation, uremia, vascular remodeling and hepatoxicity (Yang et al. 2015; Sabour et al. 2016; Harper et al. 1970; Mori et al. 2000; Chaturvedi et al. 2016; Gomez et al. 2009). Moreover, studies have also identified high methionine as a risk factor for developing cognitive disorders (Miller, 2003; Zhuo et al. 2010). Some studies indicate that methionine alone also poses toxic effects (Harper et al. 1970; Troen et al. 2007). It has been shown that oral consumption of methionine raises methionine levels in the brain via L-neutral amino acid transporters in blood brain barrier (Oldendorf and Szabo, 1976; Young et al. 2005). Therefore, methionine consumption must be regulated to maintain normal brain health.
Potential mechanisms explaining methionine’s relationship with cognitive disorders include DNA methylation and oxidative stress from high homocysteine levels examined in CBS mutant (CBStm1unc) and Alzheimer’s-disease (Tg2576) mouse model studies (Zhuo et al. 2010; Jacobsen, 2000) However, the mechanisms explaining methionine’s influence on cognitive function are not fully understood. In particular, a direct effect of HM-LF-LV diet on normal animal or human brain physiology is not clear. A longitudinal understanding of the progression of methionine’s influence on neuronal and neurovascular function is essential to develop more targeted therapies against HM-LF-LV-induced cognitive dysfunction. In this study we followed the progression of methionine’s influence on neuronal and cerebrovascular function in relation to cognition in wild type mice. WTC57BL/6 mice were fed with HM-LF-LV (2-fold increase) over a six-week period, during which we assessed: neuronal density and function, cerebrovascular integrity and permeability, and short-term memory. This is an important area of research focusing on the overall neuronal, vascular and cognitive aspects linking change in dietary habit. The role of high methionine, low folate and low vitamin B6/B12 diet will be evaluated in the context of neuronal, vascular and cognitive aspects.
Methods
Animals and experimental design
Wild-type male mice (strain: C57BL/6J; age: 8–10 week) were obtained from Jackson Laboratory (Bar Harbor, ME) and kept in a suitable environmental conditions (12:12-h light-dark cycle, 22–24°C) at the animal care facility of our University. A total of 30 male mice were enrolled for the current study and were divided into either control (n =15) or experimental groups (n =15). Experimental mice were fed with a HM-LF-LV [methionine enriched (1.2%), low folate (0.08mg/Kg), low vitamin B6 (0.01mg/Kg) and B12 (10.4 μg/Kg] diet (Harlan Laboratories, Cat No.TD.97345) for one week to six weeks. The control mice were fed with standard food and water ad libitum. All animal procedures were reviewed and approved by the Institutional Animal Care and Use Committee (IACUC) at the University of Louisville School of Medicine. Moreover, methods and general guidelines for animals use were followed according with Animal Care and Use Program Guidelines of the National Institutes of Health.
Antibodies and Reagents
The antibodies used in the following experiments were: anti-Neu, anti-NSE, anti-nNOS, anti-eNOS anti-ICAM and anti-VE-Cadherin brought from Abcam (Cambridge, MA). Anti-Claudin-5 conjugated with Alexa Fluor 488 brought from Invitrogen (Carlsbad, CA). Anti-GAPDH from Millipore (Temecula, CA). Alexa Fluor 488-conjugated bovine serum albumin (BSA-Alexa Fluor-488) and secondary antibodies conjugated with Alexa fluor 488,Texas Red and 4’,6-Diamidino-2-Phenylindole, Dihydrochloride (DAPI) were purchased from Invitrogen (Carlsbad, CA). Radio-Immunoprecipitation Assay buffer was from Boston BioProducts (Worcester, MA); while Protease-Inhibitor Cocktail and BSA-Fluorescein Isothiocyanate (FITC) were from Sigma-Aldrich Chemicals (St Louis, MO). For western blot experiments. All buffers were prepared from synthesized 10X stock solutions.10X Running Buffer (60.4g Tris base, 288g glycine and 20g Sodium dodecyl-sulfate in 2L of sterile ddH2 O), 10X Transfer Buffer (288g glycine, 60.4g Tris base, 1% SDS in 2L of sterile ddH2 O) and 10x Tris Buffered Saline (TBS) (24.2g Tris base, 80g NaCl in 1L of sterile ddH2 O; pH 7.4). Western blots were developed in Luminata Forte Western HRP Substrate (Millipore, Billerica, MA).
Novel Object Recognition Test (NORT)
The Novel Object Recognition Test (NORT) is a commonly used behavioral assay for the investigation of various aspects of learning and memory in mice (Lueptow, 2017). The detail of experimental procedure was described in our previously published literatures (Kamat et al. 2013). In brief, mice were placed individually in a testing chamber with beige walls for a 5 min habituation interval and returned to home cage. Thirty minutes later mice were placed in the testing chamber for 10 min with two identical objects (acquisition session). Mice were returned to home cages and one day later placed back into the testing chamber in the presence of one of the original objects and one novel object (recognition session) for 5 min. The chambers and objects were cleaned with ethanol between trials. Exploratory behavior was defined as sniffing, touching and directing attention to the object. Expected normal behavior would be, with a short delay between Acquisition and Retention trials, that the animal explores the novel object for a longer period of time than the familiar object. A “memory score is calculated for each animal, defined as the time spent in exploring the novel object as a percentage of total time exploring both objects during the retention trial. For the acquisition session, the recognition index (RI) was calculated as (time exploring one of the objects/the time exploring both objects). For the recognition session, the RI was calculated as (time exploring the novel object/the time exploring both the familiar and novel object). Discrimination index (DI) was also calculated (DI = (Novel Object Exploration Time/Total Exploration Time) − (Familiar Object Exploration Time/Total Exploration Time) ×100) in mice. In our laboratory, NORT was performed using a Top Scan behavioral analyzing system (Version 3.00 by Clever Sys Inc; Reston, VA, USA). The data for the behavioral assessment was expressed by calculating DI. Lower the DI indicates less time spent with the novel object; thus indicates short-term memory impairment (Leger et al. 2013). Overall, the NORT is a relatively low-stress, efficient test for memory in mice, and is appropriate for the detection of neuropsychological changes following pharmacological, biological, or genetic manipulations (Lueptow, 2017).
Cranial Window Preparation and Microvascular Leakage Observation
Prior to create a cranial window for the observation of microvascular leakage, mouse was anesthetized with pentobarbital sodium (50 mg/kg i.p.). A tracheotomy to maintain a patent airway and a carotid artery cannulation were performed. Mouse was briefly placed with heads fastened in place in a stereotaxic mount (World Precision Instruments, Sarasota, FL, USA). A heating pad was used to maintain body temperature of the mice at 37°C. Mean arterial blood pressure and heart rate were continuously monitored through a left carotid artery cannula (polyethylene tubing PE-10) connected to a transducer and a blood pressure analyzer (CyQ 103/302, Cybersense, Lexington, KY, USA). Scalp and connective tissues were removed over the parietal cranial bone. A 14-mm hole was made in the skull on the area posterior-to and lateral-to the bregma suture using a high-speed microdrill (Fine Scientific, Foster City, CA) according to the previously published procedures (Lominadze et al. 2006; Muradashvili et al. 2014). While drilling, the skull was repeatedly wetted with sterile saline to remove bone dust and to prevent overheating. The created skull flap was gently removed with a pair of forceps (Dumont & Fils #5-Fine Forceps, Switzerland) and the window carefully cleaned with a few drops of 1×PBS and a cotton swab. With a pair of Forceps (Dumont #5), the duramater was then carefully removed without puncturing the cortex. The surface of the exposed pial circulation was continuously superfused with 1×PBS maintained at 37°C by dual automatic temperature controller (Warner Instrument Corporation, Hamden, CT, USA).
Then, the mouse was fastened to the stereotaxic instrument and positioned on the stage of an Olympus BXG61WI microscope (Olympus, Tokyo, Japan) so the exposed pial circulation could be observed by incident light. Following the surgical preparation, there was a 30 min equilibration period prior to imaging. Before each experiment, auto-fluorescence of the observed area was recorded over a standard range of camera gains. Fluorescein isothiocyanate (FITC)-conjugated BSA (BSA-FITC-albumin, 300 mg/mL) was infused through carotid artery cannula with a syringe pump (Harvard Apparatus, Holliston, MA) at 40 μl/min and allowed to circulate for 5 min. In vivo imaging was used to examine the exposed area of the skull. After ensuring that spontaneous leakage of BSA did not occur, venules were identified by the topology of the pial circulation and blood flow direction. Selected third order venular segments were recorded and used as the baseline. After the baseline reading was obtained, images of the venular segments were recorded. The area of interest was exposed to blue (488 nm) light for 10–15 sec. The microscope images were acquired by an electron-multiplying charge-coupled device camera (Quantem 512SC, Photometrics, Tucson, AZ) and image acquisition system (Slidebook 5.0, Intelligent Imaging Innovations, Inc., Philadelphia, PA). The lamp power and camera gain settings were held constant during the experiments. Data were interpreted with the software provided with the instrument and Image-Pro Plus 6.3 software (Media Cybernetics, Bethesda, MD). Leakage of FITC-BSA was assessed by changes in the ratio of fluorescence intensity in the interstitium to that inside the vessel. Three vessels in each animal were observed and analyzed. The results were presented as a percentage of the baseline. The diameter of each venule under observation was also measured.
Collection of Plasma and Assessment of Total Homocysteine Levels
At the time of sacrifice, blood samples were collected into tubes, placed on ice immediately and plasma was isolated by centrifugation at 2300 g for 15 min at 4°C and stored at −80°C until use. Total plasma homocysteine was assayed using a kit (Catalog #80440; Crystal Chem, Inc, Downers Grove, IL, USA) according to the manufacturer’s instruction.
Mouse Brain Tissue Collection and Preparation
At the completion of diet treatment and functional tests, animals were euthanized with an overdose dose of Tribromoethanol (TBE), and intact brain samples were harvested. The brain tissue samples were washed in Phosphate-buffered saline (PBS, pH 7.4) and stored in eppendorf tubes at −80°C, until use. In the case of brain; tissue collected from mice used in vascular permeability tests, these mice were infused with PBS through the left ventricle of the heart until complete exsanguination, before brain extraction. To assess the content of NSE, Neun, ICAM, VE-Cadherin, eNOS and nNOS expression in brain. Brain samples were digested in Radio-Immunoprecipitation Assay (RIPA) buffer (1 g of tissue/1 mL of RIPA buffer) in the presence of protease-inhibitor cocktail (Sigma Cat No. P8340). The samples were homogenized using a Kontes Glass Tissue Homogenizer. After homogenization, samples were centrifuged at 16,000xg for 20 minutes. The supernatant was repeatedly centrifuged at 16,000 × g for 10 minutes until all solid debris, and fatty tissue was remove. The supernatant was collectedand used for total protein estimation by Bradford assay. The remaining supernatant was storeed at −20°C for western blot analysis. For IHC analysis, animals euthanized with an anesthetic overdose of TBE were immediately infused with PBS through the left ventricle until exsanguination. Brain samples were collected, mounted in tissue freezing Medium (TBS Cat No.TFM-5) and stored at −80°C to create frozen blocks for cryo-sectioning. The samples were cryosectioned with a Leica CM 1850 Cryocut (Bannockburn, IL, USA) into 20-μm thick slices on glass slides and processed for confocal imaging.
Western Blotting of Brain Tissue
Western blot analysis for proteins related to vascular permeability, neuronal density and degeneration were performed as followed by the slandered procedures (Kamat et al. 2013). Briefly, protein was extracted using 1x RIPA buffer. Equal amount of proteins (25 µg) from brain were fractionated by SDS-PAGE and transferred onto the PVDF membrane (BioRad, Hercules, CA) by wet transfer method. Nonspecific sites were blocked with 5% non-fat dry milk in TBS-T (50 mM Tris–HCl, 150 mM NaCl, 0.1% Tween- 20, pH 7.4) for 1 h at room temperature and the membrane was washed with washing buffer (pH 7.6, TBS, 0.1% Tween 20) for 3 times,10 min each. The blot was then incubated for overnight at 4°C with appropriate primary antibody in blocking solution according to the supplier’s specific instructions. The blots were washed with TBS-T (3 times, 10 min each) and incubated with appropriate HRP- conjugated secondary antibody for two hours at room temperature. Membranes were developed with Luminata Forte HRP substrate (Millipore, Billerica, MA) in a Bio-Rad Molecular imager (ChemiDoc XRS+, Hercules, CA, USA). The membranes were stripped and re-probed with GAPDH as a loading control. Protein signals were measured by observing integrated optical density (IOD) of bands and analyzed using ImagePro Plus software. Relative levels of protein expression between groups were assessed by comparing the calculated IOD ratio of bands-of-interest and their respective GAPDH bands. Results were presented as a ratio of the protein of interest to the respective GAPDH band.
Immunohistochemical Analysis
Immunohistochemistry (IHC) of VE-Cadherin and Claudin-5 were used to detect vascular permeability in brain tissue sections of wild-type control and HM-LF-LV diet fed mice. Immunohistochemical analyses of brain tissue sections were done according to our previously published protocols (Kalani et al. 2015; Kalani et al. 2016). In brief, glass slides with cryosectioned brain slices were thawed at 37 °C. Excess freezing media around the sections were removed. The sections were post-fixed in chilled absolute methanol in a coupling jar for 10 minutes. The slides were removed, excess methanol wiped from the edges, and coated with a hydrophobic barrier drawn around the sections using a hydrophobic pen. The sections were then permeabilized with Triton X-100 in a slide staining tray/moisture chamber for 15 minutes. Triton X-100 was carefully removed from the slides with a pipette, the hydrophobic barrier redrawn and the sections were blocked with 5% BSA for 1hr at room temperature (RT) in a slide staining tray/moisture chamber. Blocking solution was removed and the sections were incubated with primary antibody Claudin-5 (dilution 1:1000 in TBS-Tween) and VE-Cadherin (dilution 1:1000 in TBS-Tween) overnight at 4°C in a slide staining tray. The unbound antibody was washed in TBS with gentle rocking in a coupling jar and the sections were incubated with their respective fluorescent dye-conjugated secondary antibodies for 1 hour at RT. The slides were further stained with 4’,6-diamidino-2-phenylindole (DAPI) (dilution 1:10,000 in TBS-Tween) for 15 minutes, washed in TBS and mounted with anti-fade mounting media and a cover slip. The immunostained sections were then visualized using a laser scanning confocal microscope (60x objectives, FluoView 1000, Olympus, PA, USA). Fluorescence intensity was measured with Image-Pro Plus analysis software, (Media Cybernetics, Rockville, MD, USA).
Fluro Jade-C (FJC) Staining in Brain Section for the Assessment of Neuronal Degeneration
Fluoro-Jade C (FJC) labeling in the brain section was performed using a standard protocol (Kamat et al. 2013; Schmued et al. 2005; Kalani et al. 2014), with slight modification. Briefly, 25 μM paraffin-embedded brain sections were cut. The sections were deparaffinized by two 5-min washes in xylene, rehydrated through a graduated alcohol series (100, 90, 70, 50, 30 %) each for 5 min, and finally washed for 2 min in distilled water. The sections were then transferred to 0.06 % potassium permanganate solution for 10 min and rinsed in distilled water for 2 min. After that, the sections were incubated for 20 min in a 0.0001 % solution of FJC (Sigma Aldrich, USA). FJC was made immediately before use by diluting a stock solution of 0.01 % FJC by 100-fold in 0.1 % acetic acid. The sections were eventually dried at 37 °C and mounted with distyrene plasticizer xylene (DPX). The fluorescent signal was visualized using a confocal laser scanning microscope with an excitation wavelength of 488 nm.
Statistical Analysis
Data analyses and graphical presentation were performed with GraphPad InStat 3 and GraphPad Prism, version 6.07 (GraphPad Software, Inc., La Jolla, CA). The data are presented as mean ± SD (standard deviation). The experimental groups were compared by one-way analysis of variance (ANOVA) and Bonferroni’s multiple comparison tests were used to compare all group means. Statistical significance was assigned at p < 0.05. Univariate analysis were conducted to find any corelation between markers of interest and the duration of HM-LF-LV diet treatment via Spearman’s Rank correlation analysis using GraphPad InStat 3 software. The correlation analysis data are presented as Rho (ρ) value with p<0.05 considered statistically significant.
Results
Effect of HM-LF-LV Diet on Memory Impairment
Figure 1 shows the experimental approach and the corresponding results in the form of Discrimination Index (DI) for the NORT. NORT showed a significant temporal decrease in short-term memory of mice fed on HM-LF-LV diet. NORT data showed significantdecrease in DI values at weeks 2 (0.54 ± 0.11), weeks 4 (0.59 ± 0.11) and weeks 6 (0.431 ± 0.099) of HM-LF-LV diet compared to that in wild-type control mice (0.730 ± 0.103). The highest decrease was observed in 6 weeks, compared to 2 weeks and 4 weeks of HM-LF-LV diet (Fig.1).
Figure 1:
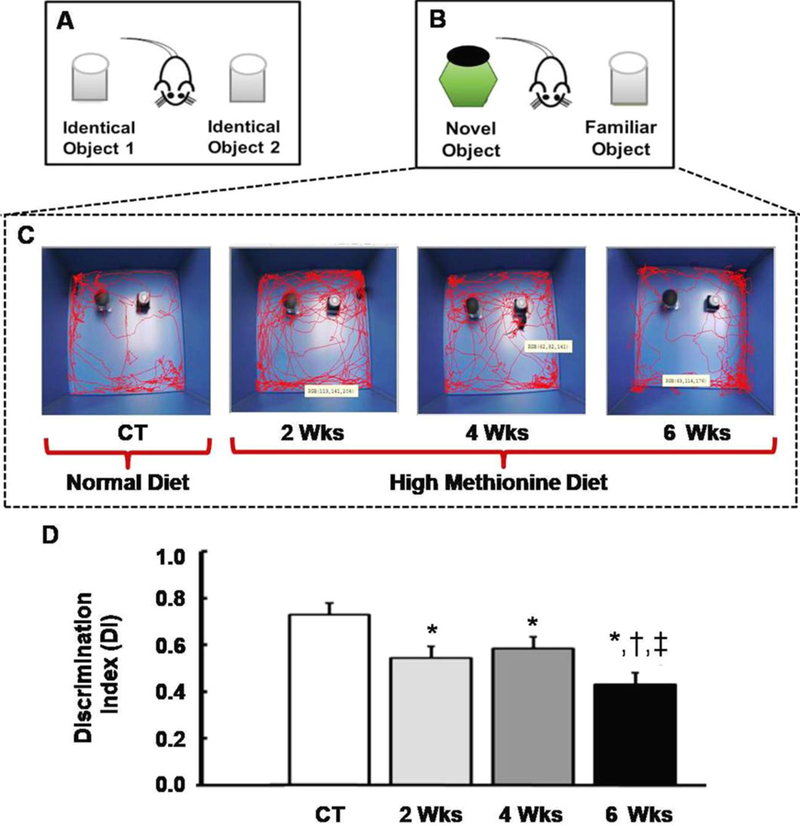
Schematic diagrams showing the experimental set ups and corresponding results for the NORT. (A) Animal training and familiarization with two identical objects, prior to short-term memory assessment. (B) Setup for short-term memory assessment; distinctly different by the replacement of a familiarized object with a new (novel) object. (C) Live infrared tracking showing interaction between mice and objects. CT represents control/wild type mice with normal diet and 2Wks-6Wks represents mice fed with HM-LF-LV diet for 2 weeks, 4weeks and 6 weeks respectively. (D) Representational graph showing the ability of mice to discriminate between novel object and familiar object based on number of interaction events between objects. Results are expressed as mean ± SD. *,†,‡, p < 0.05 considered significant in Bonferroni multiple comparison, one-way ANOVA test. *, compared to control; †, compared to 2 weeks; ‡, compared to 4 weeks. Data analyzed from five independent experiments (n = 5).
Effect of HM-LF-LV Diet on Total Plasma Homocysteine Levels
To investigate HM-LF-LV diet on homocysteine levels, we have examined the levels of total homocysteine (tHcy) in the blood plasma in control versus different groups of experimental mice. Our data clearly indicated that tHcy levels were significantly increased in 4weeks and 6 weeks in HM-LF-LV diet fed mice compared to that in 2 weeks and in control animals (Fig.2A). There was no statistical difference between control and 2 week HM-LF-LV diet fed mice. We noticed highest levels of tHcy in 6 weeks of HM-LF-LV diet fed mice compared to all other groups.
Figure 2.
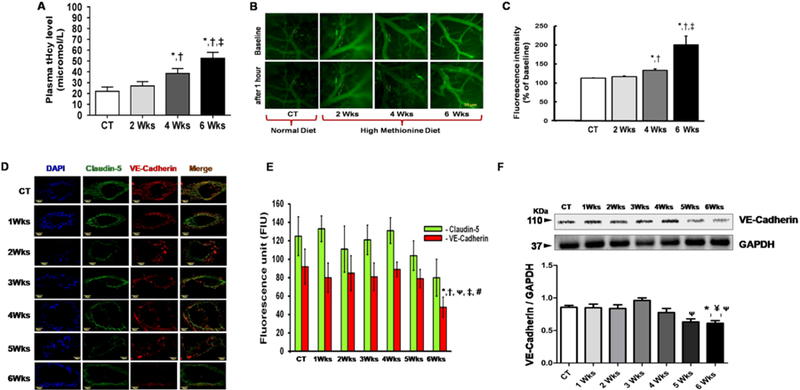
Representative data showing total plasma homocysteine levels and cerebrovascular disruption in mice after HM-LF-LV diet fed in comparison to control mice. (A) Histogram showing comparison of total plasma homocysteine levels in experimental mice. (B) Images showing fluorescent protein leakage from pial vessels into brain parenchyma, in vivo after 5 mins (baseline) and 1hour of FITC-BSA circulation for control mouse and mice fed with HM-LF-LV diet for 2 weeks, 4 weeks and 6 weeks, respectively. (C) Histogram showing difference in fluorescence intensity after 1 hour inside the vessel lumen and outside the vessels relative to baseline readings taken after 5 mins. (D) Confocal immunohistochemistry images (60 × magnification) showing Claudin-5 (in Alexa Fluor 488- green) and VE-Cadherin (in Texas Red) proteins in cross sectioned cerebral vessels in cryosectioned brain samples from control mice and mice fed with HM-LF-LV diet for 1–6 weeks. Merged images are shown in the rightmost lane, along with DAPI-stained vascular endothelial cell nuclei (leftmost blue lane). (E) Histogram showing analyzed fluorescence intensity of claudin-5 (green bars) and VE-Cadherin (red bars) in control and HM-LF-LV diet fed mice. (F) Representative western blot image and corresponding histogram showing levels of VE-Cadherin in brain tissue of control and HM-LF-LV diet fed mice. Bars represent standard deviation of mean values. *,†,ᴪ,‡, #, p < 0.05 considered significant in Bonferroni multiple comparison, one-way ANOVA test. *, compared to control; ¥, compared to 1 weeks; †, compared to 2 weeks; ᴪ, compared to 3 weeks; ‡, compared to 4 weeks and #, compared to 5 weeks. Data analyzed from five independent experiments (n = 5).
Effect of HM-LF-LV Diet on Vascular Injury and Blood Brain Barrier Disruption
We evaluated cerebrovascular leakage was assessed by measuring the fluorescence of intracarotidally infused BSA-FITC in brain parenchyma after 1hr, relative to fluorescence measurements in venules and respective baseline readings collected 5 mins (baseline) after infusion (Fig.2B–C). Three vessels within each animal were observed and analyzed. All Baseline readings showed that there was no spontaneously leakage from the mechanical infusion of BSA-FITC. Body weight of animals used in the study varied from 25 to 29 g. Mean arterial blood pressure did not change in experimental mice after FITC-BSA infusion. During the observation period venular diameters remained similar in experimental animals. Pial venular permeability to FITC-BSA was significantly increased in 4weeks and 6 weeks in HM-LF-LV diet fed mice compared to that in 2 weeks and in control animals. There was no statistical difference between control and 2 week HM-LF-LV diet fed mice. The greatest protein leakage was demonstrated in 6 weeks in HM-LF-LV diet fed mice compared to all other groups (Fig.2B–C).
We further assessed endothelial junction proteins Claudin-5 (tight junction) and VE-Cadherin (adherent junction), because these actively regulate selective barrier functions across the vessel walls. Immunohistocheminal analysis of Claudin-5 and VE-Cadherin data are shown in Figure 2D–E. Our data showed a significant decrease in VE-Cadherin fluorescence intensity at 6-week of HM-LF-LV diet fed mice compared to control and other groups (Fig.2D). There was no significant difference in fluorescence intensity of Claudin-5 fluorescence intensities in control and different weeks of HM-LF-LV diet fed mice (Fig.2C–D). We further investigated VE-Cadherin protein levels via western blot analysis (Fig.2F). We did not notice any change in VE-Cadherin protein levels between normal fed control mice and HM-LF-LV diet fed mice for up to 2 weeks. A slight increase in VE-Cadherin protein levels was noticed at 3 weeks and then progressively decreased at 4th, 5th and 6th weeks of HM-LF-LV diet. Similar to immunofluorescence data, a significant decrease in VE-Cadherin protein levels were found in 5 weeks and 6 weeks HM-LF-LV diet fed mice compared to control and 3 weeks group (Fig.2F).
Effect of HM-LF-LV on Neuronal Loss
To investigate HM-LF-LV diet induced neuronal dysfunction, we have examined the levels of neuronal-related proteins NeuN and NSE in the brain tissue via western blot analysis (Fig.3A–B). Moreover, to examine neuronal degeneration, we stained sections of mouse brain with Fluoro Jade C (FJC), a fluorochrome that binds specifically to the degenerating fibers and cell bodies of neurons (Fig.3C–D). Western blot data of NeuN showed a significant decrease in protein expression level after 5 weeks and 6 weeks of HM-LF-LV diet fed when compared to normal fed control mice (Fig.3A). We did not notice any significant change in the levels of another neuronal marker NSE in both control and HM-LF-LV diet fed mice (Fig.3B). A large number of FJC-positive cells with higher fluorescence intensity were observed in brain section of HM-LF-LV diet fed mice in comparison to control mice (Fig.3C). There was a significant increase in fluorescence intensity at 4 weeks and 6 weeks of mice fed with HM-LF-LV diet compared to normal diet. Moreover, HM-LF-LV diet induced neuronal degenerations were found to be significantly higher temporarily at 4 weeks and 6 weeks when compared to 2 weeks. However, there was no significant difference in FJC fluorescence intensity between Control and 2-week met-diet fed mouse brain sections (Fig.3C–D).
Figure 3.
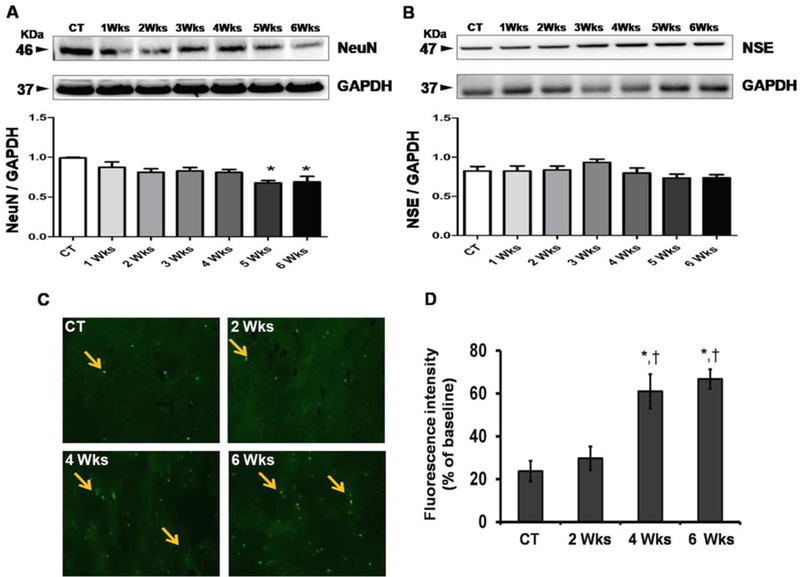
Representative data of neuronal dysfunction in control and HM-LF-LV diet fed mice. (A-B) Western blot images and their corresponding densitometric analysis of the levels of NeuN and NSE in different mice groups; (C) Fluorescence microscopic images of control mouse and mice fed with HM-LF-LV diet. Arrows indicating cell bodies of neurons with neuronal degeneration. (D) Histogram showing comparative analysis of fluorescence intensities between control and HM-LF-LV diet fed mice. Bars represent standard deviation of mean values. *,†, p < 0.05 considered significant in Bonferroni multiple comparison, One-Way ANOVA test. *, control vs. HM-LF-LV diet fed mice, †, 2 weeks vs. 4 and 6 weeks. Data analyzed from five independent experiments (n = 5).
Effect of HM-LF-LV on NOS Regulation and Vascular Inflammation
Through western blot analysis of brain tissue, we determined eNOS and nNOS levels that impart main roles in regulating vascular tone and glia and neuronal integrity. We also evaluate a marker for vascular inflammation (ICAM) in brain tissue in both control and HM-LF-LV diet fed mice (Fig.4). Western blot data of nNOS showed no significant differences between normal diet fed control group and HM-LF-LV diet fed experimental group of mice, although we noticed decrease in nNOS levels in experimental mice group (Fig.4A). Decreased nNOS levels suggest a decrease in potential for neuronal development and decreased nitric oxide-mediated long-term regulation of synaptic transmission and memory formation (Fig.4A). Western blot data of eNOS showed no significant differences between normal diet fed control group and HM-LF-LV diet fed experimental group of mice. However, the data trend showed some increase in 4, 5 and 6 week after fed with HM-LF-LV diet compared to control and other groups (Fig.4B) suggesting that a statistical increase in eNOS levels could be observed if the dietwere extended beyond the 6 week time frame. Levels of ICAM showed no significant difference between control and HM-LF-LV diet fed groups (Fig.4C).
Figure 4.
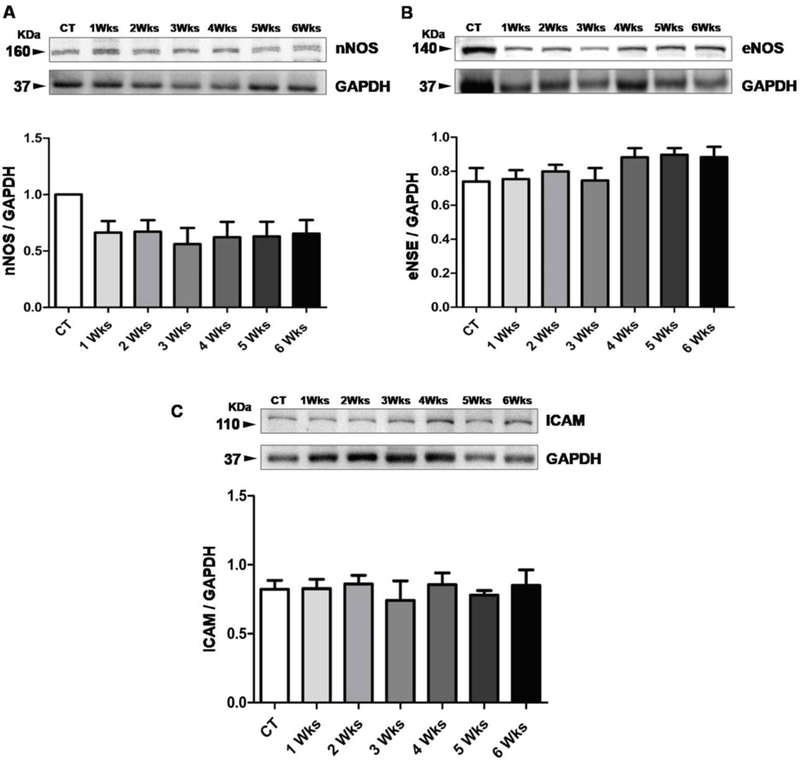
Representative data of NOS Regulation and vascular inflammation. (A-B) Comparative western blot analysis of regulation of nNOS and eNOS in control mice and experimental mice fed with HM-LF-LV diet. (C) Comparative western blot analysis of ICAM protein for the detection of vascular inflammation in normal fed control mice and experimental mice fed with HM-LF-LV diet. Bars represent standard deviation of mean values. *, p < 0.05 considered significant in Bonferroni multiple comparison, One-Way ANOVA test. *, control vs. HM-LF-LV diet fed mice. Data analyzed from five independent experiments (n = 5).
Correlation between Duration of HM-LF-LV Diet and Markers of Interest
The duration of HM-LF-LV diet in experimental mice group strongly correlated with neuronal disruption as evident from significant positive correlation with FJC positive neutrons and significant negative correlation with NeuN in Spearman’s rank correlation analysis (Table 1). On the hand, the duration of HM-LF-LV diet correlated positively with fluorescent protein leakage from pial vessels into brain parenchyma (FITC-BSA) and correlates negatively with Claudin-5 and VE-cadherin expression – suggesting a strong correlation of HM-LF-LV diet with cerebrovascular disruption. We did not find any significant correlation between the duration of HM-LF-LV diet and neuronal NOS (nNOS) but endothelial NOS (eNOS) found to be positively correlated with HM-LF-LV diet. Likewise, the vascular inflammation marker (ICAM) expression correlated positively with the duration of HM-LF-LV diet (Table 1).
Table 1.
Spearman’s Rank Correlation Analysis to test a correlation between markers and the duration of HM-LF-LV diet
| Molecular markers | Duration of HM-LF-LV diet | ||
|---|---|---|---|
| Spearman’s rho (ρ) value | 95 % CI | p-value | |
| Neuronal disruption | |||
| FJC-positive neurones NeuN in brain NSE in brain |
0.8771 −0.8108 −0.1853 |
0.7030 to 0.9520 −0.9026 to −0.6485 −0.4962 to 0.1677 |
< 0.0001* <0.001* 0.2865 (NS) |
| Cerebrovascular disruption | |||
| FITC-BSA Claudin-5 VE-Cadherin |
0.9757 −0.5835 −0.4816 |
0.9366 to 0.9908 −0.7717 to −0.3013 −0.7073 to −0.1667 |
< 0.0001* 0.0002* 0.0034* |
| NOS regulation and vascular Inflammation | |||
| nNOS eNOS ICAM |
0.07598 0.7857 0.3571 |
−0.2735 to 0.4078 0.6065 to 0.8890 0.01680 to 0.6233 |
0.6644 (NS) < 0.0001* 0.0352* |
, p<0.05 considered significant in Spearman’s Rank Correlation analysis
Discussion
Consistent with previous studies (Miller, 2003; Young et al. 2005), our study confirms that methionine cycle imbalance is detrimental to brain health. In this study we showed that consumption of HM-LF-LV diet promotes neuro-vascular dysfunction through blood- brain- barrier (BBB) damage by increasing the plasma homocysteine levels. Methionine’s also a key regulatory molecule supported by the diet-derived cofactors and precursors such as cobalamin (Vitamin B12), pyridoxine (Vitamin B6) and folate. Relative to protein intake, the average diet in the United States can often be low in these cofactors. This imbalance influences free-methionine and homocysteine levels in the body which may be responsible for the development of neurodegenerative diseases. In human, three ranges of hyperhomocysteinemia are defined as follows: mild (16 –30 µmol/L), intermediate (31– 100 µmol/L), and severe (100 µmol/L). However, it is known that only a fraction of total plasma Hcy is in the reduced form in brain through several mechanisms, such as recycling vitamin B12, catabolism through cystathionine beta synthase enzyme to cystathionine (Zhang et al. 2017; Cheng and Kaplowitz, 2004). Genetic, environment or diet were the common factor to cause of HHcy (Ganguly and Alam, 2004; Basati et al. 2014). A significant correlation has been found between risk of Alzheimer’s disease and high plasma levels of homocysteine, as well as low levels of folic acid, and vitamins B6 and B12. In this study, a moderate level of HHcy in WT mice was induced by6-week HM-LF-LV diet. Further studies need to be performed to assess whether this will also reduce the risk of cognitive diseases and/or improve cognitive functioning.
Methionine is a key amino acid of human’s diet (Irwin and Hegsted, 1971; Millward, 1990). However, many reports provide evidence that conversely, severe methionine deficiency might cause dementia (Koladiya et al. 2008). Our study using NORT behavioral test suggests that HM-LF-LV diet mice have impaired short-term memory function related to the recognition of a novel object (Fig.1). Interestingly, our short-term memory assessment data obtained through NORT study showed a drastic decrease in short-term memory in mice fed with HM-LF-LV diet for 2, 4 and 6 weeks relative to normal diet fed control mice (Fig.1). It is also evident from our study that longer the duration of HM-LF-LV diet fed, the severity of short term memory loss increases.
Vascular junction proteins play a very important role in regulating BBB integrity (Kalani et al. 2015). Blood-brain barrier integrity is essential for normal brain function. Two structural proteins of the blood-brain barrier, VE-cadherin and claudin-5, were of particular interest in this study. Western blot data analysis showed a significant decrease in VE-Cadherin expression in mice fed with HM-LF-LV diet for up to 6 weeks when compared to normal fed mice (Fig.2E). This was further confirmed by immunohistochemistry data that showed a significant decrease in VE-Cadherin in mice fed with HM-LF-LV diet for 6 weeks (Fig.2C–D). No statistical difference in claudin-5 expression was observed (Fig.2C–D). Our results suggest a greater sensitivity of the adheren junction protein VE-cadherin to a HM-LF-LV diet than the tight junction protein, Claudin-5. This may also be influenced by the drastic increase in pial vessel leakage observed in the brains of experimental mice fed with HM-LF-LV diet for 6 weeks (Fig.2A–B). The relative decrease in VE-Cadherin expression in mice on the diet for 6 weeks suggests an increase cerebrovascular permeability from consumption of the diet, which was confirmed by in vivo BSA-FITC leakage observations that showed a drastic increase in BSA leakage from pial venules in mice on the diet for 6 weeks. Collectively our results suggest that HM-LF-LV diet causes decreased structural and functional integrity of the blood-brain barrier (Fig.2A–B).
Loss of BBB integrity inthe wild type mice fed with HM-LF-LV diet indicated loss of neurons, which was confirmed by FJC, NeuN and NSE expressions. FJC and NeuN have previously been used as specific markers for neuronal damage (Kalani et al. 2014). Our results showed a significant decreased in neuronal protein NeuN among wild type mice fed with HM-LF-LV diet for up to 6 weeks when compared to normal fed mice (Fig.3A). Clinical studies have shown NSE levels to be a good indicator of long and short-term neurological outcome in stroke patients (Lu et al. 2015) as well as a potential biochemical marker of early stage dementia (Shen and Gao, 2015). A decrease in NSE levels indicates poor neuronal outcome. Although our NSE western blot data did not show any significant difference in NSE levels between normal fed control mice, and mice fed with HM-LF-LV diet for up to 6 weeks (Fig.3B). In addition, FJC staining demonstrated that the number of degenerative neurons in the wild type mice fed with HM-LF-LV diet (Fig.1C–D).
In vivo studies showed that mild and severe hyperhomocysteinemia is associated with impaired vasodilation (Miller, 1999; Wang et al. 2002). These findings are consistent with impairment in NO bioavailability. However, some studies show that high concentrations of Hcy increase NO production (Upchurch et al. 1997), whereas other studies show that Hcy decreases NO production (Chow et al. 1999; Zhang et al. 2000). Our previous study show that Hcy induced oxidative stress by inducing iNOS and decreasing eNOS expression in MVEC (Tyagi et al. 2005). Nitric oxide (NO) synthase (NOS) enzymes essentially regulate the regulatory functions of neuronal and vascular integrity. The NOS enzymes produce NO, which regulates neuronal development and vascular tone via different isozymes such as neuronal NOS (nNOS) and endothelial NOS (eNOS) respectively (Kalani et al. 2015). Decreased nNOS levels suggest a decrease in potential for neuronal development and decreased nitric oxide-mediated long-term regulation of synaptic transmission and memory formation (Förstermann et al. 2012; O’Dell et al. 1991). In our study, we measured nNOS and eNOS in harvested brain samples. Our nNOS western blot data showed a decreasing trend in experimental mice in comparison to control mice but the data were not statistically significant within the 6week time frame (Fig.4A). Spearmann correlation analysis revealed no such significant correlation between nNOS expression and duration of HM-LF-LV diet; but we do found a strong positive correlation between nNOS expression and the duration of HM-LF-LV diet (Table 1). However, western blot data of eNOS showed no significant difference between control and experimental mice group, but, the data trend shows some increase in 4, 5 and 6 week HM-LF-LV diet fed mice, relative to control (Fig.4B). This may suggest that a statistical increase in eNOS levels could be observed if the dietwere extended beyond the 6 week time frame. Spearman correlation analysis did not establish any correlation between ICAM expression and the duration of HM-LF-LV diet. Our western blot analysis of Brain tissue ICAM, a marker for vascular inflammation, showed no significant difference between control and HM-LF-LV diet fed groups (Fig.4C). Similar findings were observed in a study on aortas of rats fed a methionine enriched diet for 4 weeks (Wang et al. 2002). However, VCAM levels and increased monocyte adhesion to aortic endothelium, markers of vascular inflammatory response, were shown to increase in their study. Likewise, findings by others showed increased leukocyte adhesion in mesenteric vessels of CBS deficient mice fed a methionine enriched diet for 8 weeks (Kamath et al. 2006).
Conclusions
Our study shows that HM-LF-LV diet causes a decline in cerebrovascular health in wild-type mice. As a whole these results demonstrate that a HM-LF-LV diet may be one of the risk factor for the development of neurodegeneration and short-term memory loss. The effects of nutrition on cognitive function have long been a subject of interest in biomedical science. Our study shows that a sustained high methionine, low folate and low vitamin B6/B12 diet causes neuronal dysfunction and neurodegeneration, structural cerebrovascular dysfunction and vascular leakage, and short-term memory loss. Although neuronal and cerebrovascular dysfunction start simultaneously, our study shows that the functional outcome of cerebrovascular dysfunction from the diet is delayed (until the 6th week of the diet) while functional outcome of neuronal damage is more immediate (Fig.5).
Figure 5.
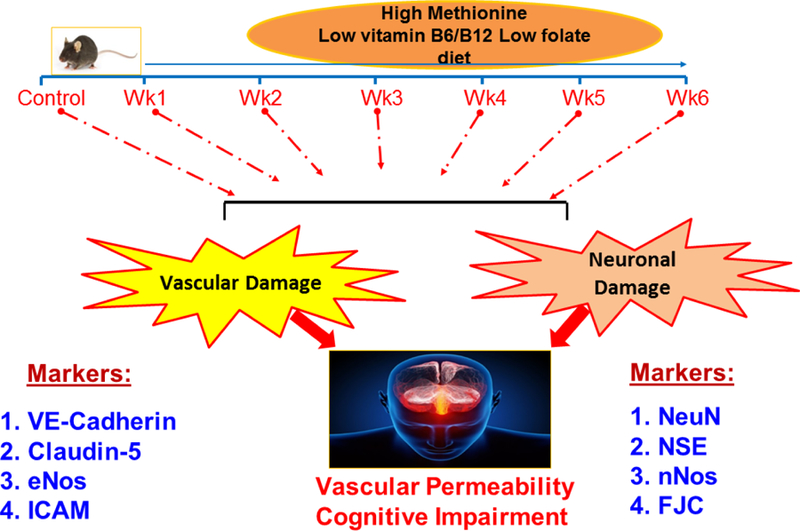
High methionine low vitamin diet independently compromises structural and functional damage to neuronal and cerebrovascular systems leading to a subsequent loss in short-term memory.
Acknowledgments
NIH (National Institute of Health) Grant HL-107640 and AR-067667 to NT and NS-084823 to DL supported this study.
References
- Basati G, Razavi AE, Abdi S, Sarrafzedegan N (2014) Association of plasma leptin, homocysteine and nitric oxide levels with the presence and unstability of coronary artery disease. Biomark Med 8:405–412. [DOI] [PubMed] [Google Scholar]
- Chaturvedi P, Kamat PK, Kalani A, Familtseva A, Tyagi SC (2016) High Methionine Diet Poses Cardiac Threat: A Molecular Insight. J Cell Physiol 231:1554–1561. [DOI] [PubMed] [Google Scholar]
- Cheng J and Kaplowitz N (2004) Hyperhomocysteinemia, endoplasmic reticulum stress, and alcoholic injury. World J Gastroenterol 10:1699–1708. [DOI] [PMC free article] [PubMed] [Google Scholar]
- Chow K, Cheung F, Lao TT, O K (1999) Effect of homocysteine on the production of nitric oxide in endothelial cells. Clin Exp Pharmacol Physiol 26:817–818. [DOI] [PubMed] [Google Scholar]
- Clarke R, Smith AD, Jobst KA, Refsum H, Sutton L, Ueland PM (1998) Folate, vitaminB12, and serum total homocysteine levels in confirmed Alzheimer disease. Arch Neurol 55:1449–1455. [DOI] [PubMed] [Google Scholar]
- FAO/WHO (1973) “Energy and Protein Requirements.” Report of a Joint FAO/WHO Ad Hoc Expert Committee Technical Report Series No. 552; FAO Nutrition Meetings Report Series 52 http://apps.who.int/iris/bitstream/10665/41042/1/WHO_TRS_522_eng.pdf. [PubMed] [Google Scholar]
- Förstermann U, Sessa WC (2012) Nitric oxide synthases: regulation and function. Eur Heart J 33:829–837. [DOI] [PMC free article] [PubMed] [Google Scholar]
- Ganguly P, Alam SF (2015) Role of homocysteine in the development of cardiovascular disease. Nutrition Journal 14:6. [DOI] [PMC free article] [PubMed] [Google Scholar]
- Gomez J, Caro P, Sanchez I, Naudi A, Jove M, Portero-Otin M, et al. (2009) Effect of methionine dietary supplementation on mitochondrial oxygen radical generation and oxidative DNAdamage in ratliver and heart. J Bioenerg Biomembr 41:309–321. [DOI] [PubMed] [Google Scholar]
- Hainsworth AH, Yeo NE, Weekman EM, Wilcock DM (2016) Homocysteine, hyperhomocysteinemia and vascular contributions to cognitive impairment and dementia (VCID). Biochim Biophys Acta 1862:1008–1017. [DOI] [PMC free article] [PubMed] [Google Scholar]
- Hankey GJ, Eikelboom JW (2001) Homocysteine and stroke. Curr Opin Neurol 14:95–102. [DOI] [PubMed] [Google Scholar]
- Harper AE, Benevenga NJ, Wohlhueter RM (1970) Effects of ingestion of disproportionate amounts of amino acids. Physiol Rev 50:428–558. [DOI] [PubMed] [Google Scholar]
- Irwin MI, Hegsted DM (1971) A conspectus of research on amino acid requirements of man. J Nutr 101:539–66. [DOI] [PubMed] [Google Scholar]
- Jacobsen DW (2000) Hyperhomocysteinemia and oxidative stress: time for a reality check? Arterioscler Thromb Vasc Biol 20:1182–1184. [DOI] [PubMed] [Google Scholar]
- Zhang JW, Yan R, Tang YS, Guo YZ, Chang Y, Jing L, Wang YL, Zhang JZ (2017) Hyperhomocysteinemia-induced autophagy and apoptosis with downregulation of hairy enhancer of split 1/5 in cortical neurons in mice. Int J Immunopathol Pharmacol 30:371–382. [DOI] [PMC free article] [PubMed] [Google Scholar]
- Kalani A, Kamat PK, Familtseva A, Chaturvedi P, Muradashvili N, Narayanan N,et al. (2014) Role of microRNA29b in blood-brain barrier dysfunction during hyperhomocysteinemia: an epigenetic mechanism. J Cereb Blood Flow Metab 34:1212–1222. [DOI] [PMC free article] [PubMed] [Google Scholar]
- Kalani A, Kamat PK, Tyagi N (2015) Diabetic Stroke Severity: Epigenetic Remodeling and Neuronal, Glial, and Vascular Dysfunction. Diabetes 64:4260–4271. [DOI] [PMC free article] [PubMed] [Google Scholar]
- Kalani A, Pushpakumar SB, Vacek JC, Tyagi SC, Tyagi N (2016) Inhibition of MMP-9 attenuates hypertensive cerebrovascular dysfunction in Dahl salt-sensitive rats. Mol Cell Biochem 413:25–35. [DOI] [PMC free article] [PubMed] [Google Scholar]
- Kamat PK, Kalani A, Givvimani S, Sathnur PB, Tyagi SC, Tyagi N (2013) Hydrogensulfideattenuatesneurodegeneration and neurovasculardysfunctioninduced by intracerebral-administered homocysteine in mice. Neuroscience 252:302–319. [DOI] [PMC free article] [PubMed] [Google Scholar]
- Kamath AF, Chauhan AK, Kisucka J, Dole VS, Loscalzo J, Handy DE, Wagner DD (2006) Elevated levels of homocysteine compromise blood-brain barrier integrity in mice. Blood 107:591–593. [DOI] [PMC free article] [PubMed] [Google Scholar]
- Koladiya RU, Jaggi AS, Singh N, Sharma BK (2008) Ameliorative role of Atorvastatin and Pitavastatin in L-Methionine induced vascular dementia in rats. BMC Pharmacol 8:14. doi: 10.1186/1471-2210-8-14. [DOI] [PMC free article] [PubMed] [Google Scholar]
- Leger M, Quiedeville A, Bouet V, Haelewyn B, Boulouard M, Schumann-Bard P, Freret T (2013) Object recognition test in mice. Nat Protoc 8:2531–2537. [DOI] [PubMed] [Google Scholar]
- Lominadze D, Roberts AM, Tyagi N, Moshal KS, Tyagi SC (2006) Homocysteine causes cerebrovascular leakage in mice. Am J Physiol Heart Circ Physiol 290:H1206–213. [DOI] [PMC free article] [PubMed] [Google Scholar]
- Lu K, Xu X, Cui S, Wang F, Zhang B, Zhao Y (2015). Serum neuron specific enolase level as a predictor of prognosis in acute ischemic stroke patients after intravenous thrombolysis. J Neurol Sci 359:202–206. [DOI] [PubMed] [Google Scholar]
- Lueptow LM (2017) Novel Object Recognition Test for the Investigation of Learning and Memory in Mice. J Vis Exp (126). doi: 10.3791/55718. [DOI] [PMC free article] [PubMed]
- Mattson MP, Shea TB (2003) Folate and homocysteine metabolism in neural plasticity and neurodegenerative disorders. Trends Neurosci 26:137–146. [DOI] [PubMed] [Google Scholar]
- Miller AL (2003) The methionine-homocysteine cycle and its effects on cognitive diseases. Altern Med Rev 8:7–19. [PubMed] [Google Scholar]
- Miller JW (1999) Homocysteine and Alzheimer’s disease. Nutr Rev 57:126–129. [DOI] [PubMed] [Google Scholar]
- Millward J (1990) Amino acid requirements in adult man. Am J Clin Nutr 51:492–496. [DOI] [PubMed] [Google Scholar]
- Mori N, Hirayama K (2000) Long-term consumption of a methionine-supplemented diet increases iron and lipid peroxide levels in rat liver. J Nutr 130:2349–2355. [DOI] [PubMed] [Google Scholar]
- Muradashvili N, Tyagi R, Metreveli N, Tyagi SC, Lominadze D (2014) Ablation of MMP9 gene ameliorates paracellular permeability and fibrinogen-amyloid beta complex formation during hyperhomocysteinemia. J Cereb Blood Flow Metab 34:1472–1482. [DOI] [PMC free article] [PubMed] [Google Scholar]
- Obeid R, Herrmann W (2006) Mechanisms of homocysteine neurotoxicity in neurodegenerative diseases with special reference to dementia. FEBS Lett 580:2994–3005. [DOI] [PubMed] [Google Scholar]
- O’Dell TJ, Hawkins RD, Kandel ER, Arancio O (1991) Tests of the roles of two diffusible substances in long-term potentiation: evidence for nitric oxide as a possible early retrograde messenger. Proc Natl Acad Sci USA 88:11285–11289. [DOI] [PMC free article] [PubMed] [Google Scholar]
- Oldendorf WH, Szabo J (1976) Amino acid assignment to one of three blood-brain barrier amino acid carriers. Am J Physiol 230:94–98. [DOI] [PubMed] [Google Scholar]
- Sabour H, Nazari M, Latifi S, Soltani Z, Shakeri H, Larijani B, et al. (2016) The Relationship Between Dietary Intakes of Amino Acids and Bone Mineral Density Among Individuals with Spinal Cord Injury. Oman Med J 31:22–28. [DOI] [PMC free article] [PubMed] [Google Scholar]
- Schmued LC, Stowers CC, Scallet AC, Xu L (2005) Fluoro-Jade C results in ultra high resolution and contrast labeling of degenerating neurons. Brain Res 1035:24–31. [DOI] [PubMed] [Google Scholar]
- Shen Y, Gao HM (2015) Serum somatostatin and neuron-specific enolase might be biochemical markers of vascular dementia in the early stage. Int J Clin Exp Med 8:19471–19475. [PMC free article] [PubMed] [Google Scholar]
- Siri PW, Verhoef P, Kok FJ (1998) Vitamins B6, B12, and folate: association with plasma total homocysteine and risk of coronary atherosclerosis. J Am Coll Nutr 17:435–441. [DOI] [PubMed] [Google Scholar]
- Smith AD (2008) The worldwide challenge of the dementias: a role for B vitamins and homocysteine? Food Nutr Bull 29:S143–172. [DOI] [PubMed] [Google Scholar]
- Troen AM, French EE, Roberts JF, Selhub J, Ordovas JM, Parnell LD, Lai CQ (2007) Lifespan modification by glucose and methionine in Drosophila melanogaster fed a chemically defined diet. Age (Dordr) 29:29–39. [DOI] [PMC free article] [PubMed] [Google Scholar]
- Tyagi N, Sedoris KC, Steed M, Ovechkin AV, Moshal KS, Tyagi SC (2005) Mechanisms of homocysteine-induced oxidative stress. Am J Physiol Heart Circ Physiol 289:H2649–656. [DOI] [PubMed] [Google Scholar]
- Upchurch GR Jr, Welch GN, Fabian AJ, Pigazzi A, Keaney JF Jr, Loscalzo J (1997) Stimulation of endothelial nitric oxide production by homocyst(e)ine. Atherosclerosis 132:177–185. [DOI] [PubMed] [Google Scholar]
- Wang G, Woo CW, Sung FL, Siow YL, O K (2002) Increased monocyte adhesion to aortic endothelium in rats with hyperhomocysteinemia: role of chemokine and adhesion molecules. Arterioscler Thromb Vasc Biol 22:1777–1783. [DOI] [PubMed] [Google Scholar]
- Yang AN, Zhang HP, Sun Y, Yang XL, Wang N, Zhu G, et al. (2015) High-methionine diet accelerate atherosclerosis by HHcy-mediatedFABP4genedemethylationpathwayviaDNMT1 in ApoE(−/−) mice. FEBS Lett 589:3998–4009. [DOI] [PubMed] [Google Scholar]
- Young SN, Shalchi M (2005) The effect of methionine and S-adenosylmethionine on S-adenosylmethionine levels in the rat brain. J Psychiatry Neurosci 30:44–48. [PMC free article] [PubMed] [Google Scholar]
- Zhang X, Li H, Jin H, Ebin Z, Brodsky S, Goligorsky MS (2000) Effects of homocysteine on endothelial nitric oxide production. Am J Physiol Renal Physiol 279:F671–F678. [DOI] [PubMed] [Google Scholar]
- Zhuo JM, Portugal GS, Kruger WD, Wang H, Gould TJ, Pratico D (2010) Diet-induced hyperhomocysteinemia increases amyloid-beta formation and deposition in a mouse model of Alzheimer’s disease. Curr Alzheimer Res 7:140–149. [DOI] [PMC free article] [PubMed] [Google Scholar]