

Human milk oligosaccharide transporters play key roles in symbiosis and coevolution between bifidobacteria and breast-fed infants.
Abstract
The human gut microbiota established during infancy has persistent effects on health. In vitro studies have suggested that human milk oligosaccharides (HMOs) in breast milk promote the formation of a bifidobacteria-rich microbiota in infant guts; however, the underlying molecular mechanism remains elusive. Here, we characterized two functionally distinct but overlapping fucosyllactose transporters (FL transporter-1 and -2) from Bifidobacterium longum subspecies infantis. Fecal DNA and HMO consumption analyses, combined with deposited metagenome data mining, revealed that FL transporter-2 is primarily associated with the bifidobacteria-rich microbiota formation in breast-fed infant guts. Structural analyses of the solute-binding protein (SBP) of FL transporter-2 complexed with 2′-fucosyllactose and 3-fucosyllactose, together with phylogenetic analysis of SBP homologs of both FL transporters, highlight a unique adaptation strategy of Bifidobacterium to HMOs, in which the gain-of-function mutations enable FL transporter-2 to efficiently capture major fucosylated HMOs. Our results provide a molecular insight into HMO-mediated symbiosis and coevolution between bifidobacteria and humans.
INTRODUCTION
The gut microbiota (GM) is intimately associated with health and disease of the host, and both the composition and metabolic output of this community are influenced by diet (1). As nondigestible dietary and host-derived glycans are the primary metabolic resources for bacteria in the lower intestines (2), gaining insights into the molecular basis of how different microbes adapt to specific glycans to thrive in this ecosystem is of particular importance. We have been focusing on the formation of the GM during infancy because the most marked microbiota changes occur at the onset and termination of breast-feeding (3). Understanding the molecular basis of shaping early life GM offers a promising avenue for establishing healthy gut community within the critical window that affects a lifelong health outcome (4, 5).
Beside essential nutrients, infant diet or mothers’ milk contains nondigestible oligosaccharides with a degree of polymerization of ≥3 [collectively termed human milk oligosaccharides (HMOs)], which are the third most abundant component after lactose (Lac) and lipids (6, 7). Twelve structures listed in fig. S1 account for >90% of total HMOs by weight (8), with 2′-fucosyllactose (2′-FL) and 3-fucosyllactose (3-FL) being abundantly present. Note that 2′-FL is present at a relatively higher concentration than 3-FL in milk from secretor mothers, while 2′-FL or H antigen (Fucα1-2Gal disaccharide motif) is absent and the amount is generally compensated by 3-FL in nonsecretor mother’s milk [FUT2−/− (fucosyltransferase 2 gene)] (6). The GM of breast-fed infants is dominated by bifidobacteria. The abundance and prevalence of bifidobacteria in neonatal guts are attributed to their unique ability to catabolize HMOs (9, 10). The glycosidase enzymology of HMO catabolism by infant gut–associated bifidobacteria, represented by Bifidobacterium longum subsp. longum (B. longum), Bifidobacterium longum subsp. infantis (B. infantis), Bifidobacterium breve, and Bifidobacterium bifidum, is relatively well understood (9, 10). B. bifidum and some strains of B. longum initiate HMO degradation extracellularly using cell surface–attached glycosidases, thereby sharing the degradants among other bifidobacteria (11), while the other bifidobacteria import intact oligosaccharides that are subsequently degraded intracellularly (9, 10). In either case, uptake of intact or partially degraded HMOs is a pivotal metabolic feature. Despite the importance of oligosaccharide uptake for competitiveness and glycan cross-feeding in the gut ecosystem (11), insight into HMO uptake by bifidobacteria is conspicuously limited (12–16). The study reported by Mills and co-workers hinted at the preference of B. infantis for HMO import by ATP-binding cassette (ABC)–type transporters based on genomic sequencing and glycan array analysis of ABC transporter–associated solute-binding proteins (SBPs) (17, 18). The data obtained using these techniques is, however, not sufficient to reliably assign the specificity or the physiological relevance of individual transporters to GM formation. Recently, two studies used genomics approaches to identify the transporter for 2′-FL and other fucosylated HMOs in B. longum (12) and B. breve (14). Nonetheless, the mechanistic basis underlying the substrate preference and in vivo physiological role of the transporters are largely unknown, although 2′-FL has been commercialized to improve infant formula.
Here, we reveal and comprehensively analyze two functionally distinct but overlapping FL transporters from B. infantis and highlight the correlations between gene occurrence, HMO consumption, and establishment of a bifidobacteria-rich microbiota in breast-fed infant guts. We also provide a structural rationale for the differential recognition of the major HMOs 2′-FL and 3-FL by the two transporter-associated SBPs. Our findings underscore the key role of oligosaccharide transporters in the coevolution of Bifidobacterium with humans as reflected by the diversification of HMO transporters and adaptive expansion of their ligand range to span dominant HMO structures.
RESULTS
A platform to evaluate substrate specificities of HMO transporters
We have developed an in vivo system for evaluating HMO transporter specificities. B. longum 105-A originally has a lacto-N-biosidase (LnbX) and lacto-N-biose I/galacto-N-biose transporter (GltABC) for assimilation of the prime HMO core structure lacto-N-tetraose (LNT) (fig. S1) (15, 19). Starting from the recently constructed B. longum 105-A ΔlnbX strain (20), we disrupted gltA by markerless gene replacement (fig. S2) to create the ΔlnbX ΔgltA double mutant. Next, this strain was transformed with a plasmid encoding intracellular exo-glycosidases required for hydrolyzing all glycosidic linkages found in HMOs (Fig. 1, A and B). The functionality of these exo-glycosidases in the resulting strain MS554 was verified using cell-free extracts (fig. S3A), while lacking HMO uptake systems was consistent with inability to use purified HMO mixture as the carbon source (Fig. 1C). The results qualify the strain MS554 as a useful model host for systematically analyzing in vivo specificity of HMO transporters.
Fig. 1. A platform for evaluating in vivo substrate specificity of HMO transporters.
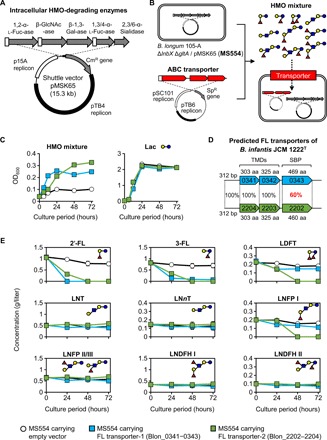
Specificity of the two candidate HMO transporters from B. infantis was analyzed by their heterologous expression in the pMSK65-harboring B. longum 105-A ΔlnbX ΔgltA, the strain expressing intracellular HMO-degrading enzymes but deficient in growth on purified HMO mixture. (A) E. coli–Bifidobacterium shuttle vector pMSK65 carrying the genes encoding intracellular HMO-degrading exo-glycosidases from B. infantis. (B) B. longum 105-A ΔlnbX ΔgltA strain with pMSK65 as a host for evaluating in vivo specificity of HMO transporters. The candidate gene cluster (shown in red) is introduced into the host using a compatible plasmid. (C) Growth of the recombinant B. longum strain with an empty vector (open circles) or with the plasmid expressing FL transporter-1 (locus tags Blon_0341–0343, blue squares) or FL transporter-2 (locus tags Blon_2202–2204, green squares) in medium supplemented with 0.5% (w/v) purified HMO mixture or Lac. Experiments were technical duplicates, and data are means ± SD. OD600, optical density at 600 nm. (D) Gene organization of candidate FL transporter paralogs from B. infantis JCM 1222T analyzed in this study. TMDs, transmembrane domains; aa, amino acid; bp, base pair. (E) Changes in the concentration of each HMO in culture supernatant during growth on 0.5% (w/v) purified HMO mixture. Experiments were technical triplicates, and data are means ± SD. The symbols are the same as in (C). Sugars are depicted according to the nomenclature committee of the Consortium for Functional Glycomics (www.functionalglycomics.org/static/consortium/consortium.shtml).
Using this strain, we expressed two paralogous ABC transporters from B. infantis JCM 1222T [=American Type Culture Collection (ATCC) 15697T] (locus tag numbers Blon_0341–0343 and Blon_2202–2204; GenBank accession no. CP001095.1), which have been annotated as fucosyllactose (FL) transporters with the same specificity, based on shared SBP sequence identity (60%) and hits from glycan array analysis (Fig. 1D) (17). These transporters conferred increased growth on the purified HMO mixture, while growth on Lac was indistinguishable from the control strain harboring an empty vector (Fig. 1C). 2′-FL and 3-FL were the first HMOs to be consumed by the two recombinant strains, while no apparent assimilation was observed for the control strain (Fig. 1E). The transporter encoded by Blon_2202–2204 was distinguished from Blon_0341–0343 by conferring utilization of lactodifucotetraose (LDFT) and lacto-N-fucopentaose (LNFP) I, consistent with higher cell density attained by the Blon_2202–2204–expressing strain (Fig. 1C). The concentrations of other HMOs, i.e., LNT, lacto-N-neotetraose (LNnT), LNFP II/III, lacto-N-difucohexaose (LNDFH) I, and LNDFH II, seemed to be invariant during the incubation periods (Fig. 1E). The observed HMO uptake was verified by growth on 2′-FL, 3-FL, LDFT, or LNFP I as a sole carbon source (fig. S3B). Both the strains expressing Blon_0341–0343 [hereafter denoted as FL transporter-1 (SBP name: FL1-BP)] and Blon_2202–2204 [FL transporter-2 (SBP name: FL2-BP)] grew on 2′-FL and 3-FL, but the strain with FL transporter-2 additionally grew on LDFT and LNFP I. These results established the power of this approach to evaluate in vivo HMO uptake. Another key conclusion is that FL transporter-1 and -2 have distinct but overlapping preferences for HMOs, which was not evident from previous reports (12, 17).
Both FL transporter-1 and -2 contribute to the growth of B. infantis JCM 1222T on major fucosylated HMOs
We then inactivated either or both of the two transporters of B. infantis JCM 1222T (Fig. 2A). Single markerless disruption of FL transporter-1 (ΔBlon_0341–0343) or FL transporter-2 (ΔBlon_2202–2204) was attained, but the double markerless disruption was not successful. Instead, a double mutant was obtained by insertional inactivation of the FL2-BP gene (Blon_2202::pMSK101) with FL transporter-1–disrupted background (ΔBlon_0341–0343). Consequently, four mutants were used for the growth phenotypic assay: ΔBlon_0341–0343 (referred to as ΔFL1), ΔBlon_2202–2204 (ΔFL2), Blon_2202::pMSK101 (FL2-BPINS), and ΔBlon_0341–0343 Blon_2202::pMSK101 (ΔFL1 FL2-BPINS, double mutant) (Fig. 2A).
Fig. 2. Two FL transporters differently contribute to in vitro growth of B. infantis JCM 1222T on major fucosylated HMOs.

(A) Schematic representation of the gene organization at the genomic loci for the two FL transporters in B. infantis JCM 1222T variants. (B) Growth of WT and mutant B. infantis strains on 0.5% (w/v) Gal, 2′-FL, 3-FL, LDFT, LNFP I, or purified HMO mixture. The symbols used are as follows: open circles (WT), blue triangles [FL transporter-1 disruptant (ΔFL1)], green triangles (ΔFL2), orange diamonds, [FL2-BP insertional mutant (FL2-BPINS)], and gray triangles [double mutant (ΔFL1 FL2-BPINS)]. Experiments were biological duplicates, and the data are means ± SD. Sugars are depicted as in Fig. 1. (C) In vitro growth competition assay between WT and double-mutant (ΔFL1 FL2-BPINS) strains on 0.5% (w/v) GOSs, 2′-FL, and purified HMO mixture. The population of each strain was determined by quantitative polymerase chain reaction (qPCR), and the relative abundance (%) of WT (white bar) and double mutant (gray bar) is shown. Experiments were biological triplicated, and the data are means ± SD. Student’s two-tailed t test was used for evaluating statistical significance.
Wild-type (WT) and the four mutants of B. infantis grew at similar rates on galactose (Gal) (Fig. 2B). The FL transporter-1 single mutant (ΔFL1) showed growth retardation on both 2′-FL and 3-FL, while FL transporter-2 single mutants (ΔFL2 and FL2-BPINS) did not. Growth of the FL transporter-1 and -2 double mutant (ΔFL1 FL2-BPINS) was abolished for 2′-FL and severely impaired for 3-FL. The results demonstrated that the 2′-FL and 3-FL transport activity of B. infantis JCM 1222T in culture medium depends primarily on FL transporter-1 and secondarily on FL transporter-2. The growth ability on LDFT was lost for FL transporter-2 single mutants (ΔFL2 and FL2-BPINS) and ΔFL1 FL2-BPINS double mutant. ΔFL1 showed slightly retarded growth on LDFT, despite the fact that FL transporter-1 is not involved in LDFT uptake (Fig. 1E and fig. S3B). In the medium supplemented with LNFP I, all B. infantis variants grew well, except for the ΔFL2 strain. Growth of both FL2-BPINS and ΔFL1 FL2-BPINS strains on LNFP I medium was unexpected. These results did not seem to be caused by reversion to WT genome structure at the FL transporter-2 locus, as the cells retained spectinomycin (Sp) resistance after 24 hours of incubation. Because FL2-BPINS mutants have intact genes for the membrane components, other SBPs encoded at different loci, which likely contribute to the limited growth of the ΔFL2 strain on LNFP I of ΔFL2 strain, might compensate for FL2-BP in these mutants. Nonetheless, the above results indicate that FL transporter-2 plays an important role in LNFP I utilization by B. infantis.
No obvious growth difference on purified HMO mixture was observed between WT and the four mutants (Fig. 2B), although 2′-FL, 3-FL, LDFT, and LNFP I account for approximately 50% of the purified HMO mixture by weight (see the HMO concentrations at 0 hours of incubation in Fig. 1E). However, in competition between the WT and the double mutant (ΔFL1 FL2-BPINS) on 2′-FL– and purified HMO mixture–supplemented media, the WT strain outgrew the mutant by three and two orders of magnitude (P = 8.14 × 10⁻¹⁰ and P = 3.30 × 10⁻⁶, respectively, Student’s two-tailed t test; Fig. 2C). This effect was specific for HMOs, as both strains grew indistinguishably in competition for galactooligosaccharides (GOSs) (P = 0.18). Collectively, these results suggest that FL transporter-1 and -2 are pivotal fitness factors for B. infantis to prevail in an HMO-rich ecological niche.
Ligand binding and structural basis of FL recognition
Binding parameters
Thermodynamics and affinity for ligand binding of FL1-BP and FL2-BP were examined by isothermal titration calorimetry (ITC) and surface plasmon resonance (SPR) analyses (fig. S4). Binding of fucosyllactose ligands to FL1-BP and FL2-BP was driven by a favorable change in enthalpy, which was compensated by an unfavorable entropy change (Table 1). No measurable heat signals were observed for the other ligands at the tested concentrations (fig. S4). The Kd (dissociation constant) value of FL1-BP for 2′-FL (≈10 μM) was comparable to those of FL2-BP for 2′-FL and 3-FL (5 to 6 μM). By contrast, the affinity of FL2-BP to LDFT was lower (≈200 μM), which is in accord with the SPR binding data (Table 1). Despite the similar Kd values, a 1.7-fold higher enthalpy change was observed for FL1-BP as compared to FL2-BP in 2′-FL binding, indicative of higher hydogen-bonding density by FL1-BP.
Table 1. Binding parameters of FL1-BP and FL2-BP to mono- and difucosyllactose determined by ITC and SPR analysis.
| Protein | Ligand | ITC* | SPR | ||||||||
|
Ka (×105 M−1) |
Kd (μM) |
ΔG0 (kcal mol−1) |
ΔH (kcal mol−1) |
−TΔS0 (kcal mol−1) |
ΔS0 (cal K−1 mol−1) |
n (site) |
Kd (μM)† |
Rmax‡ | χ 2 § | ||
| FL1-BP | 2′-FL | 1.05 ± 0.23 | 9.75 | −6.8 | −23.6 ± 0.5 | 16.8 | −56.3 | 0.85 ± 0.14 | 9.0 ± 0.7 | 14.7 | 0.09 |
| FL2-BP | 2′-FL | 1.86 ± 0.12 | 5.40 | −7.2 | −14.2 ± 0.7 | 7.0 | −23.6 | 0.90 ± 0.04 | 9.9 ± 1.6 | 9.3 | 0.13 |
| 3-FL | 1.69 ± 0.11 | 5.95 | −7.1 | −14.0 ± 0.4 | 6.9 | −23.2 | 1.12 ± 0.14 | 5.9 ± 0.5 | 10.2 | 0.06 | |
| LDFT | 0.05 ± 0.00 | 191.11 | −5.1 | −6.8 ± 0.5 | 1.7 | −5.7 | 1.02 ± 0.02 | 163.1 ± 25.0 | 12.0 | 0.24 | |
*Values of association constants (Ka), enthalpy of binding (ΔH), and binding stoichiometry (n) obtained in ITC analysis are expressed as means ± SD of duplicate experiments. Dissociation constants (Kd) were calculated from the reciprocal of Ka. The Gibbs free energy change (ΔG0) and the entropy change (ΔS0) were calculated from the equations ΔG0 = −RTlnKa and TΔS0 = ΔH − ΔG0, respectively (R, gas constant; T, absolute temperature).
†The Kd values obtained in the SPR analysis are means ± SD of duplicate experiments.
‡The maximum binding level from the fits to a one-site binding model.
§Statistical goodness of the fit to a one-site binding model.
Overall structure of FL2-BP
FL1-BP crystals were not obtained despite intensive screening efforts, but the crystal structures of FL2-BP complexed with 2′-FL and 3-FL were solved at 1.3 and 1.4 Å, respectively (table S1). FL2-BP adopts a canonical SBP fold [cluster B according to the structural classification system (21)], which comprises two domains of different size joined by a tripartite hinge region, with the ligand binding site located at the domain interface (Fig. 3A). Domain 1 (33–161; 322–373) is formed by eight α helices and five β strands. Domain 2 (165–318; 378–460) consists of nine α helices and seven β strands, and the hinge region comprises two short loops spanning the center of the two domains (162–164; 319–321) and the loop 374–377. A DALI server search (22) for structural comparisons with Protein Data Bank (PDB) proteins identified the SBP of the lacto-N-biose I/galacto-N-biose transporter from B. longum (GltA) (15) [PDB code 2z8f; z score = 38.5; root mean square deviation (RMSD) = 2.5 Å for 381 aligned Cα atoms and 17% sequence identity] as the structurally most related ortholog to FL2-BP. The second best hit is the β-1,2-glucooligosaccharide–binding SBP (23) from Listeria innocua (PDB code 5yse; z score = 37.4; RMSD = 2.7 Å for 372 aligned Cα atoms and 21% sequence identity).
Fig. 3. Structure of 2’-FL- or 3-FL-complexed SBP of FL transporter-2 (FL2-BP) and distribution of FL-BP homologs among gut microbes.
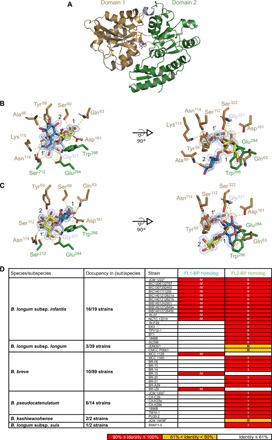
(A) Cartoon model of the overall structure of FL2-BP complexed with 2′-FL. Domain 1 and domain 2 are in brown and green, respectively. The sugars are depicted in stick models with carbon atoms of Fuc in white, Gal in yellow, Glc in blue, and oxygen atoms in red. (B and C) Close-up view of the ligand binding site of FL2-BP in complex with 2′-FL (B) and 3-FL (C). The same colors are used as in (A). (D) Distribution of FL1-BP and FL2-BP homologs (>61% identity) among Bifidobacterium species/subspecies. FL1-BP and FL2-BP from B. infantis JCM 1222T were used as queries for BlastP analysis. The cluster numbers (I to IV) are indicated based on the phylogenetic analysis shown in fig. S6C. The sequences of B. longum without subspecies identification in the National Center for Biotechnology Information (NCBI) database were excluded from the analysis. No close homologs (≥60% identity) were found in the genomes of other bacterial taxa in the NCBI database.
Ligand binding site
The structures of FL2-BP complexed with 2′-FL and 3-FL showed well-defined densities for these trisaccharides in the binding site comprising a deep but open pocket. Comparison of the binding site in both complexes reveals the recognition of the same structural motif involving Fuc-[Gal/Glc] (Fuc, fucose; Glc, glucose; fig. S5), which explains the basis for the dual recognition of 2′-FL and 3-FL with similar binding parameters (Table 1). The Fuc moiety occupies the same position at the bottom of the binding site (designated 1′), together with the connected sugar ring (Gal in 2′-FL or Glc in 3-FL) occupying position 1 (Fig. 3, B and C, and fig. S5). The reducing end Glc of 2′-FL and the nonreducing end Gal of 3-FL occupy position 2, but these sugar units are shifted about 50° in the plane of the rings.
The three OH groups of the Fuc at position 1′ are recognized in both complexes by polar contacts to G321, S212, E284, S112, N114, and K115, but the latter is only in the 2′-FL complex (table S2). The endocyclic oxygen (O5) of the Fuc is at hydrogen-bonding distance from the OH group of Y59, which, together with F92 and the aliphatic side chain of K115, encages the methyl group, thereby contributing to the strict recognition of the Fuc moiety. Position 1 is defined by aromatic stacking of either the Gal or Glc moiety onto W286 from domain 2, while polar contacts are provided by both domains of FL2-BP (Fig. 3, B and C, and fig. S6, A and B). At position 1, Gal of 2′-FL and Glc of 3-FL (modeled in both β and α anomers) make contacts to S60, while C3-OH of Gal and C2-OH of Glc form potential polar contacts to the amide nitrogen of S322 and the side chains of S322 and D161 (table S2). The dual recognition of Gal of 2′-FL or Glc of 3-FL at position 1 is possible because of the plasticity of Q63 and the rearrangement of the solvent-mediated hydrogen-bonding networks according to the bound ligand. An additional polar contact to endocyclic O5 of Glc at position 1 in the 3-FL complex is also possible. In contrast to the extensive recognition of the Fuc-[Gal/Glc] motif, the density of direct protein-ligand polar interaction at position 2 is markedly lower. The only potential hydrogen bonds in the 2′-FL complex are between Glc and A88, while in the 3-FL complex E284 interacts with the Gal unit. Overall, the structural mimicry between Fuc-[Gal/Glc] motifs of 2′-FL and 3-FL occupying positions 1′ and 1 as well as the space to accommodate the sugar rings in different orientations and the concomitant rearrangement of water-mediated hydrogen-bonding networks at position 2 provide a structural rationale for the observed dual specificity. The open binding site, especially around position 2, is likely to be key for the accommodation of LDFT and LNFP I, albeit at a lower affinity.
Binding site conservation and functional signatures of FL-BPs
To unveil the structural elements associated with the different binding specificities, we analyzed sequences of FL1-BP and FL2-BP homologs (fig. S6, A to C). A striking difference was observed between the conservation patterns in the binding site residues that recognize the Lac moiety and those that interact with Fuc in FL2-BP. Thus, S60, Q63, A88, S112, D161, W286, G321, and S322 are invariant across the homologs. Six of these residues interact with the Lac unit, while S112 and G321 recognize the Fuc moiety (fig. S6, A and B). By contrast, all of the five variable residues (Y59, N114, K115, S212, and E284) are involved in Fuc recognition. The FL-BP sequences segregate into four clusters (I to IV) in phylogeny with divergence of the Fuc binding residues. FL1-BP and FL2-BP from B. infantis JCM 1222T belong to cluster IV and cluster II, respectively (fig. S6C). This analysis highlights the sequence signatures underpinning the observed specificity difference between FL1-BP and FL2-BP.
FL-BP homologs are enriched in B. infantis genomes but are also sporadically encountered in other infant gut–associated bifidobacterial species
BlastP analysis using the National Center for Biotechnology Information (NCBI) genomic database (www.ncbi.nlm.nih.gov/) revealed limited occurrence of the FL1-BP (cluster IV) and FL2-BP (clusters I to III) homologs among bifidobacteria at species and strain levels (Fig. 3D and fig. S6C). No close homologs (≥60% identity) were found in the genomes of other bacterial taxa. Sixteen of 19 strains of B. infantis have close homologs of either FL transporter, and 11 strains have both homologs (≥90% identity). In contrast, only 3 of 39 B. longum strains have FL2-BP homologs and 2 of them showed moderate identity (71%, cluster III) to B. infantis FL2-BP. In the genomes of B. breve, close homologs of either FL-BP were found in 10 of 89 strains, while Bifidobacterium pseudocatenulatum has FL2-BP homologs in 6 of 14 strains. In Bifidobacterium kashiwanohense and Bifidobacterium longum subsp. suis, FL2-BP homologs were found in two and one strains, respectively. The FL2-BP homologs of B. kashiwanohense that belong to cluster III showed relatively low identity (71%); nonetheless, the gene cluster present in B. kashiwanohense JCM 15439T (BBKW_1838–1840) conferred the same ability to assimilate 2′-FL, 3-FL, LDFT, and LNFP I as FL transporter-2 from B. infantis when introduced into MS554 (fig. S6D). Sequences of the permease subunits are less divergent (≥90% identity in all the clusters), emphasizing the key role of SBPs in dictating uptake preference.
The abundance of Bifidobacterium is associated with FL transporter genes in breast-fed infant guts
We then analyzed fecal DNA obtained from Japanese subjects comprising 36 breast-fed infants and 32 adults. The abundances of Bifidobacterium and the FL2-BP homolog, but not the FL1-BP homolog, were significantly higher in breast-fed infant stools than in adult samples (P < 0.001, Mann-Whitney U test; Fig. 4A). Statistically significant positive correlations were detected in the breast-fed infant group between the abundances of Bifidobacterium and the FL2-BP or FL1/2-BP homolog genes (ρ = 0.512, P = 0.001 for FL2-BP gene and ρ = 0.501, P = 0.002 for FL1/2-BP genes) (Fig. 4B; Spearman’s rank correlation coefficient analysis), while a weak positive correlation was also observed between the FL1-BP homolog gene and Bifidobacterium (ρ = 0.370, P = 0.026). By contrast, weak or no positive correlation was detected between the two groups in the adult samples (ρ = 0.386, P = 0.032 for FL1/2-BP genes). The FL-BP genes were commensurate with the in vivo consumption of fucosylated HMOs based on the comparative analysis of HMO concentrations in breast milk and infant stools from 32 infant-mother pairs (fig. S7). In the fecal samples in which either or both FL-BP genes were detected (positive group, n = 25), the concentrations of the FL transporter substrates 2′-FL, 3-FL, LDFT, and LNFP I were lower than those detected in the FL-BP gene–negative group (n = 7), whereas their concentrations in milk did not differ between the two groups (P = 0.0098 versus P = 0.2944, Mann-Whitney U test; Fig. 4C). The abundance of the FL2-BP gene, but not the FL1-BP gene, negatively correlated with the concentrations of 3-FL (ρ = −0.416, P = 0.018) and LNFP I (ρ = −0.551, P = 0.001) in infant stools at statistically significant levels (Fig. 4D; Spearman’s rank coefficient analysis).
Fig. 4. The abundance of Bifidobacterium in breast-fed infant guts is associated with FL transporter genes.
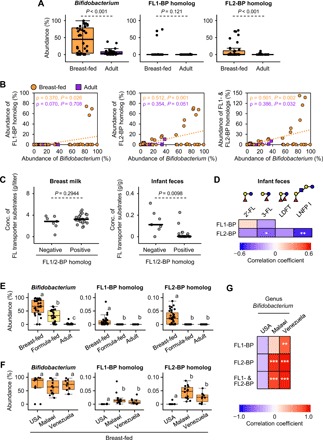
The results presented here were obtained by analyzing Japanese subjects recruited in this study (A to D) and by data mining of a deposited metagenome dataset (MG-RAST, accession no. qiime:621) (3) (E to G). (A) Relative abundance (%) of genus Bifidobacterium and two FL-BP homologs in stool DNA of breast-fed infants (n = 36) and adults (n = 31). The copy number of the genes attributable to Bifidobacterium 16S ribosomal RNA (rRNA), FL1-BP, and FL2-BP, which was determined by qPCR analysis, was divided by the copies of the 16S rRNA gene attributable to total bacteria. Mann-Whitney U test was used for evaluating the statistical significance. The data are shown by box plot, in which the middle bar indicates the median, while the top and bottom of the box indicate the third and first quartiles, respectively. Whiskers represent the lowest and highest values within 1.5 times the interquartile range from the first and third quartiles, respectively. (B) Spearman’s rank correlation coefficient analysis between the relative abundances of genus Bifidobacterium and either (left and middle panels) or both (right panel) of FL-BP genes in the breast-fed infant (orange circles) and adult (purple squares) groups. The data obtained in (A) were used for the analysis. (C) The concentrations of 2′-FL, 3-FL, LDFT, and LNFP I (substrates for FL transporter-1 and -2) in breast milk and infant stools (32 mother-infant pairs) were compared between FL-BP gene–detected (positive, n = 25) and undetected (negative, n = 7) groups. Mann-Whitney U test was used for evaluating the statistical significance. (D) Spearman’s rank correlation coefficient analysis between the relative abundance of the FL1-BP or FL2-BP gene and the fecal concentration of each substrate HMO. The data obtained in (C) were used for the analysis, and the results are shown as a heat map. *P < 0.05 and **P < 0.01. Sugars are depicted as in Fig. 1. (E and F) The deposited metagenome data of 83 individuals from the United States (n = 50), Malawi (n = 18), and Venezuela (n = 15) were used for the analysis (132,556 ± 76,952 reads per sample) (3). The abundances (%) of genus Bifidobacterium and two FL-BP homologs in the fecal samples obtained from breast-fed (n = 34) and formula-fed (n = 27) infants (≤1 year old) and adults (n = 22, ≥18 years old) are shown in (E), and those in the fecal samples of breast-fed infants living in the United States (n = 10), Malawi (n = 14), and Venezuela (n = 10) are shown in (F). See Materials and Methods for read count and abundance calculation for FL-BP genes. Different letters (a, b, and c) indicate statistically significant differences among the three groups (P < 0.05, Mann-Whitney U test with Bonferroni correction). (G) Spearman’s rank correlation coefficient analysis between the relative abundances of genus Bifidobacterium and either or both of two FL-BP genes in the breast-fed infant group. The data obtained in (F) were used for the analysis, and the results are shown as a heat map. *P < 0.05, **P < 0.01, and ***P < 0.001.
To support the above results, we have also evaluated the association between the abundances of Bifidobacterium and FL-BP genes by mining of the deposited metagenome dataset (MG-RAST, accession no. qiime:621) (3). The fecal metagenomic data for 83 individuals residing in the United States (n = 50), Malawi (n = 18), and Venezuela (n = 15), which comprise breast-fed (n = 34) and formula-fed (n = 27) infants (≤1 year old) and adults (n = 22, ≥18 years old), were used for the analysis. The results revealed that Bifidobacterium and both FL-BP genes, especially the FP2-BP gene, are significantly enriched in the breast-fed infant group compared to the formula-fed infant and adult groups (Fig. 4E). No significant difference was observed for the Bifidobacterium abundance in stools of breast-fed infants living in the United States (n = 10), Malawi (n = 14), and Venezuela (n = 10), whereas both FL-BP genes were more abundantly present in the Malawi and Venezuela groups than in the U.S. group (Fig. 4F). The abundances of both FL-BP genes (especially the FL2-BP gene) and the Bifidobacterium genus in the Malawi and Venezuela groups were strongly positively correlated (Fig. 4G; Spearman’s rank correlation coefficient analysis). Collectively, these results strongly suggest that the presence of FL transporters, and in particular the FL2 transporter, is highly relevant to the bifidobacteria-rich microbiota formation in the gut of breast-fed infants by supporting utilization of major fucosylated HMOs, and also suggest evolutionary adaptation of bifidobacteria to HMOs (see Discussion).
DISCUSSION
As exemplified by the specific occurrence of red seaweed degradation and transport genes in the Japanese microbiome, gut bacteria display evolutionary adaptation to host diet (24). In addition, a key role of transporters in supporting microbial competitiveness has been recently proposed based on the ability of two abundant GM symbionts with differing oligosaccharide uptake preferences to co-grow on dietary xylan (25). Contribution of multiple transporters to human gut colonization was suggested by Maldonado-Gómez et al. (26). In the present study, we analyzed two HMO transporters from B. infantis to gain insights into the possible evolutionary advantages of these transporters with distinct but overlapping specificities and to characterize their contribution to GM development in breast-fed infants.
Bifidobacterial platform for functional analysis of HMO transporters
Bifidobacteria have evolved two strategies for assimilating HMOs (9, 10). One is represented by B. bifidum and some B. longum strains that use extracellular glycosidase(s) (e.g., α-l-fucosidase and LnbX) to degrade HMOs to mono- and disaccharides outside the cells and then import the degraded sugars and/or share them to other bifidobacteria. In contrast, B. breve, B. infantis, and most B. longum strains use transporters to directly internalize HMOs and then degrade them intracellularly. The extracellular glycosidase-dependent type B. bifidum (9, 11) is generally less abundant in the infant GM community (14). In our previous study, secretory LnbX-positive B. longum was present at 0.2%, on average, of the total B. longum population (20). These results suggest that most of the infant gut bifidobacteria use transporters for assimilating HMOs. Nonetheless, reports on identification and characterization of HMO transporters are quite limited, although HMOs comprise more than 100 structures. The paucity of transporter studies is largely due to the limited genetic tools that work in Bifidobacterium. The strain MS554 developed in this study serves as a powerful platform for examining in vivo specificities of transporters responsible for neutral, fucosylated, and sialylated HMO uptake (Fig. 1 and figs. S3 and S6D). This engineered strain offers instrumental data for detailed understanding of the specificity and interplay between HMO transporters, especially when integrated with structural and binding data.
Fecal occurrence of two FL transporters with distinct but overlapping specificities is associated with bifidobacteria-rich GM formation in breast-fed infant guts
FL transporter-1 and -2 of B. infantis JCM 1222T were assumed to have the same specificity (17); however, our results show distinct but overlapping specificities of the two transporters (Figs. 1E and 2B and fig. S3B). FL1-BP and FL2-BP define segregated clades in the phylogenetic tree with marked differences in FL binding residues (fig. S6, A to C). Notably, residues that recognize 2′-FL and 3-FL are also variant in the signature sequences of these clades, e.g., N114, K115, and E284 in FL2-BP being replaced with serine, glutamic acid, and glycine, respectively, in cluster IV (FL1-BP homologs), although they are invariant or conservatively substituted in clusters I to III (FL2-BP homologs). These differences may, in part, explain the differential affinity to 3-FL between the two SBPs. The larger influence of FL transporter-1 on the in vitro growth on 2′-FL and 3-FL than FL transporter-2 is intriguing (Fig. 2B). Possible explanations could be differential expression levels of the associated SBPs due to codon usage differences (FL1-BP: 45% of GC content; FL2-BP: 54% of GC content) and lower affinity binding of 3-FL to FL1-BP due to the structural mimicry of this ligand to 2′-FL (fig. S5B). However, the stool DNA analysis suggests that both of the two FL transporters, especially FL transporter-2, provide growth advantage for bifidobacteria to selectively dominate breast-fed infant gut ecosystem (Fig. 4, A to D). The possible fitness advantage exerted by FL transporters in the HMO-rich environment is also supported by metagenome data mining (Fig. 4, E to G), although strong positive correlation was observed between Bifidobacterium and FL-BP gene(s) for breast-fed infants who live in Malawi and Venezuela, but not in the United States.
An evolutionary adaptation of bifidobacteria to HMO structures
Bifidobacterium is assumed to have coevolved with their hosts by acquiring genes that support proliferation in the digestive tracts of mammals, especially humans (27). Notably, considerable acquisition of ABC-type carbohydrate transporters by bifidobacteria has been proposed (28). Recent findings have also suggested the possible involvement of a single ABC transporter (a homolog of FL2-BP) in FL utilization (12, 14). In the present study, we unequivocally reveal how infant gut–associated bifidobacteria have adaptively evolved two FL transporters to assimilate two major components, 2′-FL and 3-FL, of HMOs in breast-fed infant guts. The 3-FL–transporting activity of FL transporter-1 and the observed in vitro impact of the deletion of this transporter in B. infantis on LDFT utilization are puzzling but possibly explained by a higher expression level of FL1-BP compared to FL2-BP, which may compensate for lower affinity of FL1-BP to these ligands due to the structural similarity to 2′-FL (fig. S5B). The lack of measurable binding of 3-FL and LDFT to FL1-BP in our assay does not preclude low-affinity interactions with this SBP. Capture of these ligands is unlikely to be physiologically relevant under in vivo competition conditions (due to low availability), although the ligands can be bound in the lack of competition. By contrast, the activity of FL transporter-2 is evidently derived from gain-of-function amino acid substitutions, by which FL2-BP evolved to recognize both 2′-FL and 3-FL with similar affinity and to recognize LDFT and LNFPm I, albeit at lower affinities than the preferred trisaccharides. The adaptive mutations are reflected by the statistically significant negative correlation observed between the abundance of the FL2-BP gene, but not the FL1-BP gene, and the concentration of 3-FL in infant stools (Fig. 4D). A statistically significant negative correlation was also detected between FL2-BP gene abundance and the concentration of LNFP I These findings emphasize the relevance of the measured SBP affinities to in vivo transporter preferences. Thus, the gain-of-function mutations and the broader conservation of FL2-BP genes compared to FL1-BP in the genomes of different bifidobacterial species represent a possible coevolutionary strategy between Bifidobacterium and humans, which is driven by HMOs. Note that this dual specificity might enable bifidobacteria to adapt to HMOs synthesized by nonsecretors who do not produce 2′-FL but produce a lot of 3-FL in their milk (6). Thus, FL transporter-2 provides a strong fitness advantage for specialization for utilization of the major constituents of HMOs.
CONCLUDING REMARKS
The present study combined with previous results (9, 10, 16, 18) have deciphered the complete and minimum gene set required for FL and LNFP I assimilation in B. infantis (Fig. 5) and expand our understanding on how other infant gut–associated bifidobacterial species use major fucosylated HMOs by either of the FL transporters (B. longum, B. breve, B. pseudocatenulatum, and B. kashiwanohense) or extracellular α-l-fucosidases (B. bifidum) (9). The results obtained from fecal DNA and HMO consumption analyses and deposited metagenomic data analysis reiterate HMOs as prime mediators in the coevolutionary dialog between humans and bifidobacteria. Our findings highlight HMO-specific ABC transporters as a key fitness factor supporting the adaptation and dominance of bifidobacteria in the infant gut ecosystem. Further studies are required to understand which additional HMOs and transporters contribute to shaping a bifidobacteria-rich GM in infants. Such studies are a necessary prerequisite for conducting evidence-based clinical interventions testing supplementation of additional HMO ligands in formula milk.
Fig. 5. Schematic model showing selective growth advantage of bifidobacteria with FL transporter-1 and -2 in the breast-fed infant guts.
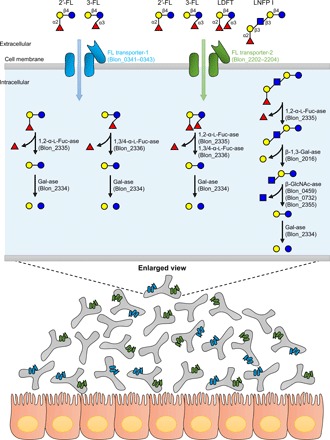
FL transporters and HMO-degrading enzymes are shown with their locus tag numbers of B. infantis ATCC 15697T (GenBank accession no. CP001095.1). Sugars are depicted as in Fig. 1.
MATERIALS AND METHODS
Chemicals
2′-FL, 3-FL, LDFT, and LNT were from Sigma-Aldrich (St. Louis, MO, USA) or as gifts from Glycom A/S (Hørsholm, Denmark). LNnT and LNFP I were from Dextra Laboratories (Reading, UK). LNFP II, 3′-sialyllactose (3′-SL), and 6′-sialyllactose (6′-SL) were from Carbosynth (Berkshire, UK). Melibiose and GOSs were from FUJIFILM Wako Pure Chemical (Osaka, Japan). Maltoheptaose was from Toronto Research Chemicals (Toronto, ON, Canada). Purity of the purchased or gifted sugars is >95% according to material safety data sheets. 2-Aminoanthranilic acid and sodium cyanoborohydride were from Nacalai Tesque (Kyoto, Japan). HMOs were purified from pooled breast milk as described previously (11). The HMOs analyzed in this study accounted for >80% of the purified HMO mixture by weight, and 2% (w/w) Lac was present as impurity based on high-performance liquid chromatography (HPLC) analysis (see below). All other chemicals were of analytical grade.
Bacteria and culture conditions
B. infantis JCM 1222T (=ATCC 15697T) and B. kashiwanohense JCM 15439T were from Japan Collection of Microorganisms (RIKEN Bioresource Center, Tsukuba, Japan), while B. longum 105-A was a gift from Y. Kano at Kyoto Pharmaceutical University, Japan (currently available as JCM 31944 from RIKEN Bioresource Center). For clarity, only the locus tag numbers assigned to the ATCC 15697T (Blon_, GenBank accession no. CP001095.1) are used to describe the identical genes from B. infantis JCM 1222T. Bifidobacteria were anaerobically grown at 37°C in Gifu anaerobic medium (GAM; Nissui Pharmaceutical, Tokyo, Japan) or in de Man, Rogosa, and Sharpe medium (Becton Dickinson, Franklin Lakes, NJ, USA) containing 0.34% (w/v) sodium ascorbate and 0.02% (w/v) cysteine-HCl (MRS-CS) supplemented with 2% (w/v) Glc. When examining sugar utilization, MRS-CS broth was supplemented with 0.5% (w/v) of each sugar. Escherichia coli DH5α was used for genetic manipulations. Antibiotics and the concentrations used were as follows: chloramphenicol (Cm) (2.5 μg/ml for bifidobacteria and 10 μg/ml for E. coli), Sp (30 μg/ml for B. longum, 10 μg/ml for B. infantis, and 75 μg/ml for E. coli), and kanamycin (50 μg/ml for E. coli). InvivO2 400 (10% CO2, 10% H2, and 80% N2; Ruskinn Technology, Bridgend, UK) was used for anaerobic cultivation. Growth was monitored by measuring optical density at 600 nm (OD600) unless otherwise indicated.
Electrotransformation of B. longum and B. infantis
B. longum 105-A and B. infantis JCM 1222T and their derivatives were cultured in 8 ml of GAM. Cells at the exponential phase (OD600 = 0.4 to 0.6) were harvested by centrifugation (19,000g, 5 min, 4°C for B. longum and 5000g, 3 min, 4°C for B. infantis), washed twice with the same volume of ice-cold 1 mM ammonium citrate (pH 6.0) buffer containing 50 mM sucrose, and resuspended in 400 μl (for B. longum) or 200 μl (for B. infantis) of the same solution. Then, the cells (50 μl) were electroporated with 0.1 to 3.0 μg of plasmid DNA (<5 μl) that was isolated from E. coli DH5α with the Wizard Plus SV Minipreps DNA Purification System (Promega, Madison, WI). Gene Pulser Xcell (Bio-Rad Laboratories, Hercules, CA, USA) was used for electroporation under the condition of 10 kV/cm, 25 μF, and 200 ohms (0.2-cm cuvette). The pulsed cells were immediately mixed with 1 ml of anaerobically stored GAM (Nissui). After 3 hours of anaerobic incubation, the cells were spread onto GAM agar plate (Nissui) containing appropriate antibiotics. The plates were incubated anaerobically until colonies were visible (typically 2 to 4 days).
Construction of a host strain for determining physiological substrates of HMO transporters
In vivo substrate specificity of HMO transporters was examined by heterologously expressing the gene clusters in lnbX- and gltA-deficient B. longum 105-A strain with pMSK65 carrying the genes encoding intracellular exo-glycosidases for HMO depolymerization (Fig. 1, A and B) (16). An In-Fusion HD Cloning kit (Clontech Laboratories, Mountain View, CA, USA) was used for ligation henceforth. pMSK65 was constructed as follows: First, the constitutive xfp promoter region (29) and 1,2-α-l-fucosidase gene of B. infantis (Blon_2335) were amplified by polymerase chain reaction (PCR), and the fragments were inserted into Pst I– and Sal I–digested pBFS38 (29), generating pMSK36. Then, the PCR-amplified xfp promoter region, N-acetylglucosaminidase gene (Blon_0459), and LNT β-1,3-galactosidase gene (Blon_2016) were inserted into the Bgl II site of pMSK36 in this order, which yielded pMSK59. Last, the xfp promoter region, 1,3/1,4-α-l-fucosidase gene (Blon_2336), and sialidase gene (Blon_2348) were amplified, and the three fragments were inserted into the Not I site of pMSK59 in that order, resulting in pMSK65.
The gene clusters of FL transporter-1 (Blon_0341–0343) and FL transporter-2 (Blon_2202–2204) from B. infantis JCM 1222T and FL transporter-2 (BBKW_1838–1840) from B. kashiwanohense JCM 15439T that were amplified by PCR were inserted into the Nde I site of pJW241 (30) (a compatible plasmid with pMSK65) under the control of the xfp promoter. The resulting plasmids were introduced into pMSK65-harboring B. longum 105-A ΔlnbX ΔgltA strain. The primers used for strain construction are listed in table S3 (nos. 1 to 12). The PCR-amplified fragments were sequenced to ensure that no base changes other than those planned had occurred.
Targeted gene disruption in B. longum 105-A and B. infantis JCM 1222T
Homologous recombination was used for targeted gene disruption on the genomes of B. longum 105-A ΔlnbX (20) and B. infantis JCM 1222T. Insertional inactivation of the FL2-BP gene in B. infantis JCM 1222T (FL2-BPINS) was accomplished by a single crossover event using a suicide vector as described previously (fig. S2B) (19). The suicide plasmid used for the inactivation was constructed by ligating the PCR-amplified internal region of the FL2-BP gene from B. infantis with 2.0-kb Bam HI–digested fragment of pBS423 carrying pUC ori and Sp resistance gene (SpR) (31). The primers used are listed in table S3 (no. 21).
Markerless gene deletion of gltA in B. longum 105-A ΔlnbX and FL transporter-1 (Blon_0341–0343) and FL transporter-2 (Blon_2202–2204) genes in B. infantis JCM 1222T was conducted by two-step genomic rearrangement events (fig. S2A) (31). The region containing pTB4 ΔrepA ori and pUC ori of the conditional replication plasmid pBS423 ΔrepA (31) was ligated with PCR-amplified upstream and downstream regions of the target genes, between which the SpR gene carrying mutant loxP sites at both ends (lox71-Sp-lox66) (32) was inserted. The resulting plasmid was first integrated into the genome by a single crossover event. Then, the second crossover event was induced by supplying RepA in trans (31). Last, the SpR gene was excised by expressing Cre recombinase from pBFS109 that was constructed by inserting the PCR-amplified cre gene under the control of a cscBA promoter (29) (GenBank accession no. MK854762) into the Nsi I and Not I sites of pBFS38 (29). Disruption at the desired locus was confirmed by genomic PCR and direct sequencing of the amplified fragment. pBFS109 was cured by adding rifampicin to the medium as described previously (31). The primers used are listed in table S3 (nos. 13 to 20 and 22).
Growth competition assay
The WT and double mutant (ΔFL1 FL2-BPINS) strains of B. infantis JCM 1222T were used for competitive growth assays. Cells grown overnight in GAM (Nissui) were separately harvested, and the two cell suspensions were added to MRS-CS supplemented with 0.5% (w/v) GOSs, 2′-FL, or purified HMO mixture to OD600 = 0.002. After incubation at 37°C for 24 hours, the culture was diluted by 100-fold with a new MRS-CS supplemented with the same sugar. Following a further 24-hour incubation, the genomic DNA was extracted from the culture and used for quantification with TaqMan-based assay (Probe qPCR Mix, TaKaRa Bio, Kusatsu, Japan). Primers and a specific probe are listed in table S3 (nos. 23 and 24). The standard curves were created using the genomic DNAs of the respective strains. The assays were conducted in biological triplicates, and the data are expressed as means ± SD.
Expression and purification of recombinant FL1-BP and FL2-BP proteins
FL1-BP and FL2-BP from B. infantis JCM 1222T were expressed as both nontagged and histidine (His)–tagged fusions. The genes encoding the mature proteins of FL1-BP (amino acid residues 32 to 469) and FL2-BP (amino acid residues 26 to 460) were amplified by PCR and inserted into the Nde I and Xho I sites of pCDF23 (33) using primers enlisted in table S3 (nos. 30 and 31). The resulting sequence-verified plasmids were introduced into E. coli BL21 (DE3) ΔlacZ carrying pRARE2 (19). Transformants were grown in LB medium supplemented with Sp and Cm to OD600 = 0.5, and thereafter, the protein expression was induced with isopropyl β-d-thiogalactopyranoside (IPTG) at a final concentration of 0.1 mM. Following overnight incubation at 18°C, cells were harvested, resuspended in 50 mM sodium phosphate buffer (pH 7.0), and disrupted by sonication. The clear lysate obtained by centrifugation was 80% saturated by ammonium sulfate, and the resulting supernatant (>80% fraction) was dialyzed against 20 mM tris-HCl (pH 8.0). Retentates were concentrated with an Amicon Ultra 10 K centrifugal device (Merck Millipore, Burlington, MA, USA) and loaded onto a Mono Q 5/50 GL column (GE Healthcare, Chicago, IL, USA), and proteins were eluted by a linear gradient of 0 to 1 M NaCl in the same buffer. The eluted fractions containing FL-BPs were combined, further purified by size exclusion chromatography using a Superdex 200 Increase 10/300 GL column (GE Healthcare), and used for ITC analysis.
His-tagged proteins were prepared as follows: The genes encoding FL1-BP (amino acid residues 29 to 469) and FL2-BP (amino acid residues 24 to 460) were PCR-amplified and inserted into Nco I and Eco RI sites of pETM11 [a gift from G. Stier, EMBL (European Molecular Biology Laboratory), Center for Biochemistry, Heidelberg, Germany]. The primers used are listed in table S3 (nos. 32 and 33). The recombinant proteins were produced in E. coli BL21 (DE3) as an N-terminal fusion with a TEV (tobacco etch virus nuclear inclusion a endopeptidase)–cleavable His-tag separated by a three–amino acid insertion (Gly-Ala-Met). Protein production was performed by growing the cells in LB medium containing kanamycin at 37°C to OD600 = 0.5; thereafter, the temperature was reduced to 21°C, expression was induced by addition of IPTG to 0.1 mM, and growth was continued for 16 hours. Cells were harvested by centrifugation, resuspended in binding buffer [10 mM Hepes (pH 7.4), 500 mM NaCl, 10 mM imidazole, 10% glycerol, and 0.5 mM dithiothreitol], and lysed by a single passage through a high-pressure homogenizer. After centrifugation, clarified lysates were applied onto a 5-ml HisTrap HP column (GE Healthcare) and purified as recommended by the manufacturer. Eluted pure fractions were pooled, concentrated as described above, applied to a HiLoad Superdex G75 26/60 gel filtration column (GE Healthcare), and eluted with 10 mM MES buffer (pH 6.5) at 1 ml/min. His-tags were cleaved using TEV protease using a standard protocol. Cleaved proteins were recovered after passing through a HisTrap HP column (1 ml) pre-equilibrated with the binding buffer, concentrated as described above, and stored at 4°C until further use. These protein preparations were used for SPR analysis and crystallization. Purity was assessed by SDS–polyacrylamide gel electrophoresis. The protein concentration was determined spectrophotometrically at 280 nm using a theoretical absorption coefficient of 77,810 M−1 cm−1 for FL1-BP and 81,820 M−1 cm−1 for FL2-BP, calculated based on the amino acid sequence.
Binding studies
ITC analysis
Binding thermodynamics of FL1-BP and FL2-BP to carbohydrate ligands were analyzed with MicroCal iTC200 (GE Healthcare). The proteins (45 to 250 μM) were extensively dialyzed against 10 mM sodium phosphate buffer (pH 6.5) and thereafter titrated with different ligands (2 to 10 mM) using 20 injections (0.4 μl for the first injection and 2.0 μl for the following injections separated by 180 s). Data were collected with the c values (c = n [the number of binding sites] × protein concentration × Ka) between 1 and 27. The ITC thermograms were corrected for the heat of dilution (measured by injecting the ligands into the buffer) and analyzed using MicroCal Origin 7.0. A binding model for one set of equivalent sites was fitted to the data to determine association constant (Ka), molar binding enthalpy (ΔH), and binding stoichiometry (n). The data are reported as means ± SD of duplicate experiments.
SPR analysis
Affinities of FL1-BP and FL2-BP to oligosaccharides were also determined using a Biacore T100 instrument (GE Healthcare). The proteins were diluted in 10 mM sodium acetate (pH 4.1) to 2.0 μM and immobilized on a CM5 sensor chip using a random amine coupling kit (GE Healthcare) to a density of 3500 response units. Sensorgrams were recorded and analyzed as described (34). Experiments were performed in duplicates in the range between 1 and 160 μM for 2′-FL, 1 and 100 μM for 3-FL, and 10 and 1 mM for LDFT.
Crystallization and structure determination of FL2-BP
Crystals were only obtained in the presence of 10 mM 2′-FL or 3-FL by vapor diffusion in hanging or sitting drops and grew for 1 week at room temperature at a 1:1 ratio of the native FL2-BP or the selenomethionine (SeMet)–labeled protein [100 mg/ml in 10 mM MES (pH 6.5) and 150 mM NaCl] and reservoir solution [100 mM MES (pH 6.5), 25% polyethylene glycol 500 monomethyl ether (PEG-500MME), and 10 mM ZnSO4]. The SeMet-labeled protein was expressed as previously described (35) and purified similarly as described for WT protein as above. The crystals were flash-frozen in liquid nitrogen without cryoprotectant in nylon loops. Diffraction data were collected to a maximum resolution of 2.1 Å for SeMet-labeled FL2-BP complexed with 2′-FL, 1.3 Å for FL2-BP complexed with 2′-FL, and 1.4 Å for FL2-BP complexed with 3-FL at the European Synchrotron Radiation Facility (ESRF) beamlines, Grenoble, France. All datasets were processed with XDS (36). The SeMet-labeled FL2-BP crystal diffracted to ~1 Å, but we were not able to process it beyond 2.1 Å. The structure was solved in the rhombohedral space group R3 in hexagonal setting (H3) using single-wavelength anomalous diffraction, with the experimental phase information obtained from data collected at the selenium K-edge. The program Phenix.AutoSol (37, 38) identified all selenium atoms in the 13 possible SeMet residues in the FL2-BP. An initial partial model was obtained with Phenix.AutoBuild (39). Further corrections and model building using the program Coot (40) resulted in a complete model, which was used in molecular replacement to solve the structure of FL2-BP in complex with 2′-FL. The models were refined using phenix.refine (41), randomly setting aside 5% of the reflections using identical R-free sets for all refinements. Molecular replacement with the protein part of FL2-BP was used to solve the 3-FL–complexed structure. Ligand molecules were included manually using Coot after the protein atoms were built, and water molecules were added. The overall quality of all models was checked using MolProbity (37). Data collection and refinement statistics are shown in table S1. The two complexes are very similar in conformation and superposition of the individual models results in pairwise overall RMSD of 0.2 Å between aligned Cα atoms. The PyMOL Molecular Graphics System (version 1.7.2.2, Schrödinger, New York, NY, USA) was used to explore the models and for molecular graphics.
Genomic conservation and phylogenetic analysis of FL1-BP and FL2-BP homologs
Conservation of FL1-BP and FL2-BP homologs was analyzed with BlastP using NCBI genomic database available on 31 August 2018 (www.ncbi.nlm.nih.gov/). B. longum SC596 genome was also included in the analysis (12). For phylogenetic tree construction, we used sequences of homologs that span FL1-BP to FL2-BP (these proteins share 60% amino acid identity), i.e., the sequences that share ≥60% identity. On the basis of this threshold, 18 distinct sequences of FL-BP homologs were retrieved and aligned using MAFFT (https://mafft.cbrc.jp/alignment/software/). The resulting multiple sequence alignment was used for classification using the neighbor-joining algorithm on the same server using a standard setting. Logo tags that represent the sequences of different clades were made by WebLogo (https://weblogo.berkeley.edu/logo.cgi) based on the same alignment used to generate the tree.
Sample collection
Fecal samples were collected from 67 healthy Japanese subjects who had not taken any antibiotics for 1 month. Thirty-six healthy breast-fed infants (18 male and 18 female babies, average age = 2.9 ± 1.2 months, age range = 1.4 to 5.7 months) who were born at full term were recruited from Nagao Midwife Clinic (Kyoto, Japan). Breast milk was donated from 32 mothers at the same day when their infant stools were collected. Thirty-one healthy adults (16 males and 15 nonpregnant females who are not kin of the recruited infants, average age = 42.3 ± 16.8 years, age range = 21 to 75 years) were recruited from Ishikawa Prefectural University (Ishikawa, Japan). All samples were frozen immediately after collection and transferred to the laboratories. The samples were subjected to quantitative PCR (qPCR)–based microbial abundance analysis (infant and adult stools) and HMO analysis (breast milk and infant stools) as described later. All samples were blinded before data evaluation.
HMO analysis
HMOs present in breast milk, infant stools, and culture supernatants were fluorescence-labeled and analyzed by HPLC using the method described previously (11). Maltoheptaose was added as an internal standard to breast milk and culture supernatant, while melibiose was used for fecal HMO analysis. Analysis of culture supernatants was carried out in technical triplicates, whereas breast milk and infant stool analyses were carried out once.
Quantification of 16S rRNA and FL transporter genes in feces
Stool DNA was extracted as described previously (20). The copy numbers of the genes attributable to FL1-BP and FL2-BP and 16S ribosomal RNA (rRNA) of total bacteria and genus Bifidobacterium in fecal DNA were quantified using an SYBR Green system (TB Green Premix Ex Taq II, TaKaRa Bio). Relative abundance (%) was calculated by dividing the copy numbers of the transporter genes or genus Bifidobacterium-specific 16S rRNA gene by the total bacterial 16S rRNA gene copies. The average values of technical duplicates (<6% difference of threshold cycle) were reported. The primers used for qPCR analysis were listed in table S3 [nos. 25 to 29; note that two different primer pairs were used for quantifying FL2-BP orthologs (clusters I and II and cluster III)] (Fig. 3D and fig. S6C). Standard curves were created using B. infantis JCM 1222T and B. kashiwanohense JCM 15439T genomic DNAs as templates. The detection limits of our qPCR system for FL1-BP and FL2-BP genes were 1.1 × 10⁴ and 6.3 × 10⁴ copies/g feces, respectively, while that for genus Bifidobacterium was 2.1 × 10⁵ copies/g feces. The specificity of each primer set was confirmed before the analysis.
Metagenome data mining
The dataset of fecal microbiome shotgun sequencing was obtained from MG-RAST version 4.0.3 (http:// metagenomics.anl.gov/) under accession no. “qiime:621” (3). The obtained sequences were quality-trimmed and quality-filtered with custom Perl and Python scripts and publicly available software as follows. After removing sequences less than 60 nucleotide or containing degenerate base (N), all duplicates (a known artifact of pyrosequencing), defined as sequences in which the initial 20 nucleotides are identical and that share an overall identity more than 97% throughout the length of the shortest read, were removed by CD-HIT-454 (42). Host DNA was removed by mapping to the Genome Reference Consortium human build 38 (GRCh38) with Burrows-Wheeler Aligner (BWA) algorithm using maximal exact match (MEM) option (43). Consequently, the shotgun sequencing data of 132,556 ± 76,952 reads per sample (means ± SD) for 83 individuals residing in the United States (n = 50), Malawi (n = 18), and Venezuela (n = 15), which are composed of breast-fed (n = 34) and formula-fed (n = 27) infants (≤1 year old) and adults (n = 22, ≥18 years old), were used for the analysis. The quality filtered reads were mapped to FL1-BP and FL2-BP homologs shown in Fig. 3D, in which redundant mapping to the reference genes was counted as a single by BWA using MEM option. The relative abundance (%) was calculated by dividing the mapped read counts with total read counts. Data of bifidobacterial abundance in fecal samples were also obtained from MG-RAST with the same accession number.
Ethical consideration
This study was reviewed and approved by the Ethics Committees of Kyoto University (R0046), the University of Shiga Prefecture (71-3), and the Ishikawa Prefectural University (2016-2) and was performed in accordance with the Declaration of Helsinki. Informed consent was obtained from all donors except for infants. Infant stools were collected with their mother’s consent.
Statistical analysis
Statistical analyses were performed using Bell Curve for Excel (Social Survey Research Information, Tokyo, Japan). The Student’s two-tailed t test and Mann-Whitney U test were used for determining the statistical significance. For multiple comparisons, Bonferroni correction was applied. Spearman’s rank correlation coefficient analysis was used for examining the relationship between the relative abundances of the transporter genes and the genus Bifidobacterium and between the fecal HMO concentrations and the relative abundance of the transporter genes. A P value of less than 0.05 was considered statistically significant.
Supplementary Material
Acknowledgments
We thank S. Nagao for collecting human samples; Glycom A/S for providing 2′-FL, 3-FL, and LDFT; A. Nakagawa (Ishikawa Prefectural University, Japan) for providing the expression vector pCDF23; Y. Kano for providing B. longum 105-A; Z. Byun (Kyoto University, Japan), N. Ojima (Kyoto University, Japan), H. Koguchi (Technical University of Denmark, Denmark), J.-C.N. Poulsen (University of Copenhagen, Denmark), and the ESRF beamline staff for technical support; and H. Sugahara (Morinaga Milk Industry Co. Ltd., Japan) for fruitful discussion. Funding: This study was supported, in part, by JSPS-KAKENHI (18K14379 to M.S. and 15H04481 and 17K19231 to T.Kata); Grant-in-Aid for JSPS Research Fellows (17J08530 to A.G.); Grants-in-Aid from the Institute for Fermentation, Osaka (K-25-04 to T.Kata, S.K., and M.S.); Independent Research Fund Denmark, Natural Sciences (DFF, FNU) for a Research Project 2 (4002-00297B to M.A.H.); Carlsberg Foundation for instrument grant for ITC200 purchase (2011-01-0598 to M.A.H.); and the Danish Ministry of Higher Education and Science through the Instrument Center DANSCATT for support of synchrotron access (7055-00005B to L.L.L., a member of ISBUC Integrative Structural Biology at the University of Copenhagen; www.isbuc.ku.dk). Author contributions: M.S., M.A.H., and T.Kata conceived the project and designed the experiments. M.S., H.Y., S.F., and A.Y. contributed to bacterial genetic experiments. J.H. and S.K. collected human samples and administered the data. M.K. purified HMO mixture. T.U., M.S., A.G., T.Kato, H.Y., and Y.S. were responsible for HMO analysis. M.S., A.G., and Y.S. analyzed stool DNA. K.Y., T.O., and J.-z.X. contributed to metagenome dataset analysis. M.S. and M.E.H. performed the binding analysis of SBPs. M.E.H. and L.L.L. determined the protein structures. M.S., M.E.H., T.Kata, and M.A.H. wrote the drafted manuscript. All authors discussed the data and contributed to the completion of the final manuscript. T.Kata and M.A.H. edited the manuscript. Competing interests: K.Y., T.O., and J.-z.X. are employees of Morinaga Milk Industry Co. Ltd. The authors declare no other competing interests. Data and materials availability: All data needed to evaluate the conclusions in the paper are present in the paper and/or the Supplementary Materials. The nucleotide sequence of the cre gene under the control of a cscBA promoter in pBFS109 has been deposited in the GenBank/EMBL/DDBJ databases under accession no. MK854762. Atomic coordinates and structure factors of 2′-FL– and 3-FL–complexed FL2-BPs have been deposited in the PDB under accession codes 6HUR and 6HUS, respectively. Additional data related to this paper may be requested from the authors.
SUPPLEMENTARY MATERIALS
Supplementary material for this article is available at http://advances.sciencemag.org/cgi/content/full/5/8/eaaw7696/DC1
Fig. S1. Representative HMO molecules analyzed in this study.
Fig. S2. Schematic representation of two different gene disruption methods used in this study.
Fig. S3. Evaluation of the HMO transporter–heterologous expression system.
Fig. S4. ITC and SPR analyses of SBPs of FL transporter-1 and -2.
Fig. S5. Structural basis of the dual recognition of 2′-FL and 3-FL by FL2-BP from B. infantis JCM 1222T.
Fig. S6. Phylogenetic and structural analyses revealed the signature sequences that dictate specificity difference between FL1-BP and FL2-BP homologs.
Fig. S7. HMO consumption analysis using samples collected from 32 mother-infant pairs.
Table S1. Data collection and refinement statistics for the SBP of FL transporter-2 from B. infantis JCM 1222T (FL2-BP).
Table S2. Polar contacts between FL2-BP and FL molecules.
Table S3. Primers and probes used in this study.
REFERENCES AND NOTES
- 1.Sonnenburg J. L., Bäckhed F., Diet-microbiota interactions as moderators of human metabolism. Nature 535, 56–64 (2016). [DOI] [PMC free article] [PubMed] [Google Scholar]
- 2.Donaldson G. P., Lee S. M., Mazmanian S. K., Gut biogeography of the bacterial microbiota. Nat. Rev. Microbiol. 14, 20–32 (2016). [DOI] [PMC free article] [PubMed] [Google Scholar]
- 3.Yatsunenko T., Rey F. E., Manary M. J., Trehan I., Dominguez-Bello M. G., Contreras M., Magris M., Hidalgo G., Baldassano R. N., Anokhin A. P., Heath A. C., Warner B., Reeder J., Kuczynski J., Caporaso J. G., Lozupone C. A., Lauber C., Clemente J. C., Knights D., Knight R., Gordon J. I., Human gut microbiome viewed across age and geography. Nature 486, 222–227 (2012). [DOI] [PMC free article] [PubMed] [Google Scholar]
- 4.Cox L. M., Yamanishi S., Sohn J., Alekseyenko A. V., Leung J. M., Cho I., Kim S. G., Li H., Gao Z., Mahana D., Zárate Rodriguez J. G., Rogers A. B., Robine N., Loke P., Blaser M. J., Altering the intestinal microbiota during a critical developmental window has lasting metabolic consequences. Cell 158, 705–721 (2014). [DOI] [PMC free article] [PubMed] [Google Scholar]
- 5.Olszak T., An D., Zeissig S., Vera M. P., Richter J., Franke A., Glickman J. N., Siebert R., Baron R. M., Kasper D. L., Blumberg R. S., Microbial exposure during early life has persistent effects on natural killer T cell function. Science 336, 489–493 (2012). [DOI] [PMC free article] [PubMed] [Google Scholar]
- 6.Urashima T., Asakuma S., Leo F., Fukuda K., Messer M., Oftedal O. T., The predominance of type I oligosaccharides is a feature specific to human breast milk. Adv. Nutr. 3, 473S–482S (2012). [DOI] [PMC free article] [PubMed] [Google Scholar]
- 7.Kunz C., Rudloff S., Baier W., Klein N., Strobel S., Oligosaccharides in human milk: Structural, functional, and metabolic aspects. Annu. Rev. Nutr. 20, 699–722 (2000). [DOI] [PubMed] [Google Scholar]
- 8.McGuire M. K., Meehan C. L., McGuire M. A., Williams J. E., Foster J., Sellen D. W., Kamau-Mbuthia E. W., Kamundia E. W., Mbugua S., Moore S. E., Prentice A. M., Kvist L. J., Otoo G. E., Brooker S. L., Price W. J., Shafii B., Placek C., Lackey K. A., Robertson B., Manzano S., Ruíz L., Rodríguez J. M., Pareja R. G., Bode L., What’s normal? Oligosaccharide concentrations and profiles in milk produced by healthy women vary geographically. Am. J. Clin. Nutr. 105, 1086–1100 (2017). [DOI] [PMC free article] [PubMed] [Google Scholar]
- 9.Katayama T., Host-derived glycans serve as selected nutrients for the gut microbe: Human milk oligosaccharides and bifidobacteria. Biosci. Biotechnol. Biochem. 80, 621–632 (2016). [DOI] [PubMed] [Google Scholar]
- 10.Thomson P., Medina D. A., Garrido D., Human milk oligosaccharides and infant gut bifidobacteria: Molecular strategies for their utilization. Food Microbiol. 75, 37–46 (2018). [DOI] [PubMed] [Google Scholar]
- 11.Gotoh A., Katoh T., Sakanaka M., Ling Y., Yamada C., Asakuma S., Urashima T., Tomabechi Y., Katayama-Ikegami A., Kurihara S., Yamamoto K., Harata G., He F., Hirose J., Kitaoka M., Okuda S., Katayama T., Sharing of human milk oligosaccharides degradants within bifidobacterial communities in faecal cultures supplemented with Bifidobacterium bifidum. Sci. Rep. 8, 13958 (2018). [DOI] [PMC free article] [PubMed] [Google Scholar]
- 12.Garrido D., Ruiz-Moyano S., Kirmiz N., Davis J. C., Totten S. M., Lemay D. G., Ugalde J. A., German J. B., Lebrilla C. B., Mills D. A., A novel gene cluster allows preferential utilization of fucosylated milk oligosaccharides in Bifidobacterium longum subsp. longum SC596. Sci. Rep. 6, 35045 (2016). [DOI] [PMC free article] [PubMed] [Google Scholar]
- 13.James K., O’Connell-Motherway M., Bottacini F., van Sinderen D., Bifidobacterium breve UCC2003 metabolises the human milk oligosaccharides lacto-N-tetraose and lacto-N-neo-tetraose through overlapping, yet distinct pathways. Sci. Rep. 6, 38560 (2016). [DOI] [PMC free article] [PubMed] [Google Scholar]
- 14.Matsuki T., Yahagi K., Mori H., Matsumoto H., Hara T., Tajima S., Ogawa E., Kodama H., Yamamoto K., Yamada T., Matsumoto S., Kurokawa K., A key genetic factor for fucosyllactose utilization affects infant gut microbiota development. Nat. Commun. 7, 11939 (2016). [DOI] [PMC free article] [PubMed] [Google Scholar]
- 15.Suzuki R., Wada J., Katayama T., Fushinobu S., Wakagi T., Shoun H., Sugimoto H., Tanaka A., Kumagai H., Ashida H., Kitaoka M., Yamamoto K., Structural and thermodynamic analyses of solute-binding protein from Bifidobacterium longum specific for core 1 disaccharide and lacto-N-biose I. J. Biol. Chem. 283, 13165–13173 (2008). [DOI] [PubMed] [Google Scholar]
- 16.Zúñiga M., Monedero V., Yebra M. J., Utilization of host-derived glycans by intestinal Lactobacillus and Bifidobacterium species. Front. Microbiol. 9, 1917 (2018). [DOI] [PMC free article] [PubMed] [Google Scholar]
- 17.Garrido D., Kim J. H., German J. B., Raybould H. E., Mills D. A., Oligosaccharide binding proteins from Bifidobacterium longum subsp. infantis reveal a preference for host glycans. PLOS ONE 6, e17315 (2011). [DOI] [PMC free article] [PubMed] [Google Scholar]
- 18.Sela D. A., Chapman J., Adeuya A., Kim J. H., Chen F., Whitehead T. R., Lapidus A., Rokhsar D. S., Lebrilla C. B., German J. B., Price N. P., Richardson P. M., Mills D. A., The genome sequence of Bifidobacterium longum subsp. infantis reveals adaptations for milk utilization within the infant microbiome. Proc. Natl. Acad. Sci. U.S.A. 105, 18964–18969 (2008). [DOI] [PMC free article] [PubMed] [Google Scholar]
- 19.Sakurama H., Kiyohara M., Wada J., Honda Y., Yamaguchi M., Fukiya S., Yokota A., Ashida H., Kumagai H., Kitaoka M., Yamamoto K., Katayama T., Lacto-N-biosidase encoded by a novel gene of Bifidobacterium longum subspecies longum shows unique substrate specificity and requires a designated chaperone for its active expression. J. Biol. Chem. 288, 25194–25206 (2013). [DOI] [PMC free article] [PubMed] [Google Scholar]
- 20.Yamada C., Gotoh A., Sakanaka M., Hattie M., Stubbs K. A., Katayama-Ikegami A., Hirose J., Kurihara S., Arakawa T., Kitaoka M., Okuda S., Katayama T., Fushinobu S., Molecular insight into evolution of symbiosis between breast-fed infants and a member of the human gut microbiome Bifidobacterium longum. Cell Chem. Biol. 24, 515–524.e5 (2017). [DOI] [PubMed] [Google Scholar]
- 21.Andreeva A., Howorth D., Brenner S. E., Hubbard T. J. P., Chothia C., Murzin A. G., SCOP database in 2004: Refinements integrate structure and sequence family data. Nucleic Acids Res. 32, D226–D229 (2004). [DOI] [PMC free article] [PubMed] [Google Scholar]
- 22.Holm L., Laakso L. M., Dali server update. Nucleic Acids Res. 44, W351–W355 (2016). [DOI] [PMC free article] [PubMed] [Google Scholar]
- 23.Abe K., Sunagawa N., Terada T., Takahashi Y., Arakawa T., Igarashi K., Samejima M., Nakai H., Taguchi H., Nakajima M., Fushinobu S., Structural and thermodynamic insights into β-1,2-glucooligosaccharide capture by a solute-binding protein in Listeria innocua. J. Biol. Chem. 293, 8812–8828 (2018). [DOI] [PMC free article] [PubMed] [Google Scholar]
- 24.Hehemann J.-H., Correc G., Barbeyron T., Helbert W., Czjzek M., Michel G., Transfer of carbohydrate-active enzymes from marine bacteria to Japanese gut microbiota. Nature 464, 908–912 (2010). [DOI] [PubMed] [Google Scholar]
- 25.Leth M. L., Ejby M., Workman C., Ewald D. A., Pedersen S. S., Sternberg C., Bahl M. I., Licht T. R., Aachmann F. L., Westereng B., Abou Hachem M., Differential bacterial capture and transport preferences facilitate co-growth on dietary xylan in the human gut. Nat. Microbiol. 3, 570–580 (2018). [DOI] [PubMed] [Google Scholar]
- 26.Maldonado-Gómez M. X., Martínez I., Bottacini F., O'Callaghan A., Ventura M., van Sinderen D., Hillmann B., Vangay P., Knights D., Hutkins R. W., Walter J., Stable engraftment of Bifidobacterium longum AH1206 in the human gut depends on individualized features of the resident microbiome. Cell Host Microbe 20, 515–526 (2016). [DOI] [PubMed] [Google Scholar]
- 27.Milani C., Lugli G. A., Duranti S., Turroni F., Bottacini F., Mangifesta M., Sanchez B., Viappiani A., Mancabelli L., Taminiau B., Delcenserie V., Barrangou R., Margolles A., van Sinderen D., Ventura M., Genomic encyclopedia of type strains of the genus Bifidobacterium. Appl. Environ. Microbiol. 80, 6290–6302 (2014). [DOI] [PMC free article] [PubMed] [Google Scholar]
- 28.Milani C., Turroni F., Duranti S., Lugli G. A., Mancabelli L., Ferrario C., van Sinderen D., Ventura M., Genomics of the genus Bifidobacterium reveals species-specific adaptation to the glycan-rich gut environment. Appl. Environ. Microbiol. 82, 980–991 (2016). [DOI] [PMC free article] [PubMed] [Google Scholar]
- 29.Sakanaka M., Tamai S., Hirayama Y., Onodera A., Koguchi H., Kano Y., Yokota A., Fukiya S., Functional analysis of bifidobacterial promoters in Bifidobacterium longum and Escherichia coli using the α-galactosidase gene as a reporter. J. Biosci. Bioeng. 118, 489–495 (2014). [DOI] [PubMed] [Google Scholar]
- 30.Yamamoto S., Wada J., Katayama T., Jikimoto T., Nakamura M., Kinoshita S., Lee K.-M., Kawabata M., Shirakawa T., Genetically modified Bifidobacterium displaying Salmonella-antigen protects mice from lethal challenge of Salmonella Typhimurium in a murine typhoid fever model. Vaccine 28, 6684–6691 (2010). [DOI] [PubMed] [Google Scholar]
- 31.Hirayama Y., Sakanaka M., Fukuma H., Murayama H., Kano Y., Fukiya S., Yokota A., Development of a double-crossover markerless gene deletion system in Bifidobacterium longum: Functional analysis of the α-galactosidase gene for raffinose assimilation. Appl. Environ. Microbiol. 78, 4984–4994 (2012). [DOI] [PMC free article] [PubMed] [Google Scholar]
- 32.Lambert J. M., Bongers R. S., Kleerebezem M., Cre-lox-based system for multiple gene deletions and selectable-marker removal in Lactobacillus plantarum. Appl. Environ. Microbiol. 73, 1126–1135 (2007). [DOI] [PMC free article] [PubMed] [Google Scholar]
- 33.Nakagawa A., Matsumura E., Koyanagi T., Katayama T., Kawano N., Yoshimatsu K., Yamamoto K., Kumagai H., Sato F., Minami H., Total biosynthesis of opiates by stepwise fermentation using engineered Escherichia coli. Nat. Commun. 7, 10390 (2016). [DOI] [PMC free article] [PubMed] [Google Scholar]
- 34.Ejby M., Fredslund F., Vujicic-Zagar A., Svensson B., Slotboom D. J., Abou Hachem M., Structural basis for arabinoxylo-oligosaccharide capture by the probiotic Bifidobacterium animalis subsp. lactis Bl-04. Mol. Microbiol. 90, 1100–1112 (2013). [DOI] [PubMed] [Google Scholar]
- 35.Ernst H. A., Willemoës M., Lo Leggio L., Leonard G., Blum P., Larsen S., Characterization of different crystal forms of the α-glucosidase MalA from Sulfolobus solfataricus. Acta Crystallogr. Sect. F Struct. Biol. Cryst. Commun. 61, 1039–1042 (2005). [DOI] [PMC free article] [PubMed] [Google Scholar]
- 36.Kabsch W., XDS. Acta Crystallogr. D Biol. Crystallogr. 66, 125–132 (2010). [DOI] [PMC free article] [PubMed] [Google Scholar]
- 37.Adams P. D., Afonine P. V., Bunkóczi G., Chen V. B., Davis I. W., Echols N., Headd J. J., Hung L.-W., Kapral G. J., Grosse-Kunstleve R. W., McCoy A. J., Moriarty N. W., Oeffner R., Read R. J., Richardson D. C., Richardson J. S., Terwilliger T. C., Zwart P. H., PHENIX: A comprehensive Python-based system for macromolecular structure solution. Acta Crystallogr. D Biol. Crystallogr. 66, 213–221 (2010). [DOI] [PMC free article] [PubMed] [Google Scholar]
- 38.McCoy A. J., Grosse-Kunstleve R. W., Adams P. D., Winn M. D., Storoni L. C., Read R. J., Phaser crystallographic software. J. Appl. Cryst. 40, 658–674 (2007). [DOI] [PMC free article] [PubMed] [Google Scholar]
- 39.Terwilliger T., SOLVE and RESOLVE: Automated structure solution, density modification and model building. J. Synchrotron Radiat. 11, 49–52 (2004). [DOI] [PubMed] [Google Scholar]
- 40.Emsley P., Cowtan K., Coot: Model-building tools for molecular graphics. Acta Crystallogr. D Biol. Crystallogr. 60, 2126–2132 (2004). [DOI] [PubMed] [Google Scholar]
- 41.Afonine P. V., Grosse-Kunstleve R. W., Echols N., Headd J. J., Moriarty N. W., Mustyakimov M., Terwilliger T. C., Urzhumtsev A., Zwart P. H., Adams P. D., Towards automated crystallographic structure refinement with phenix.refine. Acta Crystallogr. D Biol. Crystallogr. 68, 352–367 (2012). [DOI] [PMC free article] [PubMed] [Google Scholar]
- 42.Niu B., Fu L., Sun S., Li W., Artificial and natural duplicates in pyrosequencing reads of metagenomic data. BMC Bioinformatics 11, 187 (2010). [DOI] [PMC free article] [PubMed] [Google Scholar]
- 43.Li H., Durbin R., Fast and accurate short read alignment with Burrows-Wheeler transform. Bioinformatics 25, 1754–1760 (2009). [DOI] [PMC free article] [PubMed] [Google Scholar]
Associated Data
This section collects any data citations, data availability statements, or supplementary materials included in this article.
Supplementary Materials
Supplementary material for this article is available at http://advances.sciencemag.org/cgi/content/full/5/8/eaaw7696/DC1
Fig. S1. Representative HMO molecules analyzed in this study.
Fig. S2. Schematic representation of two different gene disruption methods used in this study.
Fig. S3. Evaluation of the HMO transporter–heterologous expression system.
Fig. S4. ITC and SPR analyses of SBPs of FL transporter-1 and -2.
Fig. S5. Structural basis of the dual recognition of 2′-FL and 3-FL by FL2-BP from B. infantis JCM 1222T.
Fig. S6. Phylogenetic and structural analyses revealed the signature sequences that dictate specificity difference between FL1-BP and FL2-BP homologs.
Fig. S7. HMO consumption analysis using samples collected from 32 mother-infant pairs.
Table S1. Data collection and refinement statistics for the SBP of FL transporter-2 from B. infantis JCM 1222T (FL2-BP).
Table S2. Polar contacts between FL2-BP and FL molecules.
Table S3. Primers and probes used in this study.