. 2019 Aug 14;8:e49158. doi: 10.7554/eLife.49158

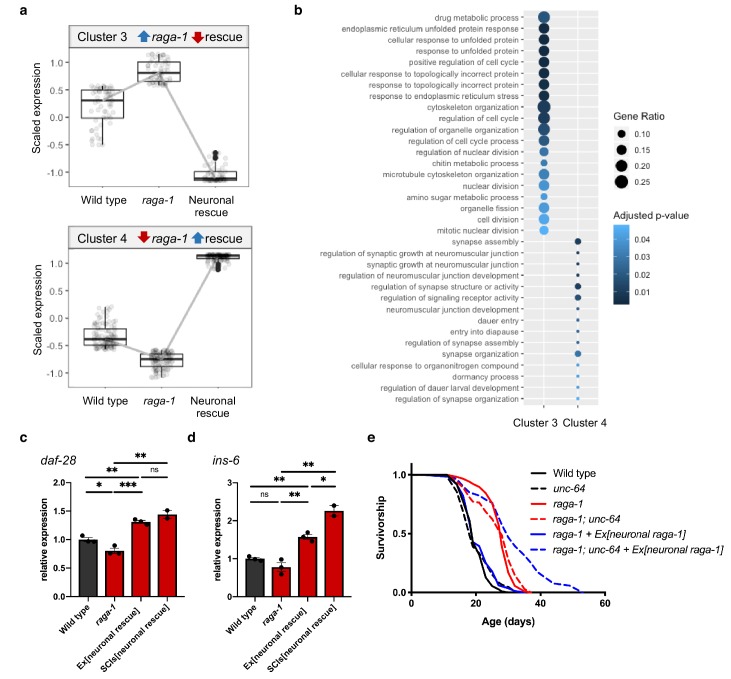
Figure 3. Neuronal TORC1 modulates aging via changes to organelle organization and neuropeptide signaling.

(a) Cluster analysis identified 59 genes that show increased expression in raga-1(ok386) that is reversed by neuronal rescue array (Cluster 3, top) and 107 genes that show decreased expression in raga-1 that is reversed by neuronal rescue (Cluster 4, bottom). (b) Over-representation analysis of the Gene Ontology biological process terms for genes comprising each of the clusters shown in panel (a). (c, d) qPCR to validate increased expression of daf-28 (c) and ins-6 (d) in independent samples. Samples were generated from L4 larvae to match the timepoint of RNA-Seq sample collection. Independent biological replicates were processed and amplified in parallel. ‘Ex[neuronal rescue]’ refers to raga-1(ok386) animals rescued by extrachromosomal array, ‘SCIs[neuronal rescue]’ refers to raga-1(ok386) animals rescued by single copy insertion. P values determined by 2-tailed t test. Source data are provided in Figure 3—source data 1. (e) The unc-64(e246) hypomorphic allele significantly extends lifespan in raga-1 neuronal rescue background (p<0.0001), but not in wild type (p=0.3449) or raga-1 mutant (p=0.2708). n = 3 independent biological replicates, sample size ranges between 64–121 deaths per treatment each replicate. P values are calculated with Log-rank (Mantel-Cox) test. Details on strains and lifespan replicates can be found in Supplementary file 6.

Figure 3—source data 1. Figure 3c and d qPCR of daf-28 and ins-6.
DOI: 10.7554/eLife.49158.017

Figure 3.

Figure 3—figure supplement 1. Gene clusters and differentially represented GO terms identified by analysis of RNA-seq.

Figure 3—figure supplement 1.

(a) Plot depicting the profiles of gene expression defining each cluster of differentially expressed genes. Most differentially expressed genes in raga-1(ok386) are not rescued by the neuronal raga-1 array. Clusters 1 and 2 contain 1737 and 2325 genes, respectively, that show similar changes in expression in both raga-1 samples and in samples with neuronal rescue. Cluster 3 contains 59 genes that show increased expression in raga-1 that is reversed by neuronal rescue, Cluster 4 contains 107 genes that show decreased expression in raga-1 that is reversed by neuronal rescue. (b) Over-representation analysis of Gene Ontology biological process terms for significant genes identified from pair-wise analysis of raga-1 samples relative to WT and in neuronal rescue samples relative to WT.
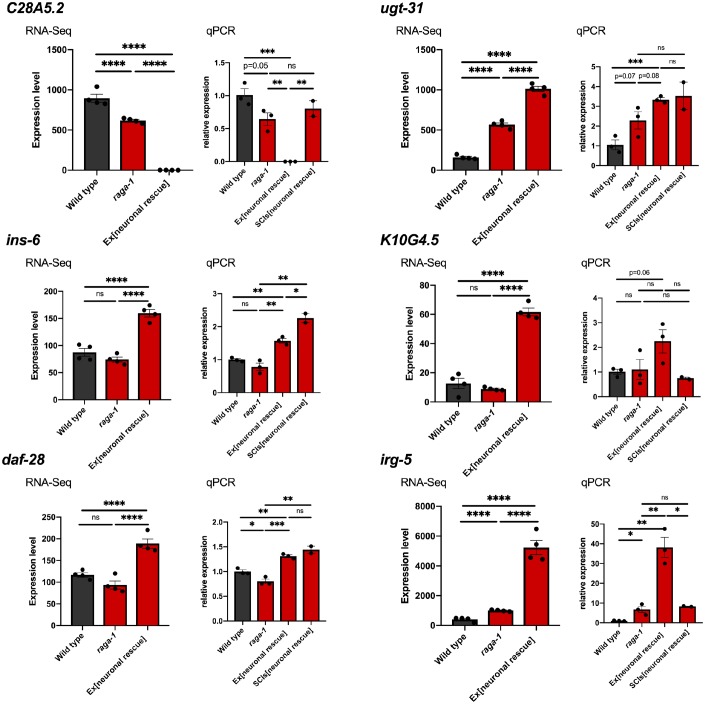
Figure 3—figure supplement 2. Validation of changes identified by RNA-seq in independent biological samples.

Figure 3—figure supplement 2.

Independent biological samples were collected and tested for gene expression changes identified by RNA-Seq by qPCR. Three new samples for each strain used in the RNA-Seq experiment (wild type (N2), raga-1(ok386), and neuronal rescue strain) as well as two samples from the single copy transgene neuronal rescue line were collected as L4 staged larvae, processed, tested, and analyzed in parallel. Genes selected for validation were among the most significantly changed genes in pairwise comparison between raga-1 and neuronal rescue. For each gene, the expression profile obtained by RNA-Seq is plotted to the left, and relative expression determined in new samples by qPCR is plotted to the right. The qPCR results for ins-6 and daf-28 shown in Figure 2e are shown again here for comparison to values obtained by RNA-Seq. Data are presented as mean ± s.e.m. P value: NS no significance, *<0.05, **<0.01, ***<0.001, ****<0.0001 relative to controls. Statistical significance for qPCR was determined by two-tail t-test. Significance values for RNA-Seq are corrected for false discovery rate. Source data are provided in Figure 3—figure supplement 2—source data 1.
Figure 3—figure supplement 2—source data 1. Figure 3—figure supplement 2 qPCR validation of RNA seq results.
DOI: 10.7554/eLife.49158.018
Figure 3—figure supplement 3. Neuronal raga-1 regulates ins-6 expression in adults.

Figure 3—figure supplement 3.

Relative expression of ins-6 in animals at day 1 of adulthood as determined by qPCR. Points plotted are from independent biological samples. Error bars denote mean + /- SEM. P values determined by 2-tailed t test. Source data are provided in Figure 3—figure supplement 3—source data 1.
Figure 3—figure supplement 3—source data 1. Figure 3—figure supplement 3 qPCR of ins-6 in day 1 adults.
DOI: 10.7554/eLife.49158.019