Abstract
Background:
Brain-death associated inflammation has been implicated in decreased kidney allograft function and survival, but the underlying mechanisms have not been well distinguished from the conditions of critical care itself. We have developed a clinically translatable model to separate and investigate strategies to improve donor management and critical care.
Methods:
Brain-dead (n=12) and sham (n=5) rhesus macaques were maintained for 20 hours under ICU-level conditions. Samples were collected for immunophenotyping, analysis of plasma proteins, coagulation studies, and gene analysis for changes in immune and metabolic profile with comparison to naive samples (n=10).
Results:
We observed an increase in circulating leukocytes and cytokines, activation of complement and coagulation pathways, and upregulation of genes associated with inflammation in both brain-dead and sham subjects relative to naïve controls. Sham demonstrated an intermediate phenotype of inflammation compared to brain-death. Analysis of gene expression in kidneys from brain-death kidneys revealed a similar upregulation of inflammatory profile in both BD and sham subjects, but BD presented a distinct reduction in metabolic and respiratory processes compared to sham and naïve kidneys.
Conclusion:
Brain death is associated with activation of specific pathways of the innate immune system and changes to metabolic gene expression in renal tissue itself, however sham donors presented an intermediate inflammatory response attributable to the critical care environment. The early onset and penetrating impact of this inflammatory response underscores the need for early intervention to prevent peri operative tissue injury to transplantable organs.
Introduction
The incidence of end-stage renal disease (ESRD) is growing around the world. At 700,000 diagnosed cases in the US and surrounding territories, the number of patients increases by 3.4% per year.1 To date, the best treatment option for ESRD is kidney transplantation. However, there are over 84,000 patients on the kidney transplant waiting list and only 19,000 such transplants are performed in the US each year.1 While campaigns are underway to expand living donation, 70% of all kidney transplants originate from deceased donation.1 Kidney transplantation from deceased donation is associated with increased graft failure rates for recipients of brain death (BD) donor kidneys when compared to living donation (52% at ten years compared to 34% for living donation) as well as reduced patient survival.2
Donor hemodynamic instability coupled to the initiation of in situ inflammatory processes, elevated levels of damage-associated molecular pattern signaling molecules (DAMPs), the release of inflammatory cytokines, stress hormones, and activation of innate immune effector cells have all been described as factors contributing to poor transplant outcomes.3–5 The interaction of inflammatory cells, cytokines, complement activation, coagulation pathways has been well characterized, but the specific role of innate immunity in the context of BD has received less attention.6–9
To investigate and distinguish BD-specific changes from those attributable to the conditions implicit to critical care and organ recovery, we utilized a uniquely translatable large animal model mimicking a clinical environment. By isolating the effects of BD from those related to intensive care, we aim to uncover factors contributing to the disparity observed in graft survival from living and deceased donation and to foster therapeutic strategies that improve critical care and donor management toward better transplant outcomes.
Methods:
Animal Model
Rhesus macaques housed at the Wisconsin National Primate Research Center, University of Wisconsin Madison, were used in accordance with Institutional Animal Care and Use Committee (IACUC) guidelines. Experiments were conducted under a protocol approved by the UW School of Medicine and Public Health IACUC.
Brain death was performed as previously described.10 Briefly, animals were intubated and maintained under general anesthesia, catheters were placed in the femoral artery and vein for blood sampling, pressure monitoring, and fluid and vasopressor resuscitation. Brain death was induced by cutting a burr-hole through the skull and inflating a 14F Foley catheter between the skull and dura mater. After brain death was determined, the animal was maintained hemodynamically stable for 20 hours with ventilatory support, vasoactive drugs, IV fluids administration, correction of pH or electrolyte abnormalities, and thermal blankets to prevent hypothermia. Blood samples were collected prior to brain death induction (baseline), 12-hours, and 20-hours post induction. Technical limitations prevented sampling of of some animals during the experimental period, all available samples the passed internal quality control tests were used for each analysis (refer to figure legends). At 20-hours animals underwent a midline laparotomy followed by surgical dissection to free the kidneys from neighboring structures. Excised kidneys were flushed with cold UW solution and biopsies were collected for RNA, protein, and immunohistochemistal analysis.
Sham donors were anesthesized and maintained and sampled using the same protocol described above, however after scalp incision trepanotomy was not performed. Renal biopsies were collected in situ along with biopsies of liver and spleen.
Renal biopsies were also collected from naïve animals.
Colorimetric Assays of Coagulation, Fibrinolysis, Contact, and Complement factors
Blood was collected into Vacuettes® (Greiner Bio-One, Austria) and centrifuged 10 minutes at 3000xg, serum and EDTA-plasma were aliquoted and stored at −80°C.
Serum albumin was measured (VetTest Analyzer, Idexx, Westbrook, ME). Individual sandwich ELISA kits (AbCam, Cambridge, UK) were validated to rhesus macaque plasma/sera and linear range was determined. Thrombin was measured at 1:200 in serum (AB108909). EDTA-plasma dilutions were as follows: fibrinogen 1:90,000 (AB108841); vWF 1:200 (AB189571); tissue-type plasminogen activator (tPA) 1:20 (AB119563); Factor-XII 1:500 (AB192144); serum kallikrein 1:2500 (AB202405); prekallikrein 1:4000 (AB171015); plasminogen 1:10000 (AB108893). Bradykinin was prepared using a non standard method: blood was collected into potassium-EDTA Vacuettes® and immediately fixed 1:4 in ice-cold ethanol, centrifuged 10 minutes at 1000xg at 4°C, supernatant was stored at −80°C until lyophilization using a refrigerated SpeedVac™ concentrator (Thermo-Scientific,Waltham,MA), residual solid was reconstituted in 500μL assay buffer (AB136936) at a 1:4 dilution from the original sample. All ELISAs were completed per manufacturer provided instructions in duplicate or triplicate.
C3d was separated from intact, non activated C3 in EDTA-plasma by polyethylene-glycol (PEG) precipitation and measured by sandwich ELISA as previously described11. sC5b-9 levels were assessed directly in EDTA-plasma by specific sandwich ELISA12. Optical density (OD) was measured at 450nm using a microplate reader (Bio-Rad, Hercules, CA). Zymosan-activated human serum was used as a standard and resuspended at 1000 AU/ml.
All measured serum/plasma protein levels were normalized to serum albumin to account for hemodilution.
PT/aPTT
Blood collected into sodium-citrate Vacuettes® was centrifuged 10 minutes at 3000xg, plasma aliquoted and stored at −80°C. Activated partial thromboplastin time (aPTT) (#022926; Thermo-Fisher Scientific, USA) and prothrombin time (PT) (#176065) tests were performed according to manufacturer recommended instructions.
Complement Analysis
Classical, lectin, and alternative complement pathway activities were assayed with the Wieslab® Complement system screen (EuroDiagnostica, Sweden) according to manufacturer instructions. Assay linear range for macaque serum samples were 1:300 (classical pathway), 1:500 (lectin pathway), and 1:11 (alternative pathway). Results were normalized to serum albumin to account for hemodilution.
Circulating Cytokines
Circulating levels of IL-6, IL-8, MCP-1, and TNFα in EDTA-plasma were measured with Biolegend LEGENDplex™ NHP Mix-and-Match Subpanel according to manufacturer recommended protocols. Results were normalized to serum albumin to account for hemodilution.
Complete Blood Counts (CBC)
Automated and manual differential blood counts were measured from blood collected into potassium-EDTA Vacuettes® within 4 hours by a Beckman-Coulter UniCel® DxH-800 or trained technician.
Flow Cytometry
Blood collected into sodium-heparin Vacuettes® was stained for cell-surface antigens within 15 minutes of collection following manufacturer recommended protocols. Additional aliquots were incubated at 37°C for 20 minutes in Modified-Krebs-Ringers-Buffer in the presence or absence of an agonist cocktail: platelet activating factor-16 (1 μM), IL-8 (6 nM), and C5a (6 nM) (R&D-Systems, Minneapolis, MN). Following incubation of stimulated aliquots, samples were cooled on ice and stained for cell-surface antigens following manufacturer recommended protocols. Samples were lyse/fixed for 20 minutes in BD FACS™ lysing solution (BD-Biosciences, Franklin Lakes, NJ) and washed in PBS prior to acquisition on a Cytek-DxP upgraded BD-FACSCalibur™ and analysis with FlowJo software (Treestar Inc., Ashland, OR). Staining panels were validated for rhesus macaque: CD177-FITC (MEM-166, Biolegend, San Diego, CA); CD159a-PE (Z199, Beckman-Coulter, Krefeld, Germany); IgD-FITC (polyclonal, Southern Biotech, Birmingham, AL); CD19-PE (CB19, Novus Biologicals, Littleton,CO); CD38-APC (OKT10, NIH, Bethesda, MD); and CD32-PE (FL18.26), CD45-PerCP or -FITC (D058–1238), CD62L-Alexa Fluor 647 (SK11), CD11b-APC-Cy7 (ICRF44), CD14-PerCP-Cy5.5 (M5E2), HLA-DR-APC (G46–6), CD16-APC-Cy7 (3G8), CD27-PerCP-Cy5.5 (MT271), CD20-APC-H7 (2H7), CD4-PerCP (L200), CD3-APC (SP34–2), CD8-APC-Cy7 (SK1) (all BD-Biosciences), along with applicable isotype-control antibodies. Gating strategies are described in Figure S1.
Immunohistochemistry:
Formalin-fixed renal biopsy tissue was embedded in paraffin, mounted onto slides, and stained for myeloperoxidase (MPO) (rabbit-polyclonal, Abcam), and CD68 (KP1, DAKO-Agilent). The HIER method was used for antigen retrieval (BioGenex, San Ramon, CA). Images from 12 random fields within each slide were acquired at 400× magnification using an Olympus BX51 microscope (Olympus, Tokyo, Japan) and processed using ImageJ software (NIH, Bethesda, MD). Cell counts for each image were quantified using color-separation and background-subtraction, automatic thresholding (e.g., Maximum-Entropy, Triangle, Huang), and particle-analysis algorithms.
Microarray:
DNA-free RNA was isolated from frozen renal biopsy samples according to manufacturer recommended protocols (Qiagen, Hilden, Germany) and quality-tested with NanoDrop™ (Thermo-Scientific) and RNA Pico Kit (Agilent). Individual kidneys were treated as distinct samples, all available tissue that passed quality control was included in the analysis. RNA from BD (n=16), Sham (n=6), and naïve (n=12) kidneys were labeled with GeneChip® WT Pico Kit, applied to Rhesus Gene 1.0 ST arrays, and processed on a Fluidics450 Station according to manufacturer instructions (Affymetrix, Santa Clara, CA). Data was extracted from images scanned on a GC3000-G7 device using the Affymetrix command console.
Statistics:
Measured values for each group at each time-point were tested for normality per Kolmogorov–Smirnov, differences between time-points within each group were compared by 1-way repeated-measures ANOVA with Bonferroni-correction, while differences between groups were compared by ANOVA or unpaired two-tailed T-test with Welch’s correction as applicable (Prism 4;Graphpad,La Jolla,CA). Microarray CEL-files were analyzed with Affymetrix Expression console, resulting CHP-files were analyzed with Affymetrix Transcription Analysis Console (TAC) 4.0 by ANOVA with Bonferroni-correction. NetAffx™ expression center was used to confirm and correct gene identifiers, gene enrichment analysis specific GO terms (GO database release 20190101) was performed with PANTHER14.0 overrepresentation test (Release 20181113) (Fisher’s exact binomial, Bonferonni correction), expression threshold >2-fold, FDR<0.05.13
Results:
Individual demographics and serum albumin levels
The sex, age, and weight of each animal in each group is presented in Table 1. Values were not statistically different between BD, sham, and naïve animals.
Table 1:
Animal demographics
| Animal ID | Age (years) | Weight (kg) | Sex |
|---|---|---|---|
| Brain Death Group (n=12) | |||
| RH2016 | 17.8 | 10.3 | Female |
| RHAS84 | 20.8 | 10.3 | Female |
| RH2603 | 16.8 | 8.0 | Female |
| RH2602 | 16.7 | 8.4 | Female |
| RH2030 | 21.2 | 11.4 | Female |
| R12072 † | 3.9 | 5.5 | Male |
| RH2609 † | 6.3 | 5.3 | Female |
| RH2715 | 5.8 | 5.9 | Female |
| RH2626 | 7.2 | 9.4 | Male |
| RH2728 | 6.9 | 10.3 | Male |
| RH2638 | 11.0 | 10.9 | Female |
| RH2731 | 7.3 | 11.3 | Male |
| Average | 11.8 ± 6.4 | 8.9 ± 2.3 | |
| Sham Procedure (n=5) | |||
| R12072 † | 4.2 | 5.5 | Male |
| RH2609 † | 6.5 | 5.3 | Female |
| RH1966 | 19.5 | 11.0 | Female |
| RH2620 | 13.0 | 13.4 | Male |
| RH2618 | 6.0 | 9.9 | Male |
| Average | 9.8 ± 6.4 | 9.0 ± 3.5 | |
| Naïve (n=10) | |||
| R13009 | 3.8 | 6.6 | Male |
| R11107 | 3.9 | 6.6 | Male |
| R11051 | 4.4 | 7.4 | Male |
| RH2613 | 3.7 | 5.1 | Female |
| RH2610 | 4.8 | 5.9 | Female |
| RH2612 | 3.9 | 5.1 | Female |
| NHP40 | 16.9 | 11.2 | Female |
| NHP46 | 21.0 | 14.2 | Male |
| NHP54 | 18 | -- | Female |
| NHP55 | 19 | -- | Female |
| Average | 9.9 ± 7.6 | 7.8 ± 3.2 | |
Animals R12072 and RH2609 underwent the Sham procedure prior to being assigned to the Brain Death group.
Individual animal ID, weight, age, sex, according to group. There were no significant differences between groups as tested by 1-way ANOVA with Bonferonni correction.
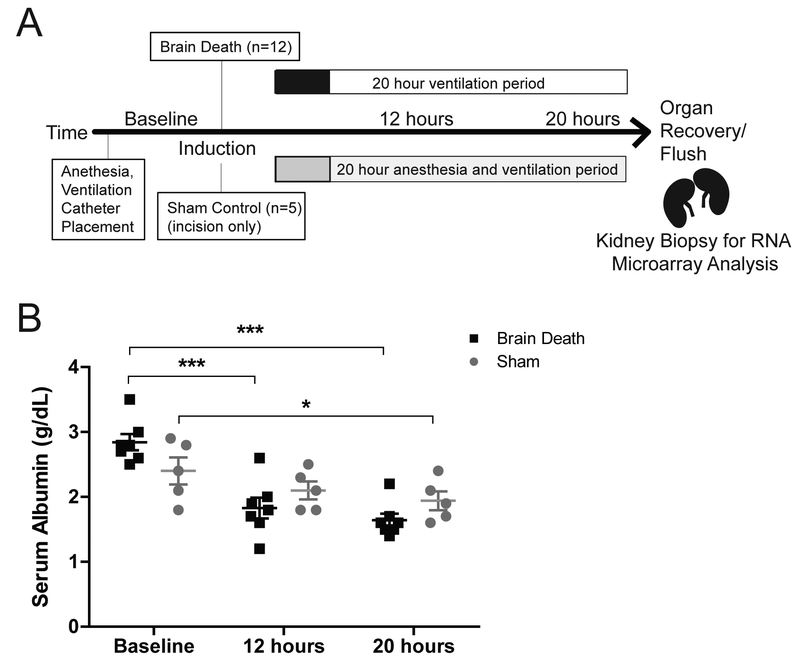
As a result of IV fluid resuscitation and electrolyte correction, serum albumin was significantly reduced in both BD and sham after 20 hours (p<0.001, p<0.01 respectively) (Fig.1b). Values were similar between groups for each time-point.
Figure 1. Experimental design and serum albumin.
(A) Experimental Design. Brain death was induced by inflation of a 14F Foley catheter through a burr hole in the skull. Sham animals received only an incision in the scalp. Both groups were maintained on a ventilator under ICU conditions. (B) Serum albumin decreased significantly in both sham (n=5) and BD (n=7) over 20 hours. No significant differences were detected between groups. Data presented as average value, +SEM. Time-point values within each group were compared by 1-way repeated measures ANOVA with Bonferonni correction. Differences between groups at each time-point were compared by unpaired T-test. *p<0.05, ***p<0.0001.
Innate Immune Effector Cells
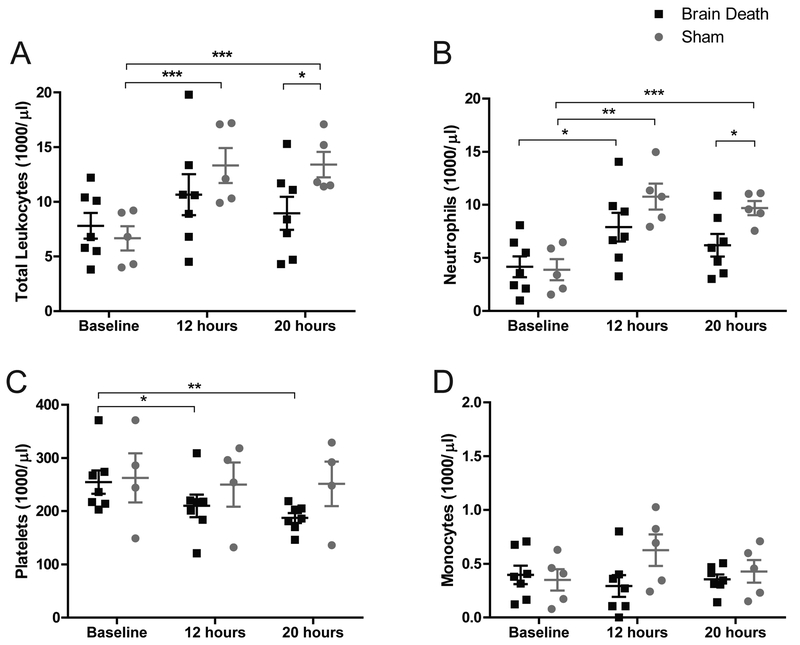
CBC performed at baseline, 12, and 20-hours denote leukocytosis in both groups with a sustained increase in sham through 20-hours compared to baseline. Leukocyte counts were significantly higher at 20-hours in sham compared to BD (13.4 vs 8.9×10³/μl, p<0.05), as were neutrophil counts (9.7 vs 6.2×10³/μl, p<0.05). Neutrophils increased significantly over baseline values in both groups (p<0.05 for BD, p<0.01 for sham) while other leukocyte values changed minimally. BD animals experienced a significant decrease in platelet counts, from 255 to 187×103/μl after 20-hours (p<0.01), while sham counts remained steady (Fig.2a–d).
Figure 2. Complete blood counts: leukocytes, neutrophils, monocytes, & platelets.
(A) Sham animals present a significant increase in circulating leukocytes at 12 and 20 hours compared to baseline and total leukocyte counts were significantly higher in sham than in BD at 20 hours. Increased leukocyte numbers in BD animals did not attain statistical significance between time-points. (B) Both groups present a significant increase in circulating neutrophils at 12 hours compared to baseline. Sham neutrophil counts at 20 hours were also significantly higher than baseline and were significantly higher than BD counts at the same time-point. (C) There was a significant decrease in BD platelet counts at 12 and 20 hours compared to baseline with no comparable change in sham counts. (D) We observed a modest spike in monocyte counts at 12 hours in Sham animals, but no statistical difference was observed between groups or time points. BD (n=7), sham (n=5). Data are presented as average, +SEM. Time-point values within each group were compared by 1-way repeated measures ANOVA with Bonferonni correction. Differences between groups at each time-point were compared by unpaired T-test. ***p<0.001, **p<0.01, *p<0.05.
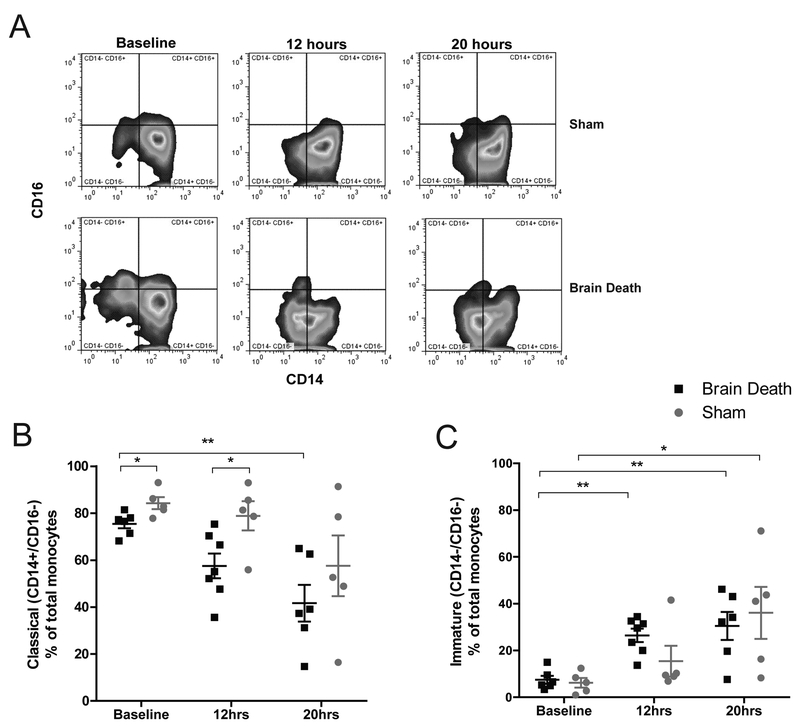
Flow cytometry was used to characterize circulating monocyte subpopulations according to CD14/CD16 surface expression.14 A significant decrease in classical (CD14+/CD16-) monocyte phenotype was observed in BD from baseline to 20-hours (p<0.01) with a corresponding increase in immature monocytes (CD14-/CD16-)(p<0.01)(Fig.3a–c). A similar trend was observed in sham, which also evinced a significant increase in immature monocytes after 20 hours (p<0.05). Circulating classical monocyte percentages were statistically different between groups at baseline and 12-hours (p<0.05).
Figure 3. Examination of monocyte phenotype.
(A) Representative flow plots of monocyte phenotype observed in BD and sham animals at baseline, 12, and 20 hours according to CD14 ×CD16 staining-profile. (B) The percentage of classical (CD14+ CD16-) monocytes was significantly lower in BD animals at 20 hours compared to baseline; BD values are also significantly lower at baseline and 12 hours compared to sham at the same time points. Classical monocytes in sham animals at 20 hours were lower than baseline, but the difference did not attain statistical significance. (C) Compared to baseline, the percentage of immature (CD14- CD16-) monocytes was significantly higher in BD animals at 12 hours and in both sham and BD animals by 20 hours, with no statistical differences detected between groups at the same time points. BD (n=6), sham (n=5), data are presented as average, +SEM. Time-point values within each group were compared by 1-way repeated measures ANOVA with Bonferonni correction. Differences between groups at each time-point were compared by unpaired T-test. **p<0.01, *p<0.05.
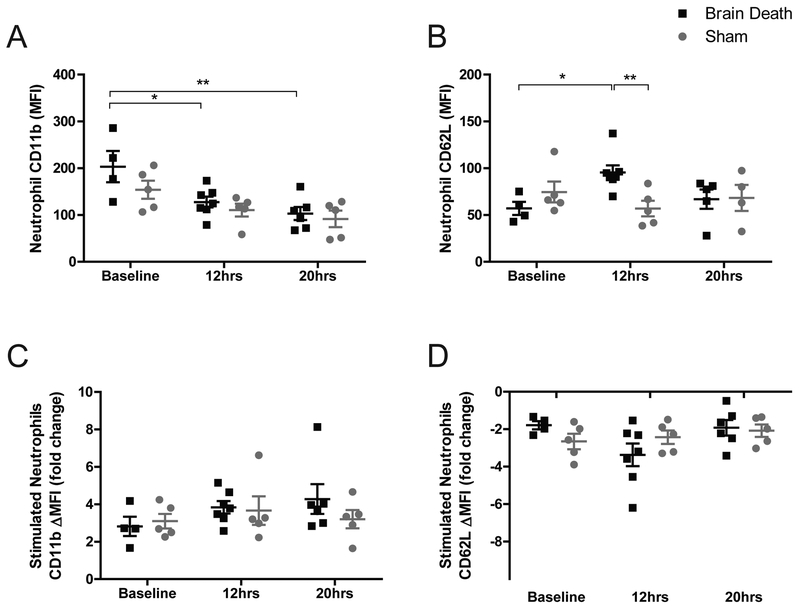
Neutrophils were also analyzed, with particular focus on CD11b (MAC1) and CD62L (L-selectin) surface expression (MFI). Neutrophils, comprising the majority of peripheral leukocytes, showed a significant decrease in CD11b expression in BD at 12 and 20 hours compared to baseline (p<0.05, p<0.01), a similar trend in sham did not attain significance (Fig.4a). CD62L expression was elevated over baseline at 12-hours in BD (p<0.05) and was significantly different from sham values (p<0.01) but returned to baseline levels after 20-hours (Fig.4b). Samples stimulated in vitro with an agonist cocktail increased CD11b expression and reduced CD62L expression, but no significant differences were observed between groups at any of the time points tested (Fig.4c–d).
Figure 4. Changes in neutrophil phenotype CD11b / CD62L.
(A) Neutrophil CD11b MFI was significantly lower in BD animals at 12 and 20 hours compared to baseline, but no differences between groups were observed at any time-point. (B) Neutrophil CD62L MFI was significantly higher in BD at 12 hours compared to baseline and compared to sham at the same time-point. (C-D) Samples were stimulated in vitro with exogenous PAF, IL8, and C5a. ΔMFI Fold change was calculated by dividing the MFI of each stimulated sample by the MFI of an unstimulated replicate for each sample. No significant differences were observed for (C) CD11b or (D) CD62L in the compared groups and time-points. BD (n=6), Sham (n=5), data are presented as average, +SEM. Time-point values within each group were compared by 1-way repeated measures ANOVA with Bonferonni correction. Differences between groups at each time-point were compared by unpaired T-test. **p<0.01, *p<0.05.
Circulating Cytokines
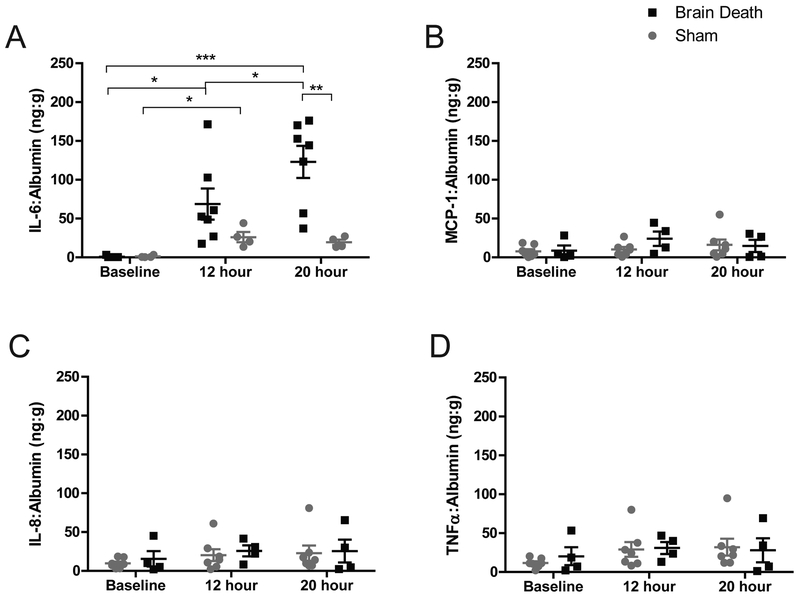
Plasma IL-6 was elevated 160-fold over baseline in BD at 20-hours (p<0.001). Sham IL-6 achieved a 23-fold increase over baseline (p<0.05) but was significantly less than the BD group at 20-hours (p<0.01)(Fig.5a). Levels of IL-8, MCP-1, and TNFα were elevated in both groups but the comparison did not achieve a statistical difference between time-points or treatment groups (Fig.5b–d).
Figure 5. Circulating plasma cytokines levels.
(A) Circulating IL-6 significantly increased from baseline to 12 hours in both groups. In BD, IL-6 was also significantly elevated at 20 hours compared to baseline, 12 hours, and also compared to sham at the same time-point. Modest increases were observed in (B) MCP-1, (C) IL-8, (D) TNF? in both groups by 20 hours, but changes did not attain statistical significance between groups or time-points. BD (n=7), Sham (n=4), data are presented as average values normalized to albumin, +SEM. Time-point values within each group were compared by 1-way repeated measures ANOVA with Bonferonni correction. Differences between groups at each time-point compared by unpaired T-test. ***p<0.001, **p<0.01, *p<0.05.
Complement activation
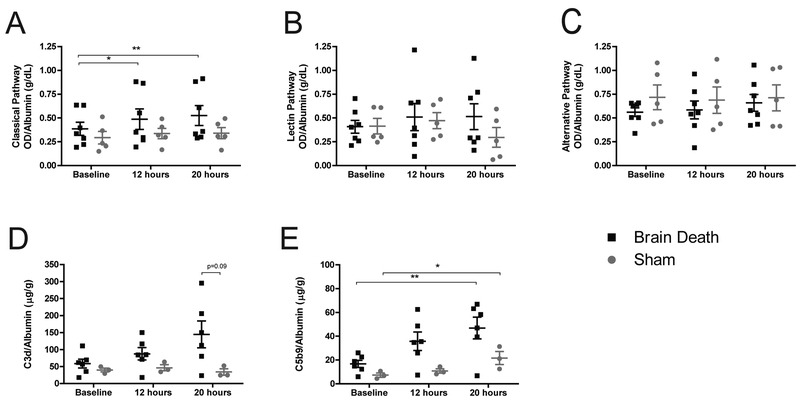
The classical complement pathway (background-subtracted optical density normalized to albumin) showed significant increases at 12 and 20-hours compared to baseline in BD but not in sham (p<0.05, p<0.01). Comparisons between groups at each time revealed no significant differences (Fig.6a). The lectin and alternative pathways showed no significant differences between groups or time-points (Fig.6b–c). Soluble C3d and C5b-9 were measured as indirect indicators of complement activation. BD showed a strong trend toward increased C3d but levels did not attain statistical significance nor distinguish themselves from sham values (Fig.6d). Soluble C5b-9 significantly increased in both groups at 20-hours compared to baseline (p<0.01, p<0.05), and while BD evinced a trend toward higher concentrations of C5b-9, statistical difference from sham was not achieved (Fig.6e).
Figure 6. The role of complement activity.
(A) Classical complement pathway showed a significant increase in BD animals at 12 and 20 hours compared to baseline, with no comparable increase in sham animals. There were no significant differences between sham and BD values at each time-point. (B) The lectin and (C) alternative pathways of complement activation showed no significant change between groups or time-points. (D) Soluble C3d increased in BD over time, but did not reach statistical significance. (E) Soluble C5b-9 significantly increased in both BD and sham animals at 20 hours compared to baseline. Differences between groups did not reach statistical significance. A-C, BD (n=7), sham (n=5), data presented is average background-subtracted optical density (OD) normalized to albumin, +SEM. D-E: BD (n=6), sham (n=3), data presented is average value normalized to albumin, +SEM. Time-point values within each group were compared by 1-way repeated measures ANOVA with Bonferonni correction. Differences between groups at each time-point were compared by unpaired T-test. *p<0.05, **p<0.01
Circulating coagulation and contact factors
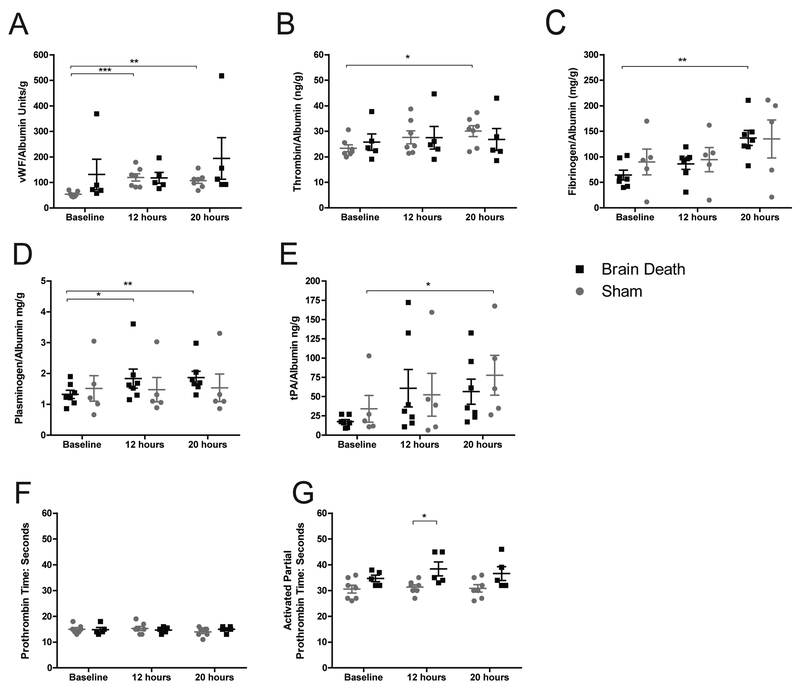
Coagulation factors vWF, thrombin and fibrinogen were significantly elevated in BD compared to baseline (p<0.01, p<0.05, p<0.01 respectively)(Fig.7a–c). Pro-fibrinolytic plasminogen was also elevated in BD p<0.01) while tPA significantly increased only in the sham (p<0.05)(Fig.7d–e). A significant difference between BD and sham aPTT values was evident at 12-hours (p<0.05), but both PT and aPTT coagulation times remained near baseline values and within the normal range for all samples (Fig.7f–g).
Figure 7. Factors involved in coagulation and fibrinolysis.
(A) Circulating vWF significantly increased at 12 and 20 hours compared to baseline, but was not significantly different from sham. (B) Thrombin and (C) fibrinogen also significantly increased over baseline by 20 hours in BD animals. (D) Plasminogen significantly increased in BD animals at 12 and 20 hours compared to baseline. (E) Tissue-type plasminogen activator (tPA) showed an increase that was significant in sham animals at 20 hours compared to baseline, although a trend toward increasing tPA was evident in both groups at both 12 and 20 hours. No significant differences between groups were detected (A-E). (F) Activated partial thromboplastin time (aPTT) was significantly longer in sham groups at 12 hours, however values remained within normal ranges. (G) PT remained near baseline values and within normal ranges for all animals. A-E: BD (n=7), sham (n=5), data presented is average value normalized to albumin, +SEM. F-G: BD (n=7), sham (n=5), data presented is average value, +SEM. Time-point values within each group were compared by 1-way repeated measures ANOVA with Bonferonni correction. Differences between groups at each time-point were compared by unpaired T-test. *p<0.05, **p<0.01, ***p<0.001.
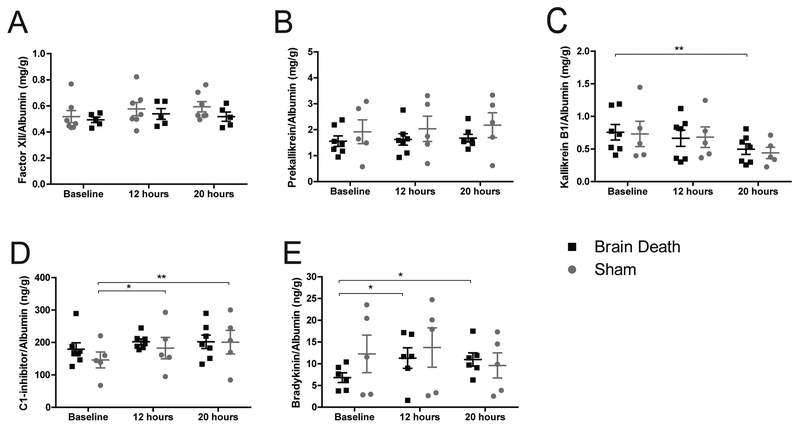
Both BD and sham manifested similar circulating Factor XII and prekallikrein levels over the course of the experiment. Plasma Kallikrein (KLKB1) decreased comparably between groups but was only significant in BD at 20-hours compared to baseline (p<0.01)(Fig.8a–c). Sham animals showed a significant rise in C1-inhibitor (C1INH) (p<0.01), however the average values at 20-hours were nearly identical for BD and sham (Fig.8d). BD showed a significant rise in bradykinin (p<0.05), but those values remained on par with sham at the same time-points (Fig.8e). High molecular weight kininogen (HMWK) was not measured due to a lack of cross-reactive antibodies.
Figure 8. Activation of the contact pathway.
(A) Factor XII and (B) Prekallikrein remained near baseline and were not statistically different between groups. (C) Kallikrein B1 significantly decreased at 20 hours compared to baseline in BD but the trend is similar for both groups and the values are not statistically different between BD and sham. (D) C1INH significantly increased from baseline at 12 and 20 hours respectively, however the trends were similar for both groups and the values are not statistically different between BD and sham. (E) Bradykinin formation in BD was significantly elevated at 12 and 20 hours compared to baseline, however values were not significantly different from sham. A-D: BD (n=7), sham (n=5), data presented is average value normalized to albumin, +SEM. E: BD (n=6), sham (n=5), data presented is average value normalized to albumin, +SEM. Time-point values within each group were compared by 1-way repeated measures ANOVA with Bonferonni correction. Differences between groups at each time-point were compared by unpaired T-test. *p<0.05, **p<0.01.
Examination of BD, sham, and naïve renal biopsies
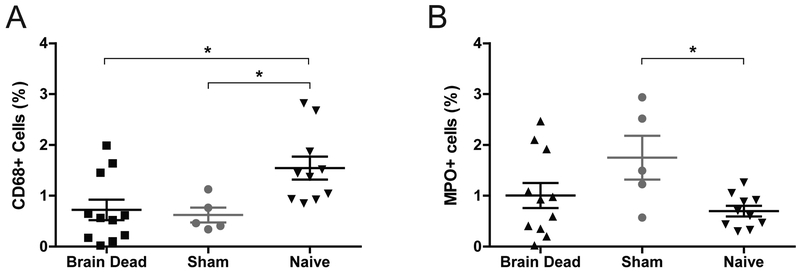
Renal biopsies collected after 20-hours from sham and BD animals were compared to biopsies from naïve animals. Both BD and sham presented a significant decrease in CD68+ macrophages and sham alone had an increased percentage of MPO+ neutrophils compared to naïve (p<0.05 for all)(Fig.9). Transcription analysis suggested increased inflammation with genes including CXCL8, CCL2, and CASP1 significantly upregulated in BD and sham compared to naïve, with intensified expression in BD conditions. Macrophage and neutrophil gene markers presented only minimal evidence of condition-related changes (Table S1). There was minimal evidence of expression differences in complement, coagulation, fibrinolysis, and contact pathways (Table S2). Genes related to acute kidney injury (AKI) and tubular reconstruction (mitogenesis) were significantly upregulated in both BD and sham compared to naïve (Table S3).
Figure 9. Immunohistochemistry CD68 and MPO.
(A) CD68 and (B) MPO in renal biopsies collected after 20-hours from sham and BD animals compared to biopsies from naïve animals. Both BD and sham presented signficantly fewer CD68+ macrophages and sham alone presented more MPO+ neutrophils compared to naïve, BD (n=11), sham (n=5), Naïve (n=10). Data presented as average values, +SEM. Differences between groups tested by 1-way ANOVA with Bonferonni correction. *p<0.05
Gene ontology analysis of biological processes was also performed. 251 genes were significantly up-regulated in BD compared to naïve, enriching for responses related to stress and immune activation; sham demonstrated a similar pattern of up-regulation (255 known genes) with similar enrichment patterns with the addition of enrichment for neutrophil chemotaxis (Tables 2,3). BD also presented down-regulation of 143 genes, enriching for processes related to lipid and reactive oxygen species metabolism, while the 130 genes down-regulated in sham enriched for lipid/protein transport and homeostasis. Compared directly to sham, only 56 known genes were upregulated in BD with minimal ontology results, while 130 down-regulated genes enriched for pathways related to metabolism and cellular respiration (Table 4).
Table 2:
Gene ontology analysis of genes with significantly altered expression in brain death kidneys compared to naïve
| Term | # Genes Represented | Fold Enrichment | FDR |
|---|---|---|---|
| Biological Processes up-regulated in BD vs naïve: 251 known genes | |||
| positive regulation of cell communication (GO:0010647) | 38 | 4.1 | 1.86E-09 |
| positive regulation of signaling (GO:0023056) | 38 | 4.08 | 2.12E-09 |
| response to external stimulus (GO:0009605) | 39 | 3.82 | 7.19E-09 |
| response to cytokine (GO:0034097) | 26 | 5.4 | 5.16E-08 |
| regulation of cell migration (GO:0030334) | 25 | 5.43 | 1.19E-07 |
| defense response (GO:0006952) | 29 | 4.54 | 1.65E-07 |
| regulation of cell population proliferation (GO:0042127) | 34 | 3.83 | 2.35E-07 |
| regulation of cell motility (GO:2000145) | 25 | 5.11 | 4.02E-07 |
| positive regulation of cell migration (GO:0030335) | 18 | 7.16 | 1.46E-06 |
| regulation of cellular component movement (GO:0051270) | 25 | 4.72 | 2.02E-06 |
| regulation of locomotion (GO:0040012) | 25 | 4.63 | 2.87E-06 |
| positive regulation of cell motility (GO:2000147) | 18 | 6.85 | 2.89E-06 |
| cellular response to cytokine stimulus (GO:0071345) | 22 | 5.09 | 6.43E-06 |
| positive regulation of locomotion (GO:0040017) | 18 | 6.43 | 7.35E-06 |
| epithelium development (GO:0060429) | 24 | 4.18 | 4.53E-05 |
| inflammatory response (GO:0006954) | 16 | 6.59 | 4.61E-05 |
| response to oxygen-containing compound (GO:1901700) | 25 | 3.95 | 6.43E-05 |
| cell migration (GO:0016477) | 22 | 4.43 | 7.25E-05 |
| tube development (GO:0035295) | 21 | 4.65 | 0.000073 |
| localization of cell (GO:0051674) | 23 | 4.22 | 7.92E-05 |
| cell motility (GO:0048870) | 23 | 4.22 | 7.92E-05 |
| cell chemotaxis (GO:0060326) | 12 | 8.74 | 0.000207 |
| Biological Processes down-regulated in BD vs naïve: 143 known genes | |||
| organic acid metabolic process (GO:0006082) | 28 | 7.17 | 2.85E-12 |
| carboxylic acid metabolic process (GO:0019752) | 27 | 7.42 | 4.5E-12 |
| oxidation-reduction process (GO:0055114) | 31 | 5.9 | 1.06E-11 |
| oxoacid metabolic process (GO:0043436) | 27 | 7.08 | 1.36E-11 |
| small molecule metabolic process (GO:0044281) | 36 | 4.74 | 2.48E-11 |
| metabolic process (GO:0008152) | 87 | 1.93 | 1.29E-09 |
| lipid metabolic process (GO:0006629) | 24 | 5.65 | 6.15E-08 |
| cellular lipid metabolic process (GO:0044255) | 20 | 6.12 | 1.01E-06 |
| fatty acid metabolic process (GO:0006631) | 10 | 9.91 | 0.000751 |
| organic acid catabolic process (GO:0016054) | 9 | 11.21 | 0.00122 |
| carboxylic acid catabolic process (GO:0046395) | 9 | 11.21 | 0.00122 |
| monocarboxylic acid metabolic process (GO:0032787) | 12 | 7.06 | 0.00134 |
| small molecule catabolic process (GO:0044282) | 10 | 8.53 | 0.0028 |
| alpha-amino acid metabolic process (GO:1901605) | 9 | 9.51 | 0.00456 |
| blood coagulation (GO:0007596) | 7 | 15.09 | 0.00458 |
Gene ontology analysis (Panther over-representation, Fisher’s Exact Test with FDR correction) of kidney gene expression showed that BD kidneys (n=16) significantly upregulated genes in pathways associated with immune response and down-regulated genes in metabolic pathways when compared to naïve (n=12). 251 known genes showed >2-fold increase in expression in BD vs naïve, FDR<0.05. 143 known genes showed >2-fold decrease in expression in BD compared naïve, FDR<0.05.
Table 3:
Gene ontology analysis of genes with significantly altered expression in brain death kidneys compared to sham
| Term | # Genes Represented | Fold Enrichment | FDR |
|---|---|---|---|
| Biological Processes up-regulated in BD vs Sham: 56 known genes | |||
| negative regulation of non-canonical Wnt signaling pathway (GO:2000051) | 6 | 3 | 0.01 |
| Biological Processes down-regulated in BD vs Sham: 130 known genes | |||
| small molecule metabolic process (GO:0044281) | 32 | 4.96 | 1.94E-10 |
| organic acid metabolic process (GO:0006082) | 21 | 6.33 | 1.41E-07 |
| carboxylic acid metabolic process (GO:0019752) | 20 | 6.47 | 3.04E-07 |
| oxoacid metabolic process (GO:0043436) | 20 | 6.17 | 6.82E-07 |
| oxidation-reduction process (GO:0055114) | 21 | 4.7 | 2.62E-05 |
| organic acid catabolic process (GO:0016054) | 8 | 11.73 | 4.03E-03 |
| carboxylic acid catabolic process (GO:0046395) | 8 | 11.73 | 4.03E-03 |
| cofactor metabolic process (GO:0051186) | 11 | 6.79 | 5.82E-03 |
| alpha-amino acid metabolic process (GO:1901605) | 8 | 9.94 | 1.31E-02 |
| metabolic process (GO:0008152) | 63 | 1.65 | 1.31E-02 |
| monocarboxylic acid metabolic process (GO:0032787) | 10 | 6.93 | 1.57E-02 |
| cellular lipid metabolic process (GO:0044255) | 13 | 4.68 | 3.20E-02 |
| ion transport (GO:0006811) | 18 | 3.44 | 3.20E-02 |
| transmembrane transport (GO:0055085) | 18 | 3.36 | 4.37E-02 |
| small molecule metabolic process (GO:0044281) | 32 | 4.96 | 1.94E-10 |
Gene ontology analysis (Panther over-representation, Fisher’s Exact Test with FDR correction) of kidney gene expression showed that 56 known genes showed >2-fold increase in expression in BD (n=16) vs sham (n=6), FDR<0.05: analysis demonstrated significant enrichment in only one process. 130 known genes showed >2-fold decrease in expression in BD compared to sham, FDR<0.05: analysis demonstrated significant enrichment in processes related to metabolism.
Table 4:
Gene ontology analysis of genes with significantly altered expression in sham kidneys compared to naïve
| Term | # Genes Represented | Fold Enrichment | FDR |
|---|---|---|---|
| Biological Processes up-regulated in Sham vs naïve: 255 known genes | |||
| cellular response to chemical stimulus (GO:0070887) | 41 | 2.82 | 1.57E-05 |
| response to chemical (GO:0042221) | 51 | 2.28 | 0.000218 |
| transmembrane transport (GO:0055085) | 32 | 3.03 | 0.000224 |
| inflammatory response (GO:0006954) | 15 | 6.2 | 0.000289 |
| response to stimulus (GO:0050896) | 88 | 1.71 | 0.000365 |
| anion transport (GO:0006820) | 18 | 4.63 | 0.000893 |
| ion transport (GO:0006811) | 30 | 2.91 | 0.00149 |
| cell chemotaxis (GO:0060326) | 11 | 8.05 | 0.00169 |
| organic acid metabolic process (GO:0006082) | 23 | 3.51 | 0.00191 |
| response to external stimulus (GO:0009605) | 29 | 2.86 | 0.00342 |
| response to wounding (GO:0009611) | 12 | 6.41 | 0.00474 |
| neutrophil chemotaxis (GO:0030593) | 7 | 15.13 | 0.00586 |
| anion transmembrane transport (GO:0098656) | 12 | 6.24 | 0.00625 |
| response to organic substance (GO:0010033) | 35 | 2.5 | 0.00682 |
| carboxylic acid metabolic process (GO:0019752) | 21 | 3.44 | 0.00867 |
| localization (GO:0051179) | 63 | 1.83 | 0.00937 |
| neutrophil migration (GO:1990266) | 7 | 13.87 | 0.00991 |
| granulocyte chemotaxis (GO:0071621) | 7 | 13.59 | 0.0112 |
| monocarboxylic acid metabolic process (GO:0032787) | 14 | 4.91 | 0.0116 |
| leukocyte chemotaxis (GO:0030595) | 8 | 10.15 | 0.0152 |
| defense response (GO:0006952) | 21 | 3.3 | 0.0165 |
| Biological Processes down-regulated in Sham vs naïve: 130 known genes | |||
| lipid transport (GO:0006869) | 9 | 14.98 | 7.89E-05 |
| lipid localization (GO:0010876) | 9 | 13.7 | 1.65E-04 |
| cholesterol homeostasis (GO:0042632) | 5 | 40.95 | 1.60E-03 |
| cholesterol transport (GO:0030301) | 5 | 38.85 | 2.03E-03 |
| sterol transport (GO:0015918) | 5 | 37.88 | 2.28E-03 |
| sterol homeostasis (GO:0055092) | 5 | 36.07 | 2.85E-03 |
| cholesterol efflux (GO:0033344) | 4 | 67.34 | 4.67E-03 |
| regulation of cholesterol transport (GO:0032374) | 4 | 55.09 | 9.44E-03 |
| regulation of sterol transport (GO:0032371) | 4 | 55.09 | 9.44E-03 |
| very-low-density lipoprotein particle remodeling (GO:0034372) | 3 | > 100 | 1.17E-02 |
| lipid homeostasis (GO:0055088) | 5 | 24.44 | 1.71E-02 |
| organic substance transport (GO:0071702) | 15 | 4.04 | 2.18E-02 |
| triglyceride-rich lipoprotein particle remodeling (GO:0034370) | 3 | > 100 | 2.50E-02 |
| reverse cholesterol transport (GO:0043691) | 3 | > 100 | 4.56E-02 |
| organic hydroxy compound transport (GO:0015850) | 5 | 19.42 | 4.92E-02 |
Gene ontology analysis (Panther over-representation, Fisher’s Exact Test with FDR correction) of kidney gene expression showed that sham kidneys (n=6) significantly upregulated genes involved in an inflammatory response when compared to naïve (n=12). 255 known genes showed >2-fold increase in expression in sham vs naive, FDR<0.05. 130 known genes showed >2-fold decrease in expression in sham compared to naive, FDR<0.05, with enrichment for chemical transport and homeostasis.
Discussion
As ESRD presents a mounting crisis worldwide, the need to understand and mitigate graft failure rates in organs from deceased donation is of increasing importance. The link between brain death, systemic inflammation, and organ dysfunction has been detailed both in large animal studies and clinical settings,3–8,10,15–22 but comparisons have largely been made to living donors rather than appropriate sham controls. Here we have shown that while BD does correlate to a significant inflammatory response, non-BD sham presents an intermediate phenotype of systemic inflammation which may also lead to organ impairment and requires investigation to determine what interventions may be warranted to benefit patients presented to the ICU.
In our model of a 20-hour BD compared to sham, we documented a rise in circulating leukocytes driven by a significant increase in neutrophils that is more profound in sham than BD. Flow cytometry revealed similar changes in circulating monocyte and neutrophil phenotypes in BD and sham. Neutrophils are highly responsive to a variety of endogenous inflammatory molecules and increase surface expression of CD11b, with a concomitant decrease in CD62L expression during activation for extravasation to sites of injury.23 In both groups, circulating neutrophils retained their inflammatory potency throughout the 20-hour period as demonstrated by their response to exogenous stimulation with relevant agonists PAF, IL-8, and C5a. Monocytes in both groups trended toward a less mature phenotype. The cause of this shift away from strong CD14 staining is unclear, but it is consistent with data collected in a previous publication measuring expression of leukocyte chemokine receptors on neutrophils, monocytes, and myeloid dendritic cells.8 This phenomenon may indicate recruitment of new cells from the bone marrow as more mature cells extravasate to sites of injury.6,24,25 However, our analysis of renal biopsies in this study indicated a reduced presence of CD68+ macrophages in the kidney and a significant increase in the number of neutrophils only in sham animals when compared to naïve. CBC and also transcriptional analysis suggested a role neutrophil infiltration only in sham animals. Complement activation during brain death has been reported in multiple studies with other models and implicated in inflammation-induced depreciation of pre transplant graft quality, but its role in NHP remains elusive.26 Our data show a significant increase in the classical complement activation as well as a rise in plasma-soluble C3d and a significant rise in C5b-9 in BD; however, the activity levels of each pathway and concentrations of C3d and C5b-9 at each time-point were not statistically distinct from those of sham. Moreover, a significant increase in C5b-9 under sham conditions indicates complement activation even in the absence of BD.
While there is a notable decrease in platelets in BD over the course of 20 hours, the difference from sham at the same time points is not declarative. While the data shows elevation of coagulation factors, there is also evidence of compensatory fibrinolysis in both BD and sham. Coagulation times remain within normal ranges for both groups throughout the experimental period. In the contact system, no significant differences in plasma concentrations of Factor XII, prekallikrein, KLKB1, C1INH, or bradykinin were noted between sham and BD. The trend toward decreasing KLKB1 was significant only among the BD group which also presented a significant increase in downstream plasma bradykinin. This difference in bradykinin, a potent endogenous vasodilator, may be an intrinsic response to the vasoactive infusions utilized in the care of BD subjects for maintaining hemodynamic stability during the 20-hour period. It may be noted that the sham group presented a significant increase in C1INH which may have contributed to prevention of bradykinin formation. Further exploration of the kinin-kallikrein cascade in the context of BD and organ donor management is warranted.
Analysis of circulating cytokines revealed no significant difference between sham and BD levels of pro-inflammatory IL-8, MCP-1, and TNFα, and we previously found no difference between BD and non-BD levels of IL-1β, IL-2, IL-4, IL-5, and IFNγ.8 IL-6, however, has been shown at increased levels in BD subjects in multiple models.4,15,27,28 In this study, IL-6 accumulated to 160X over baseline levels (after normalizing to plasma albumin), significantly increased over that experienced in sham during the same period, comparable to previous observations.8 IL-6 is well described as a potent pro-inflammatory cytokine, a thermoregulatory molecule, and even as a neural protectant that improves outcomes after injury.17,28 While IL-6 may be providing a protective effect to the donor following traumatic injury, the presence of residual IL-6 in the renal allograft following procurement may be a key target correlating transplantation from deceased donors with increased graft failure rates as the cytokine takes on a deleterious immunogenic role upon reperfusion in the recipient.27,29,30 The 23-fold rise in circulating IL-6 observed in sham indicates a need to further explore the role of IL-6 in living critical care patients.
In analysis of the renal transcriptome, key genes related to inflammation including IL-6, CCL2, and CASP1 are significantly upregulated in BD compared to naïve, but there are similar patterns in sham conditions. Strong expression of well-known AKI factors, like KIM1 and SPP, was evident in both BD and sham. Genes related to complement, coagulation, and contact pathways showed similar expression levels between groups. These, along with gene ontology data, show that both groups experience an inflammatory response, vascular morphogenesis and extracellular restructuring.
While these transcriptional responses to stress and inflammation were strikingly similar between sham and BD compared to naïve, transcripts from BD samples revealed significant downregulation of metabolic function quite distinct from sham conditions and mapping closely to previously published results obtained in NHP liver.8 This has been characterized in humans and animals though it is not well understood.31,32 In a rodent model of brain death, BD kidneys had lower in situ perfusion and reduced oxygen availability compared to sham, while high-resolution respirometry detailed unimpaired renal mitochondrial function, nearly identical between the groups31. These observations call for continued investigation into effects of brain death on renal perfusion and metabolic competence to determine if perioperative mitochondrial protection may be an effective therapeutic strategy for improving transplant outcomes. Further studies of the direct impacts on transplantable organs will clarify the effects pertaining not to brain death itself but to the critical care environment and open exploration of alternative donor management strategies.
Our data is limited by the small number of observations characteristic of large animal models with high biological variability. While we were able to characterize differences between groups and between time-points within groups, there were many instances where observed trends may have taken on significance if provided with a larger sample size to increase statistical power. We attempted to include a broad spectrum of ages in each groups as advanced age is well-known to contribute to declining mitochondrial integrity in the rhesus macaque.33,34 Additionally, sham animals were maintained under isoflurane anesthesia for the duration of the 20-hour procedure, whereas BD animals were not. BD animals also require a variety of vasoactive infusions in order to maintain hemodynamic stability – isotonic IV fluid boluses as well as titrated infusions of vasopressors may be used to maintain appropriate heart rate and blood pressures to an extent not required for sham subjects.10 Such interventions are intrinsic to clinical management of BD donors; nevertheless, these factors rather than brain death itself may account for some of our observations. We noted a significant hemodilution as detailed in our measurements of serum albumin and used this as a normalizing factor in our measurements of other plasma proteins and enzymatic processes. Finally, naïve and sham kidneys were not transplanted, so we are unable to correlate our observations to transplant outcomes in this study.
While observations of increased inflammation and activation of complement, coagulation, and kinin-kallikrein cascades, as well as changes to the allograft transcriptome, are essential to our understanding of the in vivo conditions experienced by organs procured from deceased donors, the sham model suggests that BD-associated factors deleterious to allograft quality may be limited. These observations provide clear therapeutic targets in donor management to improve critical care and transplant outcomes.
Supplementary Material
Acknowledgments
We gratefully acknowledge the veterinary and SPI staff at the WNPRC. We also thank Drew Roenneburg, Sierra Raglin, Carissa Boetcher, and Joelle Rose for expert technical assistance.
Funding
The research presented here was funded by NIH under award R01AI110617
The content is solely the responsibility of the authors and does not necessarily represent the official views of the National Institutes of Health
Abbreviations:
- ANOVA
analysis of variance
- aPTT
activated partial thromboplastin time
- BD
brain death; also refers to Becton, Dickinson and Company
- CBC
complete blood count
- ELISA
enzyme-linked immunosorbent assay
- ESRD
end-stage renal disease
- FDR
false discovery rate
- ICU
intensive care unit
- MCP
monocyte chemoattractant protein
- MFI
mean fluorescent intensity
- MPO
myeloperoxidase
- NHP
non human primate
- PT
prothrombin time
- RNA
ribonucleic acid
- TNF
tumor necrosis factor
- tPA
tissue-type plasminogen activator
- vWF
von Willebrand Factor
Footnotes
Disclosures:
The authors declare no conflicts of interest
References
- 1.United States Renal Data System. 2017 USRDS annual data report: Epidemiology of kidney disease in the United States. Bethesda, MD: National Institutes of Health, National Institute of Diabetes and Digestive and Kidney Diseases; 2017. [Google Scholar]
- 2.Hart A, Smith JM, Skeans MA, et al. OPTN/SRTR 2016 Annual Data Report: Kidney. Am J Transplant. 2018;18 Suppl 1: 18–113. [DOI] [PMC free article] [PubMed] [Google Scholar]
- 3.Jassem W, Koo DD, Cerundolo L, et al. Cadaveric versus living-donor livers: differences in inflammatory markers after transplantation. Transplantation. 2003;76(11):1599–1603. [DOI] [PubMed] [Google Scholar]
- 4.Pratschke J, Wilhelm MJ, Kusaka M, et al. Brain death and its influence on donor organ quality and outcome after transplantation. Transplantation. 1999;67(3):343–348. [DOI] [PubMed] [Google Scholar]
- 5.Pratschke J, Wilhelm MJ, Kusaka M, et al. Accelerated rejection of renal allografts from brain-dead donors. Ann Surg. 2000;232(2):263–271. [DOI] [PMC free article] [PubMed] [Google Scholar]
- 6.Lisman T, Leuvenink HG, Porte RJ, et al. Activation of hemostasis in brain dead organ donors: an observational study. J Thromb Haemost. 2011;9(10):1959–1965. [DOI] [PubMed] [Google Scholar]
- 7.van Werkhoven MB, Damman J, van Dijk MCRF, et al. Complement mediated renal inflammation induced by donor brain death: role of renal C5a-C5aR interaction. Am J Transplant. 2013;13(4):875–882. [DOI] [PubMed] [Google Scholar]
- 8.Danobeitia JS, Sperger JM, Hanson MS, et al. Early activation of the inflammatory response in the liver of brain-dead non-human primates. J Surg Res. 2012;176(2):639–648. [DOI] [PMC free article] [PubMed] [Google Scholar]
- 9.Long AT, Kenne E, Jung R, et al. Contact system revisited: an interface between inflammation, coagulation, and innate immunity. J Thromb Haemost. 2016;14(3):427–437. [DOI] [PubMed] [Google Scholar]
- 10.Zens TJ, Danobeitia JS, Chlebeck PJ, et al. Guidelines for the management of a brain death donor in the rhesus macaque: A translational transplant model. PLoS One. 2017;12(9):e0182552. [DOI] [PMC free article] [PubMed] [Google Scholar]
- 11.Siezenga MA, Chandie Shaw PK, van der Geest RN, et al. Enhanced complement activation is part of the unfavourable cardiovascular risk profile in South Asians. Clin Exp Immunol. 2009;157(1):98–103. [DOI] [PMC free article] [PubMed] [Google Scholar]
- 12.van der Pol P, de Vries DK, van Gijlswijk DJ, et al. Pitfalls in urinary complement measurements. Transpl Immunol. 2012;27(1):55–58. [DOI] [PubMed] [Google Scholar]
- 13.Mi H, Huang X, Muruganujan A, et al. PANTHER version 11: expanded annotation data from Gene Ontology and Reactome pathways, and data analysis tool enhancements. Nucleic Acids Res. 2017;45(D1):D183–D189. [DOI] [PMC free article] [PubMed] [Google Scholar]
- 14.Italiani P, Boraschi D. From Monocytes to M1/M2 Macrophages: Phenotypical vs. Functional Differentiation. Front Immunol. 2014;5:514. [DOI] [PMC free article] [PubMed] [Google Scholar]
- 15.Pratschke J, Wilhelm MJ, Kusaka M, et al. Activation of proinflammatory genes in somatic organs as a consequence of brain death. Transplant Proc. 1999;31(1–2):1003–1005. [DOI] [PubMed] [Google Scholar]
- 16.Danobeitia JS, Hanson MS, Chlebeck P, et al. Donor Pretreatment With IL-1 Receptor Antagonist Attenuates Inflammation and Improves Functional Potency in Islets From Brain-Dead Nonhuman Primates. Cell Transplant. 2015;24(9):1863–1877. [DOI] [PMC free article] [PubMed] [Google Scholar]
- 17.Damman J, Nijboer WN, Schuurs TA, et al. Local renal complement C3 induction by donor brain death is associated with reduced renal allograft function after transplantation. Nephrol Dial Transplant. 2011;26(7):2345–2354. [DOI] [PubMed] [Google Scholar]
- 18.Damman J, Hoeger S, Boneschansker L, et al. Targeting complement activation in brain-dead donors improves renal function after transplantation. Transpl Immunol. 2011;24(4):233–237. [DOI] [PubMed] [Google Scholar]
- 19.Damman J, Bloks VW, Daha MR, et al. Hypoxia and Complement-and-Coagulation Pathways in the Deceased Organ Donor as the Major Target for Intervention to Improve Renal Allograft Outcome. Transplantation. 2015;99(6):1293–1300. [DOI] [PubMed] [Google Scholar]
- 20.Atkinson C, Varela JC, Tomlinson S. Complement-dependent inflammation and injury in a murine model of brain dead donor hearts. Circ Res. 2009;105(11):1094–1101. [DOI] [PMC free article] [PubMed] [Google Scholar]
- 21.Kamińska D, Kościelska-Kasprzak K, Drulis-Fajdasz D, et al. Kidney ischemic injury genes expressed after donor brain death are predictive for the outcome of kidney transplantation. Transplant Proc. 2011;43(8):2891–2894. [DOI] [PubMed] [Google Scholar]
- 22.Nijboer WN, Schuurs TA, van der Hoeven JA, et al. Effect of brain death on gene expression and tissue activation in human donor kidneys. Transplantation. 2004;78(7):978–986. [DOI] [PubMed] [Google Scholar]
- 23.Wittmann S, Rothe G, Schmitz G, et al. Cytokine upregulation of surface antigens correlates to the priming of the neutrophil oxidative burst response. Cytometry A. 2004;57(1):53–62. [DOI] [PubMed] [Google Scholar]
- 24.Shi C, Pamer EG. Monocyte recruitment during infection and inflammation. Nat Rev Immunol. 2011;11(11):762–774. [DOI] [PMC free article] [PubMed] [Google Scholar]
- 25.Sugimoto C, Hasegawa A, Saito Y, et al. Differentiation Kinetics of Blood Monocytes and Dendritic Cells in Macaques: Insights to Understanding Human Myeloid Cell Development. J Immunol. 2015;195(4):1774–1781. [DOI] [PMC free article] [PubMed] [Google Scholar]
- 26.Poppelaars F, Seelen MA. Complement-mediated inflammation and injury in brain dead organ donors. Mol Immunol. 2017;84:77–83. [DOI] [PubMed] [Google Scholar]
- 27.Stangl M, Zerkaulen T, Theodorakis J, et al. Influence of brain death on cytokine release in organ donors and renal transplants. Transplant Proc. 2001;33(1–2):1284–1285. [DOI] [PubMed] [Google Scholar]
- 28.Winter CD, Pringle AK, Clough GF, et al. Raised parenchymal interleukin-6 levels correlate with improved outcome after traumatic brain injury. Brain. 2004;127(Pt 2):315–320. [DOI] [PubMed] [Google Scholar]
- 29.Kielar ML, John R, Bennett M, et al. Maladaptive role of IL-6 in ischemic acute renal failure. J Am Soc Nephrol. 2005;16(11):3315–3325. [DOI] [PubMed] [Google Scholar]
- 30.Patel NS, Chatterjee PK, Di Paola R, et al. Endogenous interleukin-6 enhances the renal injury, dysfunction, and inflammation caused by ischemia/reperfusion. J Pharmacol Exp Ther. 2005;312(3):1170–1178. [DOI] [PubMed] [Google Scholar]
- 31.Van Erp AC, Rebolledo RA, Hoeksma D, et al. Organ-specific responses during brain death: increased aerobic metabolism in the liver and anaerobic metabolism with decreased perfusion in the kidneys. Sci Rep. 2018;8(1):4405. [DOI] [PMC free article] [PubMed] [Google Scholar]
- 32.Wijermars LG, Schaapherder AF, de Vries DK, et al. Defective postreperfusion metabolic recovery directly associates with incident delayed graft function. Kidney Int. 2016;90(1):181–191. [DOI] [PubMed] [Google Scholar]
- 33.Castro Mdel R, Suarez E, Kraiselburd E, et al. Aging increases mitochondrial DNA damage and oxidative stress in liver of rhesus monkeys. Exp Gerontol. 2012;47(1):29–37. [DOI] [PMC free article] [PubMed] [Google Scholar]
- 34.Mao P, Gallagher P, Nedungadi S, et al. Mitochondrial DNA deletions and differential mitochondrial DNA content in Rhesus monkeys: implications for aging. Biochim Biophys Acta. 2012;1822(2):111–119. [DOI] [PMC free article] [PubMed] [Google Scholar]
Associated Data
This section collects any data citations, data availability statements, or supplementary materials included in this article.


