Abstract
Objective
Despite recent advancements in targeted therapy and immunotherapies, prognosis for metastatic melanoma patients remains extremely poor. Development of resistance to previously effective treatments presents a serious challenge and new approaches for melanoma treatment are urgently needed. The objective of this study was to examine the effects of telmisartan, an AGTR1 inhibitor and a partial agonist of PPARγ, on melanoma cells as a potential agent for repurposing in melanoma treatment.
Methods
Expression of AGTR1 and PPARγ mRNA in melanoma patient tumor samples was examined in publicly available datasets and confirmed in melanoma cell lines by qRT-PCR. A panel of melanoma cell lines was tested in viability, apoptosis and metabolic assays in presence of telmisartan by flow cytometry and immunocytochemistry. A cytotoxic effect of combinations of telmisartan and targeted therapy vemurafenib was examined using the Chou-Talalay combination index method.
Results
Both AGTR1 and PPARγ mRNA were expressed in melanoma patient tumor samples and decreased compared to the expression in the healthy skin. In vitro, we found that telmisartan decreased melanoma cell viability by inducing cell apoptosis. Increased glucose uptake, but not utilization, in the presence of telmisartan caused the fission of mitochondria and release of reactive oxygen species. Telmisartan altered the cell bioenergetics, thereby synergizing with vemurafenib in vitro, and even sensitized vemurafenib-resistant cells to the treatment.
Conclusions
Given that the effective doses of telmisartan examined in our study can be administered to patients and that telmisartan is a widely used and safe antihypertensive drug, our findings provide the scientific rationale for testing its efficacy in treatment of melanoma progression.
Keywords: Melanoma, telmisartan, apoptosis, mitochondria, reactive oxygen species, targeted therapy
Introduction
Melanoma is one of the most aggressive malignancies. If left untreated, patients with distant metastasis have a median survival of 6–9 months. In the last decade, a dramatic improvement in the survival of melanoma patients has been achieved with neutralizing antibodies targeting immune checkpoints (anti-PD-1 and anti-CTLA-4 immunotherapy) and via targeted BRAF and MEK inhibition1. However, mortality rates remain high in advanced-stage patients2. Fifty percent of melanoma tumors carry the BRAF V600E mutation, but despite the dramatic initial effects of BRAF inhibitors in clinical settings, patients eventually experience relapse, suggesting that combination therapies may be needed to overcome resistance. In most developed countries, patients with BRAF-mutated melanoma receive a combination of BRAF and MEK inhibitor therapies, which has high response rates; nevertheless, the median time to relapse is less than 10 months3. Both genetic and epigenetic changes contribute to the resistance to targeted therapy. Better understanding of the mechanisms of resistance is needed as well as strategies to overcome them. BRAF inhibitors suppress glycolysis4, yet the subsequent increase in oxidative metabolism limits their efficacy5. Many melanoma driver genes control cellular metabolism. Heterogeneity in genetic driver profiles and mitochondrial capacity can influence the effectiveness of the treatment6. Therefore, agents that target different aspects of cell metabolism could improve the effects of melanoma chemotherapy and BRAF inhibitor efficacy.
Development of new drugs is costly, and the approval for their use and translation into clinics often takes between 10 and 15 years. In contrast, repurposing of drugs already approved for other uses (drugs that have been tested in humans, and for which information regarding pharmacology, formulation, and potential toxicity is available) enables their quick translation into clinical trials and integration into healthcare7. Recently, it has been recognized that therapy for chronic diseases can have an impact on the progression and outcome in cancer patients. In this study, we examined the effects of telmisartan on melanoma cells. Telmisartan is an angiotensin receptor 1 (AGTR1) inhibitor and a partial agonist of peroxisome proliferator-activated receptor γ (PPARγ). Human melanoma tissues express both angiotensin II and AGTR1, and inhibition of AGTR1 in mouse models of melanoma was shown to inhibit tumor growth by decreasing the tumor vessel density8. PPARγ is a nuclear receptor that is an important regulator of lipid and glucose metabolism9. Activation of PPARγ in melanoma cells has growth-inhibitory effects10,11 via the induction of cell cycle arrest. PPARγ agonists have also been shown to have pro-apoptotic PPARγ-independent effects12. In recent years, telmisartan has been reported to have anticancer effects in in vitro and in vivo models of various solid tumors13-17, but its effects on melanoma have not yet been investigated. Therefore, we hypothesized that telmisartan through its dual activity, as an AGTR1 inhibitor and PPARγ agonist with possible extra-receptor effects, can have an anti-melanoma activity that is superior to that of agents with single activity. In this study, we have found that telmisartan induces apoptosis in both BRAF V600E mutated and wild-type melanoma cells, and that it causes mitochondrial fragmentation and the generation of free radicals. The alteration of cellular energetics by telmisartan enabled it to synergize with the BRAF inhibitor vemurafenib, thereby improving the response in a vemurafenib-resistant melanoma cell line. Collectively, we report that the clinically available antihypertensive agent telmisartan can potentially be repurposed as an anti-cancer therapeutic for melanoma treatment.
Materials and methods
In silico gene expression analysis
For the analysis of PPARγ and AGTR1 expression in melanoma tumors, the datasets GSE7553, GSE19234, GSE3189, GSE46517, and GSE8401 were uploaded to GEO2R (https://www.ncbi.nlm.nih.gov/geo/geo2r/), and the samples were divided into the following groups: normal skin, melanoma in situ, primary melanoma, and metastatic melanoma. Sample values were plotted in Prism 7 (Graphpad) and analyzed using one-way ANOVA and Dunnett's multiple comparisons test. For the survival analysis of data from the GSE19234 dataset, the samples were divided into the PPARγ-high and PPARγ-low expression groups (the 2 × SD value was used for determining the cut-off) and analyzed using the log-rank (Mantel-Cox) test.
Cell culture, drug treatments and viability assays
Human melanoma cell lines with the BRAF V600E mutation A375 and 518a2 and the BRAF wild-type melanoma cell lines HTB140 and FemX-1 were cultured in RPMI 1640 medium with 2 g/L glucose (Sigma-Aldrich, R8755, Taufkirchen, Germany), 10% FBS, and antibiotics. The A375 cell line was procured from ATCC. The FemX-1 cell line18 was a kind gift from Dr Nikola Vujanović. The 518a2 and HTB140 cell lines were kind gifts from Dr Milica Pešić. All the cell lines were tested for the presence of mycoplasma by PCR19, and if required, treated with MycoXpert (Capricorn Scientific, Ebsdorfergrund, Germany). Vemurafenib (Zelboraf), telmisartan, pioglitazone, and losartan-potassium were provided by the Medicines and Medical Devices Agency of Serbia as pure substances. N-acetyl-L-cysteine, L-glutathione, 2-deoxy-D-glucose, and apocynin were obtained from Sigma-Aldrich. The cytotoxicity of the drugs was determined by performing the MTT assay (Sigma-Aldrich) in 96-well plates, at a density of 5,000 cells/well, with at least three biological repeats. After 72 h of incubation with the drugs, the absorbance of the samples was measured at 570 nm on a Multiskan EX reader (Thermo Labsystems, Helsinki, Finland). IC50 values (μM) were determined from the dose-response curves as the concentration of the compound causing a 50% decrease in MTT reduction, compared to the control (DMSO)-treated samples.
Annexin/PI assay
Quantitative analysis of apoptotic and necrotic cell death induced by 50 μM telmisartan or 100 μM pioglitazone was performed using an Annexin V-FITC apoptosis detection kit, according to the manufacturer’s instructions (BD Biosciences, Franklin Lakes, USA). After 24 or 48 h of treatment with the drugs, the A375 cells were trypsinized, washed twice with ice-cold PBS, and resuspended in 200 μL of binding buffer[10 mM HEPES/NaOH (pH 7.4), 140 mM NaCl, 2.5 mM CaCl2]. Next, 2 × 10⁵ cells were stained with Annexin V-FITC and PI. After 15 min of incubation at room temperature in the dark, the cells were analyzed using a FACS Calibur Becton Dickinson (San Jose, USA) flow cytometer and the Cell Quest computer software.
Cell cycle analysis
A375 and A375R cells were treated for 72 h with 0.5 μM vemurafenib, and quantitative analysis of the cell cycle phase distribution was performed by flow cytometry (Calibur Becton Dickinson flow cytometer and BD Cell Quest computer software). The DNA content in fixed, RNaseA (1 mg/mL)-treated cells was stained with 400 mg/mL propidium iodide (PI), and 20,000 events were counted.
Flow cytometric analysis of phospho-p38 and cleaved caspase 3
After 24 h (for phospho-p38) or 48 h of treatment (for cleaved caspase 3) with 50 μM telmisartan, the cells were trypsinized, fixed, permeabilized, and then blocked with 1.5% BSA in PBS. Cells were then incubated with PE mouse anti-p38MAPK pT180/pY182 (612565, BD Biosciences, Franklin Lakes, USA) antibody or FITC rabbit anti-active caspase-3 antibody (51-68654x, BD Biosciences) for 1 h in the dark at room temperature. After washing, the cells were resuspended in PBS and analyzed using a FACS Calibur Becton Dickinson flow cytometer.
Detection of intracellular ROS and mitochondrial potential
For the detection of ROS, 2 × 10⁵ A375 or HTB140 cells were treated with 50 μM telmisartan, 100 μM pioglitazone, 100 μM losartan, or 50 μM telmisartan in the presence of 1 mM L-GSH, 10 mM NAC, or 100 μM apocynin for 24 h. The cells were stained with 50 μM H2DCFDA (D3999, Thermo Fischer Scientific, Schwerte, Germany) for 30 minutes at 37°C. For the measurement of the mitochondrial potential, A375 cells were treated with 50 μM telmisartan or 100 μM pioglitazone for 24 h, and then stained with 2.5 μg/mL of Rhodamine123 (R302, Thermo Fischer Scientific) in PBS for 1 h at 37°C, and analyzed using a FACS Calibur Becton Dickinson flow cytometer.
Glucose uptake and consumption and lactate production
Glucose uptake was measured by flow cytometry as described in a previous report20. A375 cells were pretreated for 1 or 24 h with 50 μM telmisartan or 50 μM pioglitazone and incubated with 20 μM 2-NBDG, a fluorescent glucose analog (N13195, Thermo Fischer Scientific), for 1 h at 37°C.
For measuring the glucose consumption, 10 × 105 A375 or HTB140 cells were seeded into six-well plates in duplicate. After 24 h, the cells were collected (from duplicate wells) for protein extraction at the 0 h time point, and the cells in the test wells were treated with 50 μM telmisartan or pioglitazone in RPMI 1640 medium containing 2 g/L glucose (Sigma, R8755, Taufkirchen, Germany). After 24 h, the medium was collected and glucose concentration was measured using a Cobas bioanalyzer C111 (Roche, USA). The remaining cells were collected for protein extraction at the 24 h time point. The protein content in the cells was extracted using RIPA buffer, and the protein concentration was measured using the Qubit Fluorometer and Qubit Protein assay kit (Q33211, Molecular Probes, Eugene, USA). Glucose consumption was calculated by subtracting the amount of glucose present in the medium after 24 h of incubation from the amount of glucose initially present in the medium (2 g/L), and normalized to the area under the curve for cell growth per hour. The experiment was repeated thrice and statistical analysis was performed using two-way ANOVA and Tukey's multiple comparisons test.
Lactate consumption was measured using an extracellular acidification assay kit (ab197244, Abcam, Cambridge, UK), according to the manufacturer’s instructions. A375 or HTB140 cells were treated with 50 μM telmisartan or pioglitazone for 24 h and then trypsinized; equal numbers of cells were resuspended in 100 μL of resuspension buffer. The cell suspensions were loaded into 96-well black polystyrene plates (237105, Nunc, Schwerte, Germany), and 10 μL of Glycolysis Assay reagent was added to each sample. Respiration buffer plus the reagent served as the blank control. Signals were measured at 2-min intervals for 120 minutes with an Ex/Em of 380/615 using a Tecan Infinite m1000Pro reader (Tecan, Zurich, Switzerland) in Dual TR-F mode with a 30 μs delay and 100 μs gate time. Blank control-corrected intensity values (AU) were plotted against time in minutes. The experiment was repeated twice.
Immunocytochemistry for TOM20 and MitoTracker Red CMXRos staining
Formaldehyde-fixed melanoma cells were stained with mouse anti-Tom20 antibody (F-10, sc-17764, Santa Cruz biotechnology, Heidelberg, Germany) and Alexa Fluor 488 goat anti-mouse antibody (R37120, Thermo Fischer Scientific), counterstained with DAPI (Sigma), and imaged using an epi-fluorescent microscope (Olympus, Japan) with a 60 × lens. For staining of the active mitochondria, the melanoma cells were stained with 100 nM MitoTracker Red CMXRos (#9082, Cell Signaling Technology, Frankfurt, Germany) for 20 minutes at 37°C, fixed with ice-cold methanol, and imaged using an epi-fluorescent microscope.
Analysis of gene expression by real-time PCR
RNA was isolated from melanoma cells using the TRI REAGENT® BD kit (Sigma-Aldrich). cDNA synthesis from total RNA (2 μg) was performed using random primers and MultiScribeTM Reverse Transcriptase from the High-Capacity cDNA Reverse Transcription kit (50 U/μL, Applied Biosystems, Schwerte, Germany). RT-PCR was performed with Maxima SYBR green/ROX qPCR master Mix (K00221, Thermo Scientific). The primers used were as follows: PPARγ forward 5′-GGCTTCATGACAAGGGAGTTTC-3′ and PPARγ reverse 5′-AACTCAAACTTGGGCTCCATAAAG-3′; Agtr1 forward 5′-AACAGCTTGGTGGTGATCGTC-3′ and Agtr1 reverse 5′-CATAGCGGTATAGACAGCCCA-3′. The reactions were performed using the ABI Prism 7,700 Sequence Detection System (Applied Biosystems). The expression level data were normalized to glyceraldehyde-3-phosphate dehydrogenase (GAPDH) expression, analyzed by the delta-delta-Ct method, and represented as the means ± SEMs of three independent experiments.
Drug interaction analysis
To determine the synergistic, additive, or antagonistic effects of the drug combinations, we performed the combination index method described by Chou and Talalay21, using the CalcuSyn software (version 2.0 Biosoft, Cambridge, UK). This method takes into account both the potency of the drug [median dose (Dm) or IC50] and the shape of the dose-effect curve (the m value) to calculate the combination index (CI). A CI equal to 1 indicates an additive effect; a CI less than 1 indicates synergy. With the use of the CalcuSyn software, synergy is further refined as synergism (CI = 0.3–0.7), strong synergism (CI = 0.1–0.3), and very strong synergism (CI < 0.1). Isobolograms and heat maps were plotted using the Prism 7 software.
Results
Expression of PPARγ and AGTR1 receptors in melanoma patient samples and melanoma cell lines
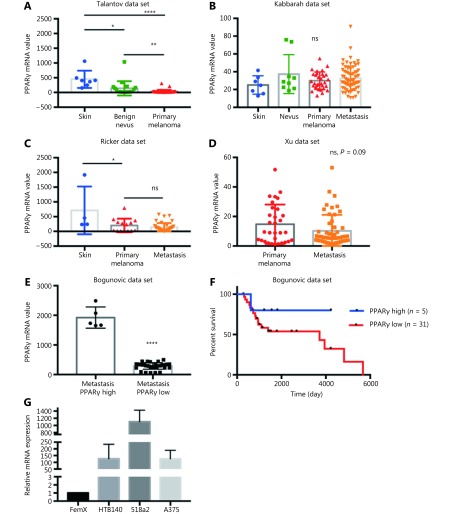
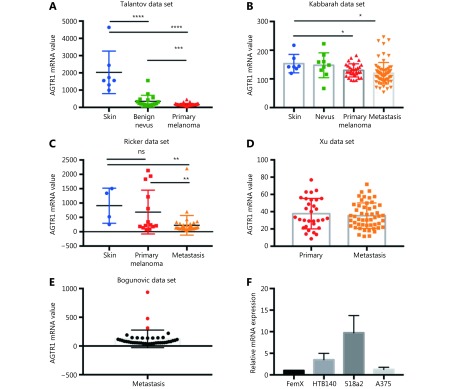
We first performed an in silico analysis of the available gene expression databases of melanoma tumors in the GEO repository for the expression of two telmisartan receptors: PPARγ and AGTR1. We examined the Talantov22, Kabbarah23, Riker24, Xu25, and Bogunovic26 datasets (Figure 1). PPARγ mRNA expression was decreased in primary melanoma, compared to the uninvolved skin (Figure 1A, 1C), while there was no difference between the PPARγ mRNA expression in primary tumors and metastatic lesions (Figure 1B-1D). In the Bogunovic data set26, which includes the clinical outcome data for metastatic patients, we found that there were very few tumors expressing high PPARγ levels, and they were associated with better survival (log-rank value not available due to small sample size in the PPARγ-high expression group, Figure 1E and 1F). AGTR1 mRNA expression also decreased in primary tumors, compared to uninvolved skin (Figure 2A and 2B). Additionally, in some data sets, it further decreased in metastatic lesions (Figure 2C), while in others, there was no difference between the AGTR1 mRNA expression in primary and metastatic tumor samples (Figure 2B and 2D). In the Bogunovic data set26, only 3 AGTR1 mRNA values were outside of the standard deviation range; hence, the survival analysis was not performed (Figure 2E). Therefore, there is a trend of decrease in case of both the PPARγ and AGTR1 mRNA expression with the progression of melanoma. We then screened the mRNA expression of PPARγ and AGTR1 in a panel of four human melanoma cell lines: A375, 518a2, HTB140, and Fem-X. Expression of PPARγ (Figure 1G) and AGTR1 mRNA (Figure 2F) was normalized to GAPDH expression and was detectable in both the BRAF WT cell lines (FemX-1 and HTB140) and BRAF V600E mutant cell lines (A375 and 518a2). The FemX-1 cell line showed the lowest expression of both genes, while 518a2 showed the highest expression.
1.
Expression of PPARγ receptor in melanoma. Relative expression levels of PPARγ in melanoma tumors included in (A) GSE318922, (B) GSE4651723, (C) GSE755324 and (D) GSE840125 datasets. Values represent mean ± SD, * P < 0.05, ** P < 0.01, *** P < 0.001, **** P < 0.0001, One-way ANOVA with Dunett’s multiple comparisons test. (E) High and low PPARγ expression in metastatic melanoma from dataset GSE19234 26, ****P < 0.0001, unpaired t test. (F) Survival curves for 36 metastatic melanoma patients with tumors expressing highest (n = 5) and lowest (n = 31) PPARγ levels calculated using Kaplan-Meier analysis. (G) Relative mRNA levels of PPARγ in melanoma cell lines measured by qRT-PCR. Values represent mean ± SEM of three independent experiments.
2.
Expression of AGTR1 receptor in melanoma. Relative expression levels of AGTR1 in melanoma tumors included in (A) GSE318922, (B) GSE4651723, (C) GSE755324 and (D) GSE840125 datasets. Values represent mean ± SD, * P < 0.05, ** P < 0.01, *** P < 0.001, **** P < 0.0001, One-way ANOVA with Dunett’s multiple comparisons test. (E) Expression of AGTR1 in metastatic melanoma from dataset GSE19234 26, red marks for values above standard deviation range. (F) Relative mRNA levels of AGTR1 in melanoma cell lines measured by qRT-PCR. Values represent mean ± SEM of three independent experiments.
Telmisartan reduces melanoma cell viability through the induction of apoptosis
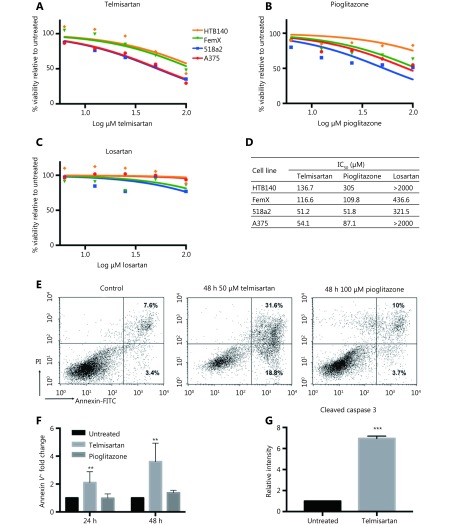
Next, we examined the melanoma cell viability in vitro in the presence of telmisartan and compared it with that observed after treatment with the PPARγ agonist pioglitazone and AGTR1 inhibitor losartan. Melanoma cells were treated with increasing concentrations of the drugs for 72 h, and their viability was measured by the MTT assay (Figure 3A-3C). Telmisartan dose-dependently reduced melanoma cell viability; its performance was comparable to and better than that of pioglitazone at the same concentration in all the tested cell lines. On the contrary, the direct AGTR1 antagonist losartan did not show significant effects (best-fit IC50 values; Figure 3D). Interestingly, cells with the BRAF V600E mutation (A375 and 518a2 cells) had lower IC50 values for telmisartan than BRAF WT cells (FemX-1 and HTB140) (Figure 3A, P < 0.0001 by two-way ANOVA). We next examined the apoptosis in A375 cells treated with 50 μM (IC 50) telmisartan and compared these results with those obtained after treatment with 100 μM (> IC50) pioglitazone using the Annexin V/PI assay. Telmisartan increased both the early-apoptotic and late-apoptotic/necrotic fraction of the cells in a time-dependent manner, while pioglitazone showed no significant effects (representative graphs after 48 h of treatment; Figure 3E and quantification after 24 and 48 h Figure 3F). Apoptosis was further confirmed by the measurement of a significantly increased percentage of cleaved caspase 3-positive cells by flow cytometry after 48 h of treatment with 50 μM telmisartan (Figure 3G).
3.
Telmisartan reduces melanoma cell viability. Percent viability of melanoma cell lines after 72 h treatment with (A) telmisartan, (B) pioglitazone and (C) losartan determined by the MTT assay presented as log (inhibitor) vs. no. rmalized response and (D) best-fit IC50 values for each line, n = 4. (E) Representative graphs and (F) quantification of Annexin/PI assay for apoptosis in A375 cells after 24 h and 48 h of treatment with 50 μM telmisartan or 100 μM pioglitazone, values represent mean ± SD, ** P < 0.01, Two-way ANOVA, n = 3. (G) Flow cytometric analysis of cleaved caspase 3 in A375 cells after 48 h treatment with 50 μM telmisartan. Values represent mean ± SD, ***P < 0.001, unpaired t-test, n = 3.
Telmisartan induces generation of the reactive oxygen species (ROS) in melanoma cells
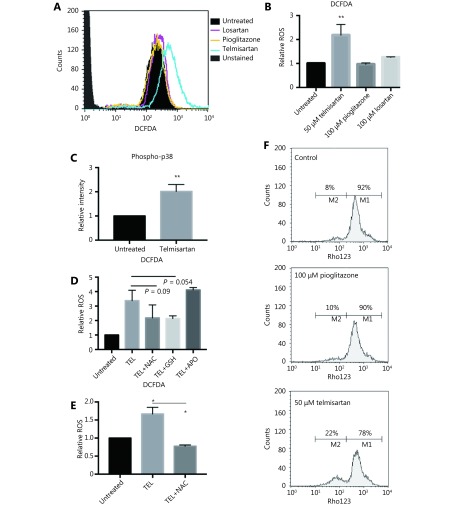
To examine the mode of apoptotic cell death, we first measured ROS generation after 24 h of telmisartan treatment in A375 cells using dichlorofluorescein diacetate (DCFDA), a fluorogenic dye that measures hydroxyl radicals, peroxyl radicals, and other ROS. Unlike pioglitazone or losartan, which at the concentration of 100 μM did not increase the oxidation of DCFDA to fluorescent DCF, 50 μM telmisartan increased the relative ROS levels in A375 cells, as measured by flow cytometry (representative graph Figure 4A and quantification Figure 4B). Consistent with this finding, telmisartan also increased the levels of phosphorylated p38, a free radical sensor27, 28 (Figure 4C). NADPH oxidase (NOX) and oxidative reactions on the mitochondrial membrane are the main sources of ROS. To examine the potential sources of ROS in telmisartan-treated cells, we measured the telmisartan-induced DCFDA fluorescence in the presence of reduced glutathione (L-GSH), N-actetyl-L-cysteine (synthetic precursor of GSH and cysteine, free radical scavenger), or apocynin (NADPH oxidase inhibitor). While 1 mM L-GSH or 10 mM NAC decreased the relative ROS levels in the telmisartan-treated cells, 100 μM apocynin did not prevent ROS generation (Figure 4D). These results imply that NADPH-dependent oxidases are not involved in telmisartan-induced ROS generation, and that the ROS generation is of mitochondrial origin. We confirmed the induction of ROS generation by telmisartan and its prevention by NAC in the BRAF WT melanoma cell line HTB140 (Figure 4E). A strong positive correlation exists between mitochondrial ROS release and mitochondrial membrane potential (ΔΨ)29; therefore, we measured the ΔΨ by the flow cytometry analysis of Rhodamine123-stained cells. In telmisartan-treated A375 cells, the mitochondria were hyperpolarized, as seen by the loss of fluorescence, unlike the cells treated with pioglitazone, where pioglitazone had a limited effect on membrane potential even at a higher dose (Figure 4F).
4.
Telmisartan induces generation of reactive oxygen species in melanoma cells. Representative graph (A) and quantification (B) of DCFDA fluorescence as a measure of ROS generation in A375 cells after 24 h treatment with 50 μM telmisartan, 100 μm pioglitazone or 100 μm losartan. Values represent mean ± SD, **P < 0.01, One way ANOVA, n = 3. (C) Flow cytometric analysis of phospho-p38 in A375 cells after 24 h treatment with 50 μM telmisartan. Values represent mean ± SD, **P < 0.01, unpaired t-test, n = 3. (D) Telmisartan-induced ROS generation in A375 cells in the presence of reduced 1 mM glutathione (GSH), 10 mM N-acetyl cysteine (NAC) or 100 μM apocynin (APO). Values represent mean ± SD, individual comparisons by unpaired t-test, n = 3. (E) Telmisartan-induced ROS generation in HTB140 cells in presence of 10 mM NAC. Values represent mean ± SD, individual comparisons by unpaired t-test, *P < 0.05, n = 3. (F) Representative graphs of measurement of mitochondrial potential of A375 cells by flow cytometry of Rhodamine123 in cells treated with 50 μM telmisartan or 100 μM pioglitazone, n = 2.
Telmisartan alters melanoma cell bioenergetics
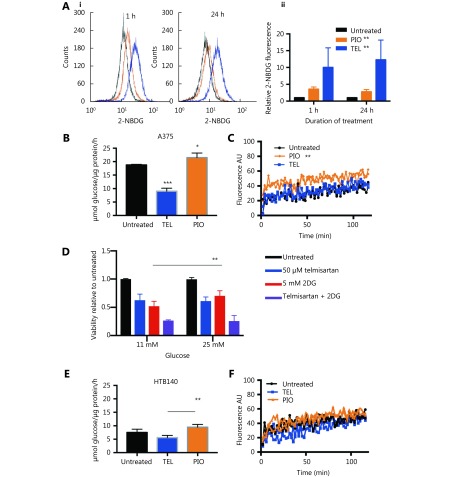
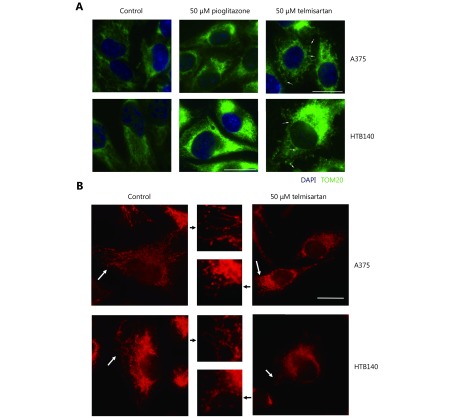
High glycolytic activity or impaired oxidative phosphorylation (OXPHOS) are possible sources of increased cellular ROS levels30. PPARγ is involved in glucose sensing31, and the PPARγ agonist pioglitazone exerts its antidiabetic activity by increasing the cellular glucose uptake32. We measured whether telmisartan too can affect glucose uptake in A375 cells, by measuring the uptake of the fluorescent glucose analogue 2-NBDG using flow cytometry. We observed that 50 μM telmisartan significantly increased the 2-NBDG uptake to a greater extent than pioglitazone at the same concentration, both shortly after its addition (measured at the 1 h time point) and after 24 h of treatment (Figure 5Ai representative graphs and 5Aii quantification). Next, we measured the glycolytic rate by examining the glucose consumption and lactate production in A375 and HTB140 cells. As expected, treatment with 50 μM pioglitazone increased the glycolysis in A375 cells33. We observed an increase in glucose consumption per μg of cell protein (Figure 5B) and increased lactate production, measured by the decreased pH of the culture medium (Figure 5C). On the contrary, 50 μM telmisartan decreased the glucose consumption and did not change the extracellular acidification in A375 cells (Figure 5B and 5C). This implies that in A375 cells, in the presence of telmisartan, glucose is taken up at a higher rate, but is not utilized at a higher rate. To determine whether the decreased consumption of glucose was the cause for the decreased cell viability, we tested the effects of telmisartan in A375 cells in the presence of excess glucose (25 mM, compared to 11 mM in standard RPMI) or in the presence of 2-deoxy-D-glucose (2DG), a glycolysis inhibitor. Increased glucose concentration did not ameliorate the effects of telmisartan (Figure 5D), but as expected, it ameliorated the effects of 2DG on cell viability. Furthermore, telmisartan had additive effects with 2DG, as observed in the MTT assay (Figure 5D). In HTB140 cells, at a telmisartan concentration of 50 μM, a similar trend was observed in the glucose consumption and lactate excretion assays (Figure 5E and 5F), but statistical significance was not observed. This is consistent with the observation of cytotoxic effects in HTB140 cells, which required higher doses of telmisartan (Figure 3A and 3D). Moreover, the basal level of glucose consumption was also lower in HTB140 cells than in A375 cells (Figure 5B and E). Given that increased intracellular glucose uptake can induce mitochondrial fragmentation34 that is causal for ROS production35, we examined the mitochondrial morphology in A375 and HTB140 cells after telmisartan treatment by the immunocytochemical analysis of the mitochondrial import receptor subunit TOM20. Treatment with 50 μM telmisartan, but not pioglitazone, for 24 h induced the fragmentation of mitochondria, as seen by the generation of mitospheres (Figure 6A). We confirmed mitochondrial fragmentation in telmisartan-treated cells by staining the cells with MitoTracker Red CMXRos, which accumulates in active mitochondria (Figure 6B). These results imply that in the presence of telmisartan, glucose is imported into cells, but not used for glycolysis and this could cause mitochondrial fragmentation and ROS release.
5.
Telmisartan alters melanoma cell bioenergetics. (A) Representative graphs (i) and quantification (ii) of 2-NBDG uptake in A375 cells after 1 h or 24 h treatment with 50 μM telmisartan or pioglitazone, measured by flow cytometry. Values represent mean ± SD, One-way ANOVA, **P < 0.01, n = 3. Glucose consumption in (B) A375 cells and (E) HTB140 cells after 24 h treatment with 50 μM telmisartan or pioglitazone. Values represent mean ± SD, * P < 0.05, ** P < 0.01, *** P < 0.001, individual comparisons by unpaired t-test, n = 3. Lactate excretion in (C) A375 cells and (F) HTB140 cells after treatment with 50 μM telmisartan or pioglitazone, measured in extracellular acidification assay, where fluorescence signal correlates with lactate production, n = 2, linear regression analysis. (D) MTT viability assay of A375 cells cultured in regular RPMI (11 mM glucose) or glucose enriched (25 mM) RPMI in the presence of 50 μM telmisartan, 5 mM 2DG or the combination. ** P < 0.0049, n = 3 in unpaired t-test.
6.
Telmisartan induces mitochondrial fragmentation. (A) Immunocytochemistry of TOM20 (green) marker for mitochondria in telmisartan- or pioglitazone-treated A375 and HTB140 cells. Nuclei-DAPI-blue, scale bar 20 μm. Arrowheads point to the fragmented mitochondria. (B) MitoTracker Red CMXRos staining of the untreated and telmisartan treated A375 and HTB140 cells. White arrowheads point to the mitochondria that are presented in the zoomed-in inset (middle panel). Scale bar 20 μm.
Telmisartan has synergistic effects with vemurafenib in vitro
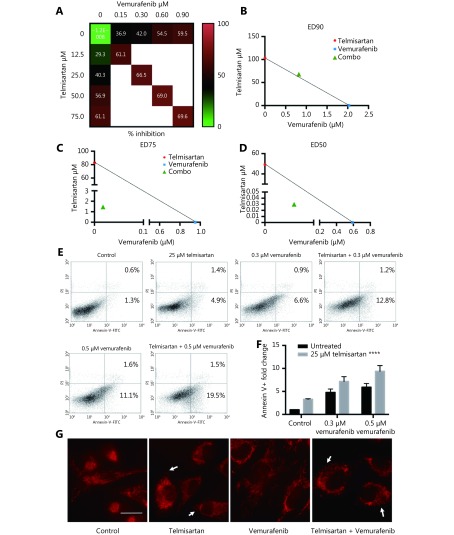
In melanoma patients treated with the BRAF inhibitor vemurafenib, there is a lack of durable response, and in vitro, there is incomplete apoptosis36. In recent years, targeting mitochondrial function to improve the response to BRAF/MAPK inhibitors and overcome resistance has shown promising results37-39. Therefore, we tested whether combination treatment with telmisartan can improve the efficacy of vemurafenib. To assess the cytotoxic effects of the drug combinations, we used the Chou-Talalay model40, which requires drugs to be administered at a fixed dose ratio. We treated A375 cells with a combination of telmisartan and vemurafenib in a 5 × 5 dose matrix, such that the telmisartan IC50 to vemurafenib IC50 ratio was 83:1, and measured the resultant cell viabilities by the MTT assay (Figure 7A). Isobologram analysis of the drug combination treatment at low concentrations and concentrations up to the IC50 value revealed synergism (Figure 7C and 7D, CI = 0.325 to CI = 0.776); however, at high concentrations, slight antagonism was observed (Figure 7B, CI = 1.04) (Table 1). Indeed, the addition of 25 μM telmisartan (½IC50) to vemurafenib increased apoptosis in vemurafenib-treated cells (Figure 7E representative graphs after 72 h of treatment and Figure 7F quantification). It has been reported that the inhibition of BRAF signaling leads to the fusion of mitochondrial networks41, with an increase in the mitochondrial length42. To investigate the possible mechanism of the observed synergy, we examined the mitochondrial morphology in A375 cells. Telmisartan prevented the formation of mitochondrial filaments in vemurafenib-treated cells and induced fragmentation, similar to the treatment with telmisartan alone (Figure 7G and Supplementary Figure S1).
7.
Telmisartan has synergistic effects with vemurafenib in vitro. (A) 5 × 5 dose matrix for vemurafenib x telmisartan combination in A375 cells. Percent growth inhibition is visualized using a color scale. The data in matrix are average of three experiments. Isobologram analysis for the combination effect of (B) ED90 (C) ED75 and (D) ED50, single doses of vemurafenib and telmisartan were used to draw the line of additivity. Green triangles represent single doses needed for the combination effect ED. Representative graphs (E) and quantification of three independent experiments (F) for apoptosis in A375 cells treated with combination of vemurafenib and telmisartan. Two-way ANOVA, ****P < 0.0001. (G) MitoTracker Red CMXRos staining for mitochondria in telmisartan-, vemurafenib- or the combination-treated A375 cells. Arrowheads point to the fragmented mitochondria. Scale bar 20 μm.
1.
Isobologram analysis of the drug combination treatment
| Substance | Drug concentration | |||
| I | II | III | IV | |
| Interaction: +++, synergism; ++ moderate synergism; -, slight antagonism
Tel (μM): I = 75; II = 50; III = 25; IV = 12.5 Vem (μM): I = 0.9; II = 0.6; III = 0.3; IV = 0.15 | ||||
| Tel | 61.08± | 56.89± | 40.32± | 29.35± |
| Vem | 59.48± | 54.54± | 41.99± | 36.89± |
| Mixture | 69.64± | 69.01± | 66.55± | 61.08± |
| CI | 1.104 | 0.767 | 0.456 | 0.325 |
| Interaction | - | ++ | +++ | +++ |
Telmisartan is effective in vemurafenib-resistant melanoma cells
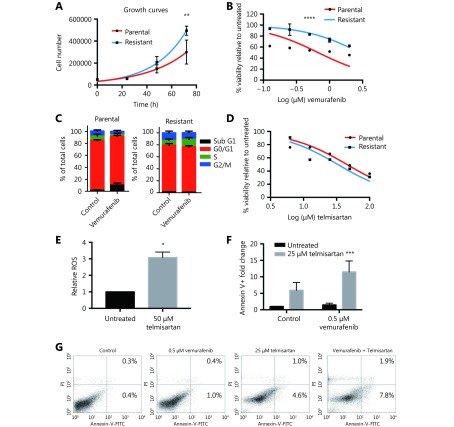
As switching to oxidative metabolism in BRAF V600E mutant vemurafenib-resistant tumors is one of the main causes of targeted drug resistance, we examined whether cells from the vemurafenib-resistant BRAF V600E mutant cell line A375 are sensitive to telmisartan. We generated the A375R cell line by continuously growing parental A375 cells in the presence of increasing concentrations of vemurafenib, starting from IC10, until reaching 2 × IC50 of the parental A375 (1 μM vemurafenib) with no detectable cell death. The resistant cell line had a shorter doubling time (18 h, compared to 24 h for the parental cell line, Figure 8A) and five times higher IC50 value for vemurafenib, as seen in the MTT test (3 μM, compared to 0.6 μM for the parental cell line, Figure 8B). Analysis of the cell cycle showed that unlike the parental cell line, which in response to 0.5 μM vemurafenib showed an increase in the fraction of sub G1 phase cells (late apoptosis) and a decrease in the fraction of S and G2/M phase cells after 72 h of treatment, the cell cycle distribution in A375R cells was not affected by vemurafenib treatment (Figure 8C). Nevertheless, the A375R cell line still responded to telmisartan, with an IC50 of 35 μM, as observed in the MTT test (Figure 8D), and showed the induction of ROS generation in the presence of telmisartan (Figure 8E). In addition, treatment with telmisartan sensitized the cells to vemurafenib, as shown by the increased apoptotic fraction of A375R cells treated with 25 μM telmisartan and 0.5 μM vemurafenib, compared to the treatment with either agent alone (Figure 8F quantification and Figure 8G representative graphs of Annexin/PI assay). These results imply that telmisartan may revert the vemurafenib resistance acquired by melanoma cells.
8.
Telmisartan is effective in vemurafenib-resistant melanoma cells. (A) Growth rates and (B) vemurafenib sensitivity of A375 parental and A375R vemurafenib resistant cell line. Non-linear fit, Two-way ANOVA, P = 0.005 for the 72 h time point in growth curves, ****P < 0.0001 for sensitivity across all values. (C) Cell cycle distribution of A375 parental and A375R cells after 72 h treatment with 0.5 μM vemurafenib, n = 3. (D) Percent viability of A375 and A375R cells after 72 h treatment with telmisartan, presented as log (inhibitor) vs. normalized response. (E) Relative ROS (DCFDA) in A375R cells after 24 h treatment with 50 μM telmisartan, values represent mean ± SD, *P < 0.05, t-test, n = 3. (F) Quantification and (G) representative graphs of apoptosis assay in A375R cells after 72 h treatment with telmisartan, vemurafenib or the combination. Values represent mean ± SD, Two-way ANOVA, ***P < 0.001, n = 3.
Discussion
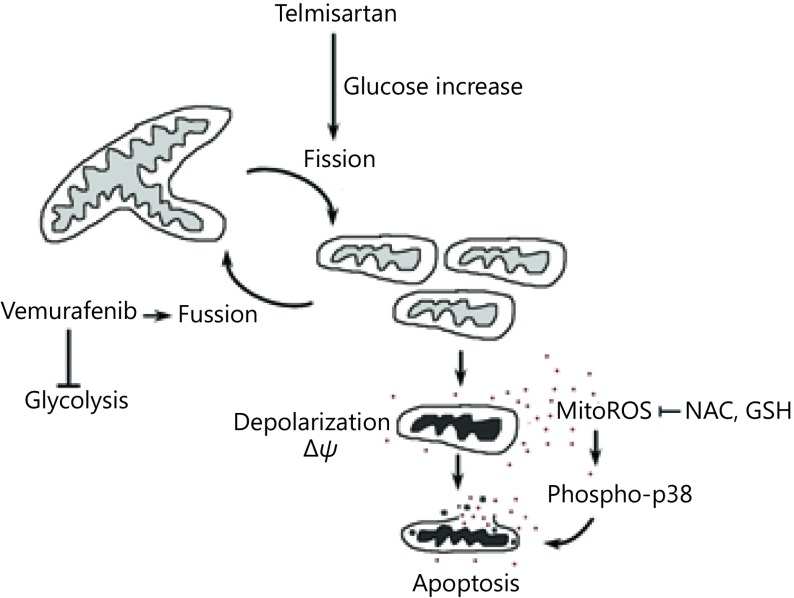
While metastatic melanoma remains an incurable disease, in recent years, immune-checkpoint inhibitors and targeted drugs have improved the progression-free and overall survival of melanoma patients43. Unfortunately, most responses to targeted therapy are transient due to the development of secondary mutations, upregulation of alternative signaling cascades, and metabolic adaptations. In this study, we tested the effects of telmisartan, which is an AGTR1 inhibitor and partial agonist of the PPARγ receptor, on melanoma cell viability. We found that the mRNA expression for both receptors is present in human melanoma samples and melanoma cell lines, with a trend of downregulation, compared to uninvolved skin. Losartan, a pure AGTR1 inhibitor, had no effects on cell viability; however, the effects of telmisartan also did not correlate with the PPARγ receptor expression. Various thiazolidinediones (PPARγ agonists) have been reported to inhibit the activity of OXPHOS complexes44 independently of the PPARγ receptor45. In our study, telmisartan induced melanoma cell apoptosis, more efficiently in cells from BRAF mutant melanoma cell lines, which require constant glucose and glutamine sources for rapid proliferation and growth46. This implied that the cytotoxic effect of telmisartan is metabolism dependent. Melanoma cells have intrinsically high levels of oxidative stress due to their accelerated metabolism, which renders them more susceptible to oxidative stress-induced cell death than normal cells47,48. We found that telmisartan induces the generation of ROS and alters the mitochondrial polarization and morphology. Telmisartan increased the glucose uptake, but failed to induce the increase in glycolysis. In addition to its role in energy production, glucose metabolism leads to the formation of pyruvate and NADPH, both of which function in the cellular detoxification of hydroperoxides. When glucose-stimulated ROS production, leading to further glucose uptake, is not adequately counterbalanced by (glucose-stimulated) ROS scavenging systems, a toxic cycle is triggered, ultimately leading to cell death30, which is what we observed in the telmisartan-treated melanoma cells. We hypothesize that the pro-apoptotic effects of telmisartan were PPARγ receptor-independent, as they did not correlate with the PPARγ expression levels, but were metabolic phenotype-dependent, as the effects of telmisartan did correlate with the BRAF status. Consistent with this, the combination of telmisartan and vemurafenib had synergistic effects in vitro. The addition of a low dose of telmisartan increased apoptosis in vemurafenib-treated cells and induced mitochondrial fragmentation. Synergy with vemurafenib could be argued by the prevention of mitochondrial fusion that happens upon vemurafenib treatment as a strategy to compensate for the inhibition of glycolysis39. The proposed mechanism of telmisartan action is depicted in Supplementary Figure S2. In addition, telmisartan treatment was effective in vemurafenib-resistant A375R cells; more importantly, telmisartan treatment sensitized these cells to vemurafenib.
Specific PPARγ agonists have been previously reported to have anti-melanoma effects10, with these effects being mediated through PPARγ11, 49. They have also been reported to act at the mitochondrial level, independent of the PPARγ protein level, when administered at higher doses12. Unfortunately, clinical monotherapy trials with PPARγ agonists were hindered by studies showing pro-angiogenic and pro-tumorigenic effects of direct PPARγ agonists50. However, the extent of the PPARγ-mediated transcription stimulated by telmisartan is one-third of that stimulated by glitazones51, and the binding of telmisartan to PPARγ results in a different gene expression profile52. In our study, telmisartan showed pro-apoptotic effects at lower doses when compared to the direct agonist pioglitazone, and with a distinct mechanism. In healthy individuals, the maximum steady-state plasma level of telmisartan after the oral intake of 320 mg of telmisartan is 20 μM in males53 and the plasma concentrations of telmisartan are generally 2–3 times higher in females than in males54. Therefore, effective doses of telmisartan examined in vitro can be administered to patients. Our findings provide a rationale for retrospective studies aiming to determine whether telmisartan influences the progression, therapy outcome, and mortality rate in melanoma patients.
Acknowledgements
This work was supported by grants from the Serbian Ministry for Education, Science and Technology Development (Grant No. III41026 and 175053). We would like to thank Suada Murtezani, Marija Vidosavljević, Nemanja Milosavljević and Nevena Kardum for technical assistance.
Conflict of interest statement
No potential conflicts of interest are disclosed.
Supplementary material
S1.
Immunocytochemistry of TOM20 (green) marker for mitochondria in telmisartan-, vemurafenib- or the combination-treated A375 cells. Nuclei-DAPI-blue, arrowheads point to fragmented mitochondria.
S2.
Schematic of the proposed mechanism of telmisartan action.
References
- 1.Luke JJ, Flaherty KT, Ribas A, Long GV Targeted agents and immunotherapies: optimizing outcomes in melanoma. Nat Rev Clin Oncol. 2017;14:463–82. doi: 10.1038/nrclinonc.2017.43. [DOI] [PubMed] [Google Scholar]
- 2.Seidel JA, Otsuka A, Kabashima K Anti-PD-1 and anti-CTLA-4 therapies in cancer: mechanisms of action, efficacy, and limitations. Front Oncol. 2018;8:86. doi: 10.3389/fonc.2018.00086. [DOI] [PMC free article] [PubMed] [Google Scholar]
- 3.Kakadia S, Yarlagadda N, Awad R, Kundranda M, Niu JX, Naraev N, et al Mechanisms of resistance to BRAF and MEK inhibitors and clinical update of US Food and Drug Administration-approved targeted therapy in advanced melanoma. Onco Targets Ther. 2018;11:7095–107. doi: 10.2147/OTT. [DOI] [PMC free article] [PubMed] [Google Scholar]
- 4.Parmenter TJ, Kleinschmidt M, Kinross KM, Bond ST, Li J, Kaadige MR, et al Response of BRAF-mutant melanoma to BRAF inhibition is mediated by a network of transcriptional regulators of glycolysis . Cancer Discov. 2014;4:423–33. doi: 10.1158/2159-8290.CD-13-0440. [DOI] [PMC free article] [PubMed] [Google Scholar]
- 5.Haq R, Shoag J, Andreu-Perez P, Yokoyama S, Edelman H, Rowe GC, et al Oncogenic BRAF regulates oxidative metabolism via PGC1α and MITF . Cancer Cell. 2013;23:302–15. doi: 10.1016/j.ccr.2013.02.003. [DOI] [PMC free article] [PubMed] [Google Scholar]
- 6.Abildgaard C, Guldberg P Molecular drivers of cellular metabolic reprogramming in melanoma. Trends Mol Med. 2015;21:164–71. doi: 10.1016/j.molmed.2014.12.007. [DOI] [PubMed] [Google Scholar]
- 7.Shim JS, Liu JO Recent advances in drug repositioning for the discovery of new anticancer drugs. Int J Biol Sci. 2014;10:654–63. doi: 10.7150/ijbs.9224. [DOI] [PMC free article] [PubMed] [Google Scholar]
- 8.Otake AH, Mattar AL, Freitas HC, Machado CML, Nonogaki S, Fujihara CK, et al Inhibition of angiotensin II receptor 1 limits tumor-associated angiogenesis and attenuates growth of murine melanoma. Cancer Chemother Pharmacol. 2010;66:79–87. doi: 10.1007/s00280-009-1136-0. [DOI] [PubMed] [Google Scholar]
- 9.Kliewer SA, Xu HE, Lambert MH, Willson TM Peroxisome proliferator-activated receptors: from genes to physiology. Recent Prog Horm Res. 2001;56:239–63. doi: 10.1210/rp.56.1.239. [DOI] [PubMed] [Google Scholar]
- 10.Mössner R, Schulz U, Krüger U, Neumann C, Reich K, Middel P, et al Agonists of peroxisome proliferator-activated receptor γ inhibit cell growth in malignant melanoma. J Invest Dermatol. 2002;119:576–82. doi: 10.1046/j.1523-1747.2002.01861.x. [DOI] [PubMed] [Google Scholar]
- 11.Paulitschke V, Gruber S, Hofstätter E, Haudek-Prinz V, Klepeisz P, Schicher N, et al Proteome analysis identified the PPARγ ligand 15d-PGJ2 as a novel drug inhibiting melanoma progression and interfering with tumor-stroma interaction. PLoS One. 2012;7:e46103. doi: 10.1371/journal.pone.0046103. [DOI] [PMC free article] [PubMed] [Google Scholar]
- 12.Botton T, Puissant A, Bahadoran P, Annicotte JS, Fajas L, Ortonne JP, et al In vitro and in vivo anti-melanoma effects of ciglitazone . J Invest Dermatol. 2009;129:1208–18. doi: 10.1038/jid.2008.346. [DOI] [PubMed] [Google Scholar]
- 13.Zhang SL, Wang YY Telmisartan inhibits NSCLC A549 cell proliferation and migration by regulating the PI3K/AKT signaling pathway. Oncol Lett. 2018;15:5859–64. doi: 10.3892/ol.2018.8002. [DOI] [PMC free article] [PubMed] [Google Scholar]
- 14.Rasheduzzaman M, Moon JH, Lee JH, Nazim UM, Park SY Telmisartan generates ROS-dependent upregulation of death receptor 5 to sensitize TRAIL in lung cancer via inhibition of autophagy flux . Int J Biochem Cell Biol. 2018;102:20–30. doi: 10.1016/j.biocel.2018.06.006. [DOI] [PubMed] [Google Scholar]
- 15.Pu ZC, Zhu M, Kong DF Telmisartan prevents proliferation and promotes apoptosis of human ovarian cancer cells through upregulating PPARγ and downregulating MMP-9 expression. Mol Med Rep. 2016;13:555–9. doi: 10.3892/mmr.2015.4512. [DOI] [PubMed] [Google Scholar]
- 16.Oura K, Tadokoro T, Fujihara S, Morishita A, Chiyo T, Samukawa E, et al Telmisartan inhibits hepatocellular carcinoma cell proliferation in vitro by inducing cell cycle arrest. Oncol Rep. 2017;38:2825–35. doi: 10.3892/or.2017.5977. [DOI] [PMC free article] [PubMed] [Google Scholar]
- 17.Fujihara S, Morishita A, Ogawa K, Tadokoro T, Chiyo T, Kato K, et al The angiotensin II type 1 receptor antagonist telmisartan inhibits cell proliferation and tumor growth of esophageal adenocarcinoma via the AMPKα/mTOR pathway in vitro and in vivo . Oncotarget. 2017;8:8536–49. doi: 10.18632/oncotarget.14345. [DOI] [PMC free article] [PubMed] [Google Scholar]
- 18.Fodstad O, Kjønniksen I, Aamdal S, Nesland JM, Boyd MR, Pihl A Extrapulmonary, tissue-specific metastasis formation in nude mice injected with FEMX-I human melanoma cells. Cancer Res. 1988;48:4382–8. [PubMed] [Google Scholar]
- 19.Timenetsky J, Santos LM, Buzinhani M, Mettifogo E Detection of multiple mycoplasma infection in cell cultures by PCR. Braz J Med Biol Res. 2006;39:907–14. doi: 10.1590/S0100-879X2006000700009. [DOI] [PubMed] [Google Scholar]
- 20.Zou CH, Wang YJ, Shen ZF 2-NBDG as a fluorescent indicator for direct glucose uptake measurement. J Biochem Biophys Methods. 2005;64:207–15. doi: 10.1016/j.jbbm.2005.08.001. [DOI] [PubMed] [Google Scholar]
- 21.Chou TC, Talalay P Quantitative analysis of dose-effect relationships: the combined effects of multiple drugs or enzyme inhibitors. Adv Enzyme Regul. 1984;22:27–55. doi: 10.1016/0065-2571(84)90007-4. [DOI] [PubMed] [Google Scholar]
- 22.Talantov D, Mazumder A, Yu JX, Briggs T, Jiang YQ, Backus J, et al Novel genes associated with malignant melanoma but not benign melanocytic lesions. Clin Cancer Res. 2005;11:7234–42. doi: 10.1158/1078-0432.CCR-05-0683. [DOI] [PubMed] [Google Scholar]
- 23.Kabbarah O, Nogueira C, Feng B, Nazarian RM, Bosenberg M, Wu M, et al Integrative genome comparison of primary and metastatic melanomas. PLoS One. 2010;5:e10770. doi: 10.1371/journal.pone.0010770. [DOI] [PMC free article] [PubMed] [Google Scholar]
- 24.Riker AI, Enkemann SA, Fodstad O, Liu SH, Ren SP, Morris C, et al The gene expression profiles of primary and metastatic melanoma yields a transition point of tumor progression and metastasis. BMC Med Genomics. 2008;1:13. doi: 10.1186/1755-8794-1-13. [DOI] [PMC free article] [PubMed] [Google Scholar]
- 25.Xu L, Shen SS, Hoshida Y, Subramanian A, Ross K, Brunet JP, et al Gene expression changes in an animal melanoma model correlate with aggressiveness of human melanoma metastases. Mol Cancer Res. 2008;6:760–9. doi: 10.1158/1541-7786.MCR-07-0344. [DOI] [PMC free article] [PubMed] [Google Scholar]
- 26.Bogunovic D, O'Neill DW, Belitskaya-Levy I, Vacic V, Yu YL, Adams S, et al Immune profile and mitotic index of metastatic melanoma lesions enhance clinical staging in predicting patient survival. Proc Natl Acad Sci USA. 2009;106:20429–34. doi: 10.1073/pnas.0905139106. [DOI] [PMC free article] [PubMed] [Google Scholar]
- 27.Cheng XL, Holenya P, Can SZ, Alborzinia H, Rubbiani R, Ott I, et al A TrxR inhibiting gold(I) NHC complex induces apoptosis through ASK1-p38-MAPK signaling in pancreatic cancer cells. Mol Cancer. 2014;13:221. doi: 10.1186/1476-4598-13-221. [DOI] [PMC free article] [PubMed] [Google Scholar]
- 28.Cash TP, Pan Y, Simon MC Reactive oxygen species and cellular oxygen sensing. Free Radic Biol Med. 2007;43:1219–25. doi: 10.1016/j.freeradbiomed.2007.07.001. [DOI] [PMC free article] [PubMed] [Google Scholar]
- 29.Suski JM, Lebiedzinska M, Bonora M, Pinton P, Duszynski J, Wieckowski MR Relation between mitochondrial membrane potential and ROS formation. Methods Mol Biol. 2012;810:183–205. doi: 10.1007/978-1-61779-382-0. [DOI] [PubMed] [Google Scholar]
- 30.Liemburg-Apers DC, Willems PHGM, Koopman WJH, Grefte S Interactions between mitochondrial reactive oxygen species and cellular glucose metabolism. Arch Toxicol. 2015;89:1209–26. doi: 10.1007/s00204-015-1520-y. [DOI] [PMC free article] [PubMed] [Google Scholar]
- 31.Kim HI, Ahn YH Role of peroxisome proliferator-activated receptor-γ in the glucose-sensing apparatus of liver and β-cells. Diabetes. 2004;53 Suppl 1:S60–5. doi: 10.2337/diabetes.53.2007.s60. [DOI] [PubMed] [Google Scholar]
- 32.El-Kebbi IM, Roser S, Pollet RJ Regulation of glucose transport by pioglitazone in cultured muscle cells. Metabolism. 1994;43:953–8. doi: 10.1016/0026-0495(94)90173-2. [DOI] [PubMed] [Google Scholar]
- 33.Gottfried E, Rogenhofer S, Waibel H, Kunz-Schughart LA, Reichle A, Wehrstein M, et al Pioglitazone modulates tumor cell metabolism and proliferation in multicellular tumor spheroids. Cancer Chemother Pharmacol. 2011;67:117–26. doi: 10.1007/s00280-010-1294-0. [DOI] [PubMed] [Google Scholar]
- 34.Yu TZ, Robotham JL, Yoon Y Increased production of reactive oxygen species in hyperglycemic conditions requires dynamic change of mitochondrial morphology. Proc Natl Acad Sci USA. 2006;103:2653–8. doi: 10.1073/pnas.0511154103. [DOI] [PMC free article] [PubMed] [Google Scholar]
- 35.Yu TZ, Jhun BS, Yoon Y High-glucose stimulation increases reactive oxygen species production through the calcium and mitogen-activated protein kinase-mediated activation of mitochondrial fission. Antioxid Redox Signal. 2011;14:425–37. doi: 10.1089/ars.2010.3284. [DOI] [PMC free article] [PubMed] [Google Scholar]
- 36.Haferkamp S, Borst A, Adam C, Becker TM, Motschenbacher S, Windhövel S, et al Vemurafenib induces senescence features in melanoma cells. J Invest Dermatol. 2013;133:1601–9. doi: 10.1038/jid.2013.6. [DOI] [PubMed] [Google Scholar]
- 37.Zhang G, Frederick DT, Wu L, Wei Z, Krepler C, Srinivasan S, et al Targeting mitochondrial biogenesis to overcome drug resistance to MAPK inhibitors. J Clin Invest. 2016;126:1834–56. doi: 10.1172/JCI82661. [DOI] [PMC free article] [PubMed] [Google Scholar]
- 38.Strohecker AM, White E Targeting mitochondrial metabolism by inhibiting autophagy in BRAF-driven cancers . Cancer Discov. 2014;4:766–72. doi: 10.1158/2159-8290.CD-14-0196. [DOI] [PMC free article] [PubMed] [Google Scholar]
- 39.Corazao-Rozas P, Guerreschi P, André F, Gabert PE, Lancel S, Dekiouk S, et al Mitochondrial oxidative phosphorylation controls cancer cell's life and death decisions upon exposure to MAPK inhibitors. Oncotarget. 2016;7:39473–85. doi: 10.18632/oncotarget.7790. [DOI] [PMC free article] [PubMed] [Google Scholar]
- 40.Chou TC Drug combination studies and their synergy quantification using the Chou-Talalay method. Cancer Res. 2010;70:440–6. doi: 10.1158/0008-5472.CAN-09-1947. [DOI] [PubMed] [Google Scholar]
- 41.Serasinghe MN, Wieder SY, Renault TT, Elkholi R, Asciolla JJ, Yao JL, et al Mitochondrial division is requisite to RAS-induced transformation and targeted by oncogenic MAPK pathway inhibitors. Mol Cell. 2015;57:521–36. doi: 10.1016/j.molcel.2015.01.003. [DOI] [PMC free article] [PubMed] [Google Scholar]
- 42.Anderson GR, Wardell SE, Cakir M, Yip C, Ahn YR, Ali M, et al Dysregulation of mitochondrial dynamics proteins are a targetable feature of human tumors. Nat Commun. 2018;9:1677. doi: 10.1038/s41467-018-04033-x. [DOI] [PMC free article] [PubMed] [Google Scholar]
- 43.Pasquali S, Kefford R, Sileni VC, Nitti D, Rossi CR, Pilati P, et al Systemic treatments for metastatic cutaneous melanoma. Cochrane Database Syst Rev. 2018;2:CD011123.. doi: 10.1002/14651858.CD011123.pub2. [DOI] [PMC free article] [PubMed] [Google Scholar]
- 44.Nadanaciva S, Dykens JA, Bernal A, Capaldi RA, Will Y Mitochondrial impairment by PPAR agonists and statins identified via immunocaptured OXPHOS complex activities and respiration . Toxicol Appl Pharmacol. 2007;223:277–87. doi: 10.1016/j.taap.2007.06.003. [DOI] [PubMed] [Google Scholar]
- 45.Scatena R, Bottoni P, Giardina B Mitochondria, PPARs, and cancer: is receptor-independent action of PPAR agonists a key? PPAR Res. 2008;2008:256251. doi: 10.1155/2008/256251. [DOI] [PMC free article] [PubMed] [Google Scholar]
- 46.Lakhter AJ, Hamilton J, Konger RL, Brustovetsky N, Broxmeyer HE, Naidu SR Glucose-independent acetate metabolism promotes melanoma cell survival and tumor growth. J Biol Chem. 2016;291:21869–79. doi: 10.1074/jbc.M115.712166. [DOI] [PMC free article] [PubMed] [Google Scholar]
- 47.Hambright HG, Meng P, Kumar AP, Ghosh R Inhibition of PI3K/AKT/mTOR axis disrupts oxidative stress-mediated survival of melanoma cells. Oncotarget. 2015;6:7195–208. doi: 10.18632/oncotarget.3131. [DOI] [PMC free article] [PubMed] [Google Scholar]
- 48.Nogueira V, Hay N Molecular pathways: reactive oxygen species homeostasis in cancer cells and implications for cancer therapy. Clin Cancer Res. 2013;19:4309–14. doi: 10.1158/1078-0432.CCR-12-1424. [DOI] [PMC free article] [PubMed] [Google Scholar]
- 49.Smith AG, Beaumont KA, Smit DJ, Thurber AE, Cook AL, Boyle GM, et al PPARγ agonists attenuate proliferation and modulate Wnt/β-catenin signalling in melanoma cells. Int J Biochem Cell Biol. 2009;41:844–52. doi: 10.1016/j.biocel.2008.08.037. [DOI] [PubMed] [Google Scholar]
- 50.Veliceasa D, Schulze-Hoëpfner FT, Volpert OV PPARgamma and agonists against cancer: rational design of complementation treatments. PPAR Res. 2008;2008:945275. doi: 10.1155/2008/945275. [DOI] [PMC free article] [PubMed] [Google Scholar]
- 51.Tagami T, Yamamoto H, Moriyama K, Sawai K, Usui T, Shimatsu A, et al A selective peroxisome proliferator-activated receptor-γ modulator, telmisartan, binds to the receptor in a different fashion from thiazolidinediones. Endocrinology. 2009;150:862–70. doi: 10.1210/en.2008-0502. [DOI] [PubMed] [Google Scholar]
- 52.Schupp M, Clemenz M, Gineste R, Witt H, Janke J, Helleboid S, et al Molecular characterization of new selective peroxisome proliferator-activated receptor γ modulators with angiotensin receptor blocking activity. Diabetes. 2005;54:3442–52. doi: 10.2337/diabetes.54.12.3442. [DOI] [PubMed] [Google Scholar]
- 53.Stangier JC, Su CAPF, Roth W Pharmacokinetics of orally and intravenously administered telmisartan in healthy young and elderly volunteers and in hypertensive patients. J Int Med Res. 2000;28:149–67. doi: 10.1177/147323000002800401. [DOI] [PubMed] [Google Scholar]
- 54.Cabaleiro T, Román M, Ochoa D, Talegón M, Prieto-Pérez R, Wojnicz A, et al Evaluation of the relationship between sex, polymorphisms in CYP2C8 and CYP2C9, and pharmacokinetics of angiotensin receptor blockers . Drug Metab Dispos. 2013;41:224–9. doi: 10.1124/dmd.112.046292. [DOI] [PubMed] [Google Scholar]


