

Abstract
Computer hardware development coupled with the development of quantum chemistry, new computational models and algorithms, and user-friendly interfaces have lowered the barriers to the use of computation in the discovery and structure elucidation of natural products. Consequently, the use of computational chemistry software as a tool to discover and determine the structure of natural products has become more common in recent years. In this review, we provide several examples of recent studies that used computer technology to facilitate the discovery and structure determination of various natural products.
Keywords: Molecular networking, Density functional theory, Computer-assisted structure elucidation
Introduction
Computer technology has advanced by leaps and bounds in recent years. In the hardware department, the computing power of current high-end consumer personal computers now rivals that of supercomputers available at the end of the last century. Computer hardware development coupled with the development of quantum chemistry, new computational models and algorithms, and user-friendly interfaces have lowered the barriers to the use of computation for the discovery and structure elucidation of natural products. In the present review, we provide several examples of recent studies that used spectrocopic methods in combination with computer technology to faciltate the discovery and structure determination of natural products. The review has been structured into sections based on the spectroscopic method assisted by computation.
Tandem mass spectroscopy
Data obtained from tandem mass spectroscopy (MS/MS) studies provide information on the structure of a compound. The most basic use of computation in MS/MS data analysis is to identify a compound by matching its MS/MS data to data stored in reference spectra databases and libraries. However, as has been noted elsewhere [1–7], the reference spectra currently available are very limited, and only 1.8% of spectra in an untargeted metabolomics experiment can be annotated. Thus, other computational approaches for interpreting and predicting MS/MS data have been developed [5–12]. One method attracting the interest of those researchers working in the field of natural products is molecular networking (MN) [5] which is freely available (including a step-by-step tutorial) on the Global Natural Products Social Molecular Networking (GNPS), an open-access knowledge base for the community-wide organization and sharing of raw, processed, or identified MS/MS data [2].
MN is a computational method for interpreting and visualizing MS/MS data. An important aspect of MN is that it provides a visual overview of the ions of molecules in the MS/MS dataset, grouped by the similarities of their MS/MS fragmentation patterns that suggest their structural similarities, without the need of any prior knowledge regarding the chemical composition of the samples [1, 4, 5, 13]. The use of reference spectra to annotate the known compounds is also possible with MN, and these reference spectra are necessary for MN to be used as a dereplication strategy [4]. Although data visualization can be performed on GPNS, visualization of an entire molecular network is usually done with Cytoscape, an open source bioinformatics software platform [14]. In a molecular network, molecular ions are represented as nodes (usually circles), and related molecular ions are connected by edges (lines). In Cytoscape, edge thickness, node size, and node color may also be tuned to facilitate data interpretation. For example, the node color can be set to represent the data associated with the samples (e.g., the species, strains, sampling location, culture condition, or bioactivity strength), and the node size can be set to represent ion intensity or bioactivity score. Thus, the similarities and differences between two or more samples can be directly and easily observed (see Fig. 1 for an example).
Fig. 1.

Example of molecular networking of three samples. The pie chart in a node represents the extracted ion chromatogram peak area. Identified compounds are shown as nodes with a light-blue border (color figure online)
A growing number of reports on the successful use of MN in the discovery of natural products have been published. Application of MN to a set of 292 New Caledonian Euphorbiaceae extracts led to the identification of a group of ions specific to Codiaeum peltatum bark extract. Subsequent purification of the targeted compounds resulted in the isolation of four novel chlorinated monoterpenyl quinolones, namely, chloroaustralasines A–C and isochloroaustralasine A (1–4, Fig. 2) [15]. When bioactivity and taxonomic data were included in the analysis, application of MN to the same set of 292 New Caledonian Euphorbiaceae extracts led to the prediction of the active metabolites of Bocquillonia nervosa and Neoguillauminia cleopatra against two biological targets (Wnt signaling pathway and chikungunya virus replication), which were then verified through their isolation and bioactivity assay [16]. MN can also be used in combination with bioactivity score prediction, which is calculated by considering the relative abundance of a molecule in fractions and the bioactivity level of each fraction, as shown by the compounds with anti-chikunguya virus replication activity isolated from Euphorbia dendroides [17]. The combination of MN and genomic data also led to the isolation of columbamides A–C, a new class of di- and trichlorinated acyl amides with cannabinomimetic activity, from marine cyanobacteria (5–7, Fig. 2) [18]. Retimycin A, a new member of the quinomycin family of antibiotics, was also isolated through the use of MN and genome mining (8, Fig. 2) [19]. MN can also be used to explore the metabolites produced in a co-culture experiments, as shown by Dorrestein et al. [5] and Tasdemir et al. [20].
Fig. 2.
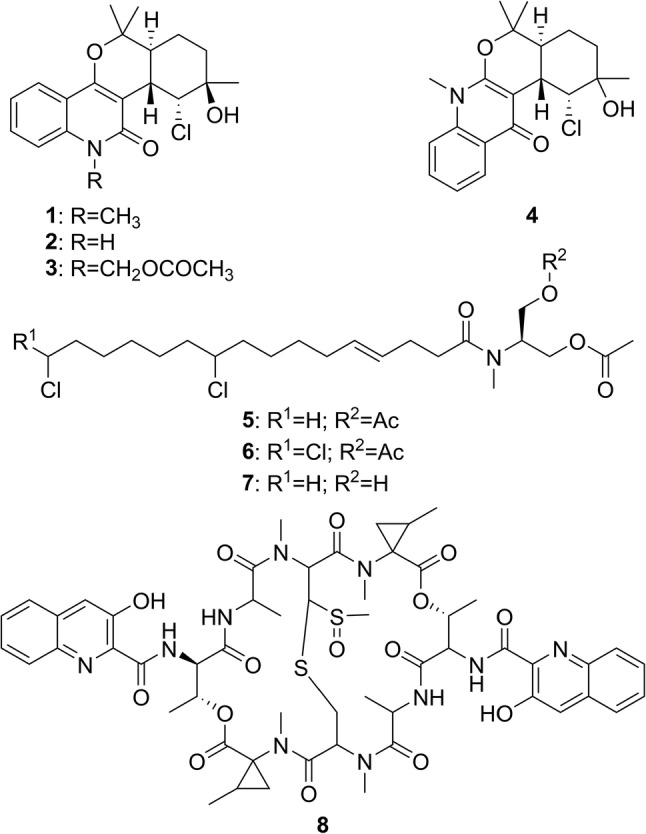
Structures of 1–8
NMR spectroscopy
Automatic structure elucidation
Several reviews and books have been published on automatic structure elucidation, which is often referred as computer-assisted structure elucidation (CASE) [21–23]. Recently developed CASE programs, such as ACD/Structure Elucidator and Bruker CMC-se, are already able to automatize many of the steps required for the analysis and interpretation of standard one- and two-dimensional, respectively) NMR data, with minimal human interference, such as confirmation of the automatically-generated correlation table. These CASE programs also include empirical chemical-shift predictions to help in ranking the possible structures. In addition, newly designed NMR experiments have recently been performed that are evidently more machine readable, such as the “pure shift” spectra (spectra where all the 1H are decoupled, thus all multiplets are transformed into singlets) [24, 25]. Conventionally, CASE can only be used to predict possible planar structures. However, several attempts to include relative configuration determination inside CASE programs (CASE-3D) by including NOE [26] or residual dipolar couplings (RDC) [27, 28] data have also been reported.
CASE and CASE-3D have been successfully deployed in the structural revision or structure elucidation of natural products. Elyashberg et al. [22] reviewed CASE-based structural revision in 2010, and a more recent study involving the use of CASE-3D in the phytochemical study of Senecio volckmannii has been reported by Castro et al. in 2018 [29].
Calculated anisotropic NMR data
Residual dipolar couplings, a component of anisotropic NMR data, are observed when the molecules are partially aligned in a weakly aligning medium (orienting medium that only induces a low degree of order), usually a liquid crystal or constrained polymeric gel such as PMMA [poly(methyl methacrylate)] [30] and PHEMA [poly(2-hydroxylethyl methacrylate)] [31]. Residual chemical shift anisotropy (RCSA), another component of anisotropic NMR data, is observed when the molecules are partially aligned. RDC data provide the relative orientation of different 1H–13C bonds, while RCSA data provide the relative orientations of different carbon chemical shielding tensors and, as such, are the more useful tool to study for proton-deficient molecules. The chemical shift tensor information necessary for RCSA analysis can be obtained using density functional theory (DFT) calculations. Several reviews on the use of RDC and RCSA for the determination of relative configuration of small organic molecules have been published [27, 32–37]. More importantly, a protocol on the use of anisotropic NMR parameters for the structure elucidation of small organic compounds has recently become available [38].
NMR parameter prediction by DFT calculation
In general, property prediction using DFT calculations involves (1) a conformational search by Monte Carlo methods using molecular mechanics [Merck molecular force field (MMFF) 94, among others] and/or semi-empirical methods [Austin Model 1 (AM1), among others]; (2) geometry optimization at the DFT level; (3) molecular property calculations at the DFT level; (4) Boltzmann-weighting of the molecular properties; (5) correction of the molecular properties (by wavelength shifting, chemical shift scaling, etc.); and (6) comparison of the experimental and corrected calculated properties (Fig. 3). It should be noted that two DFT calculations [steps (2) and (3)] can be performed on different levels, i.e., different density functional approximations (DFAs) and/or basis-sets with/without solvent effect modeling. The calculation level is often expressed as [Functional 1]/[Basis set 1]//[Functional 2]/[Basis set 2], which means that the property calculation was performed by using Functional 1 and Basis set 1 on a geometry optimized by using Functional 2 and Basis set 2. In addition, several methods for calculating the DFT-NMR are currently available, such as the gauge-including atomic orbitals (GIAO) method, the individual gauge for localized orbitals (IGLO) method, and the continuous set of gauge transformation (CSGT) method. Among these three methods, GIAO is the most commonly used method.
Fig. 3.
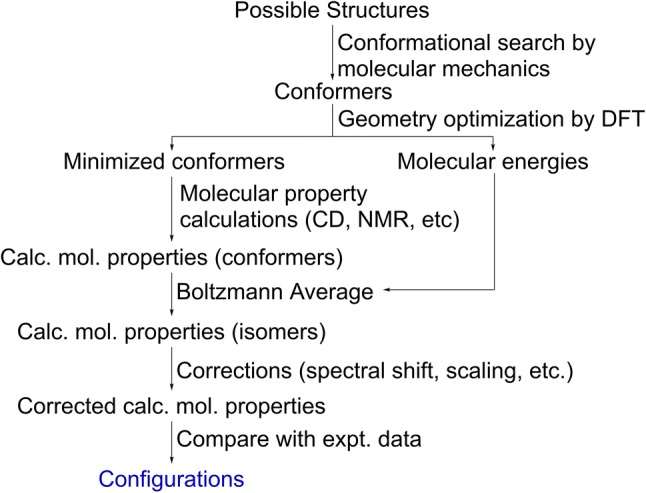
Steps in molecular property calculations by density functional theory (DFT)
DFT calculations can be performed by using programs such as the Gaussian, Turbomole, NWChem, ORCA, or Spartan program. The accuracy of the DFT calculations mainly depends on the basis set and DFAs used for the calculations. Over the past decades, as a consequence of the unknown true density functional, many DFAs have been developed to provide better accuracy and/or lower computational costs (shorter computational time). Some of the DFAs were developed with a specific use in mind, such as for kinetics, thermodynamics, or transition metals, and may not perform well in calculations of properties other than the intended one.
Goerigk et al. [39] recently assessed the performance of 217 variations of London dispersion-corrected and -uncorrected DFAs of the barrier heights, basic properties, and reaction energies for small systems, the reaction energies for large systems and the isomerization reaction, intramolecular non-covalent interactions, and intermolecular non-covalent interactions, and reported a recommended DFA for each specific purpose and for the general purpose. The use of dispersion correction is generally recommended in order to obtain better relative conformational energies and geometries of organic compounds [39]. The best general-purpose hybrid DFAs are ωB97X-V, M052X-D3(0), ωB97X-D3, and M06-2X-D3(0). Regarding general-purpose conventional hybrid DFAs, the recommended DFA is PW6B95-D3(BJ) (dispersion correction with BJ-damping of PW6B95 DFA). The more popular hybrid functional B3LYP is only ranked 18th. Among the low-cost generalized gradient approximation DFAs, the best three DFAs are revPBE-D3(BJ), B97-D3(BJ) and OLYP-D3(BJ). D3(0) and D3(BJ) are dispersion correction methods developed by Grimme et al. [40] with zero damping or Becke and Johnson (BJ) damping [41], respectively.
For DFT calculation in general, the use of a bigger basis set and inclusion of solvent effect modeling, such as IEF-PCM [42–44] and COSMO [45], will lead to better accuracy. However, it is important to note that while the inclusion of solvent effect modeling will not significantly increase the calculation time, the use of a larger basis set will significantly increase it.
Magnetic shielding tensors are obtained by using DFT calculations on NMR data. The anisotropic tensors are used in RCSA calculations, and the isotropic shielding constants are used in chemical shift calculations. Generally, the isotropic shielding constants are converted and corrected to chemical shifts by using either linear scaling (Eq. 1) or reference compounds (Eq. 2):
| 1 |
| 2 |
where δi is the calculated chemical shift of the nucleus of interest, δref is the experimental chemical shift of the reference nucleus, and σi and σref are the calculated isotropic shielding constant of the nucleus of interest and the reference nucleus, respectively. It should be noted that both σi and σref must be computed at the same level of theory. In addition, the scaling factors (intercept and slope) are empirical values obtained from the linear regression of the calculated isotropic shielding tensors from a set of reference compounds, at a given calculation level, which are plotted against their experimental chemical shifts. Therefore, each calculation level will have its own distinct scaling factors [46, 47]. A database of scaling factors collected by Tantillo and coworkers is available on the CHESHIRE CCAT website [48].
As stated above, each calculation level will have its own distinct scaling factors. Consequently, new scaling factors need to be generated for each new calculation level before the general researchers studying the natural product can use it. A more general approach, Eq. 2, is the use of reference compounds. It has been shown that the use of any single reference compound, e.g., tetramethylsilane (TMS), leads to unsatisfactory results [49, 50], leading to the proposal that multiple reference compounds [multi-standard methodology (MSTD)] be used to improve calculation accuracy [49–51]. The use of methanol for sp3 environments and benzene for sp2 environments [49, 51] or the use of multiple reference compounds possessing an environment similar to that of the compound of interest [50] has been proposed. A combination of both scaling factors and multiple reference compounds has also been proposed [52]. Finally, it is important to note that when using new calculation levels, which may provide better relative conformational energies, better geometries, or faster calculation times, the MSTD approach is more straightforward to implement than the scaling factors approach.
To evaluate the goodness-of-fit between the experimental and calculated chemical shifts, mean average error (MAE), or corrected mean average error (CMAE) for scaled data, is often used. The CP3 and DP4/DP4+ parameters are alternatives to evaluating the goodness-of-fit [53–55]. The CP3 parameter is designed to assign two sets of experimental data to two sets of structures, and the DP4/DP4+ probability parameter is designed to determine the most plausible isomer among many. Another alternative is the use of an artificial neural network for pattern recognition developed by Sarotti [56].
For most researchers on natural products, the big question is “what is the recommended calculation level?”
For the scaled chemical shift calculation, considering the limited number of available scaling factors, the use of B3LYP/6–31+G(d,p) or M06-2X/6–31+G(d,p) for the geometry optimization step combined with GIAO-mPW1PW91/6–311+G(2d,p) or GIAO-PBE0/6–311+G(2d,p) for the NMR calculation is recommended by Tantillo and coworkers for high-accuracy calculations [48]. On the other hand, the recommended level for the low-cost calculation is GIAO-B3LYP/6–31+G(d,p)//B3LYP/6–31G(d) [48]. It should be noted that for all recommended calculation levels, the implicit solvent model for chloroform using the conductor-like polarizable continuum model (CPCM) or solvation model density (SMD) is included at the NMR calculation step.
For the MSTD approach, Sarotti and Pellegrinet noted that the quality of the calculated chemical shifts is much less dependent on the calculation level [49, 51]. The use of solvent effect modeling increased the accuracy of the calculations. Moreover, the use of triple-ζ-basis sets, such as cc-pVTZ or 6–311+G(d,p), generally gave slightly better results than did the double-ζ-basis sets, such as 6–31+G(d). However, the computationally faster double-ζ-basis sets still gave good results. For the DFA part, between mPW1PW91, B3LYP, and WP04, Sarotti suggested the use of mPW1PW91 [49, 51].
There are many reports on the use of DFT-calculated NMR chemical shifts for the structure revision or structure elucidation of natural products. Willoughby and coworkers recently published the Phyton scripts, which are helpful in automating many aspects of the DFT calculations of NMR chemical shifts [57]. Bagno and coworkers showed that the structural revision of vanussal B (9, Fig. 4) could have been greatly simplified by the use of chemical shifts calculated using DFT [58]. DFT-calculated NMR has been used to determine the relative configuration of various natural products, with recent reports on halioxepines A–C isolated from marine sponges of the genus Haliclona (10–12, Fig. 5) [59], xylomolones A–B isolated from Xylocarpus moluccensis Haliclona [60], bisleuconothine B isolated from Leuconotis griffithii Haliclona [61], ceramicine N isolated from Chisocheton ceramicus [62], and walsogyne B isolated from Walsura chrysogyne [63]. It interesting that even in difficult cases such as 10–12, where two stereoclusters are separated by two methylenes, DFT NMR calculations can accurately predict the relative configurations of the product.
Fig. 4.

Structures of vannusal B (9) and the diastereomers synthesized for its structural revision
Fig. 5.
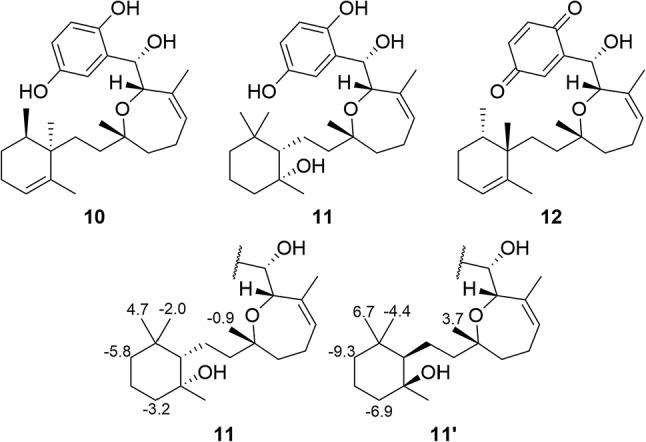
Structures of 10–12, and comparison of ΔδC (δCcalc– δCexpt) between 11 and its diastereomer.
Electronic circular dichroism, vibronic circular dichroism, optical rotation (or) and optical rotatory dispersion
An often challenging problem in the structure elucidation process of natural products is the determination of the absolute configuration (AC) of those products. Various approaches have been adopted to solve this problem, including X-ray crystallography, chiroptical methods, and NMR anisotropy methods, but each approach has its own specific limitations. Recently, comparison of the time-dependent density functional theory (TDDFT)-calculated chiroptical data with experimental chiroptical data has become commonly accepted approach to determine the AC of natural products. The principle of the determination of the ACs of natural products by TDDFT calculation is relatively simple: basically, the calculated chiroptical data are compared with the experimental data, and if the two sets of data are very similar to each other, then highly reliable assignment can be obtained. The use of TDDFT-calculated chiroptical data for the determination of ACs has been extensively reviewed and discussed in tutorials [64–69].
Regarding the calculation level for the geometry optimization calculations, a combination of B3LYP/6–31G(d) or BP86/def–SVP level of theory is often used. However, as mentioned above, there are other DFAs that should perform better. And although double-ζ-basis sets, such as def2-SVP or 6–31G(d), may give sufficient accuracy, triple-ζ-basis sets, such as def2-TZVP or 6–311+G(d,p), should give better results. The use of dispersion correction (D3) and solvent effect modeling are also recommended. As a final note, vibronic circular dichroism (VCD) calculations are more prone to inaccuracies arising from the geometry optimization calculations.
Regarding the calculation levels for the chiroptical data calculations, the use of basis sets with polarization and diffuse functions, such as 6-31G* or aug-cc-pVDZ, is very important in the calculation of electronic circular dichroism (ECD). The choice of DFA is less clear for ECD calculations, but the recommendation of Goerigk and Grimme [39], mentioned earlier in this review, may provide a clue. Indeed, although the popular DFAs, such as B3LYP and BP86, may be sufficient in many cases, the DFA ωB97X-D3 often give better results [65, 66]. For VCD calculations, the low-cost B3LYP/def2-SVP and B3LYP/6–31G(d) DFAs, or the more costly B3LYP/def2-TZVP are usually sufficient [65, 68]. For optical rotation and/or optical rotatory dispersion calculations, combinations of the B3LYP or PBE0 hybrid functional with aug-cc-pVDZ are usually sufficient. Since chiroptical data are solvent dependent, the use of solvent effect modeling is highly recommended.
The results of TDDFT calculations of UV/ECD are excitation energies and their corresponding oscillator strength and rotatory strength. The oscillator strengths are used to simulate the UV curve, and rotatory strengths are used to simulate the ECD curve. Both oscillator strength and rotatory strength can be calculated by using either the dipole–velocity gauge or the dipole–length gauge, but the use of the dipole–length gauge generally gives better results [70, 71]. The calculated oscillator strength and rotatory strength values are generally converted to the UV/ECD curve by using a Gaussian distribution function (see reference [64] for more details). The calculated UV spectra are then shifted to conform to the experimental UV spectrum, and the same shifts are also applied to the corresponding calculated ECD spectra before the calculated ECD spectra are compared with the experimental ECD of the natural product in question.
In contrast to UV/ECD calculations, the results of IR/VCD calculations are generally converted to the IR/VCD curve by using a Lorentzian distribution function, and instead of shifting, calculated IR/VCD spectra are usually scaled by a factor in the range of 0.97–0.98 [68].
There are at least several hundreds of publications reporting the use of calculated chiroptical data to assign AC to a broad range of compounds (see references [64–69] for some examples; reference [64] is available as an open access article in this journal). It can be argued that the use of calculated chiroptical data has become a routine part of procedure used in the AC assignments of natural products. In our search for bioactive compounds, we have also used calculated chiroptical data to assign the AC of isolated compounds [61, 63, 64, 72–81].
Conclusion
Computational methods can be used in practically all of the steps of the discovery and structure determination of natural products, and they have been shown to be a very useful tool in such studies. Many studies have used such methods; for example, Hamann and co-workers used MN and DFT-calculated NMR chemical shifts and ECD spectra in the discovery and assignment of aleutianamine, a new class of pyrroloiminoquinone alkaloids isolated from Latrunculia austini [82]. There have been recent effort and initiatives to make raw MS/MS and NMR data publicly available [2, 83]. The public availability of these data is very important in the development of new computational methods, in particular those that involves machine learning, such as CSI:FingerID [6] and the artificial neural network pattern recognition developed by Sarotti [56]. It can be expected that in the future most discoveries and structure elucidations of natural products will be fully assisted by computational methods.
Acknowledgements
Our isolation work was supported by a Grant-in-Aid for Scientific Research from the Ministry of Education, Culture, Sports, Science, and Technology of Japan.
Footnotes
The original version of this article was revised due to a retrospective Open Access order.
Publisher's Note
Springer Nature remains neutral with regard to jurisdictional claims in published maps and institutional affiliations.
Change history
6/28/2019
The article Computationally-assisted discovery and structure elucidation of natural products, written by Alfarius Eko Nugroho and Hiroshi Morita, was originally published electronically on the publisher’s internet portal (currently SpringerLink) on 15 May 2019 without open access.
References
- 1.Quinn RA, Nothias L-F, Vining O, Meehan M, Esquenazi E, Dorrestein PC. Molecular networking as a drug discovery, drug metabolism, and precision medicine strategy. Trends Pharmacol Sci. 2017;38:143–154. doi: 10.1016/j.tips.2016.10.011. [DOI] [PubMed] [Google Scholar]
- 2.Wang M, Carver JJ, Phelan VV, Sanchez LM, Garg N, Peng Y, Nguyen DD, Watrous J, Kapono CA, Luzzatto-Knaan T, Porto C, Bouslimani A, Melnik AV, Meehan MJ, Liu W-T, Crüsemann M, Boudreau PD, Esquenazi E, Sandoval-Calderón M, Kersten RD, Pace LA, Quinn RA, Duncan KR, Hsu C-C, Floros DJ, Gavilan RG, Kleigrewe K, Northen T, Dutton RJ, Parrot D, Carlson EE, Aigle B, Michelsen CF, Jelsbak L, Sohlenkamp C, Pevzner P, Edlund A, McLean J, Piel J, Murphy BT, Gerwick L, Liaw C-C, Yang Y-L, Humpf H-U, Maansson M, Keyzers RA, Sims AC, Johnson AR, Sidebottom AM, Sedio BE, Klitgaard A, Larson CB, Boya PCA, Torres-Mendoza D, Gonzalez DJ, Silva DB, Marques LM, Demarque DP, Pociute E, O’Neill EC, Briand E, Helfrich EJN, Granatosky EA, Glukhov E, Ryffel F, Houson H, Mohimani H, Kharbush JJ, Zeng Y, Vorholt JA, Kurita KL, Charusanti P, McPhail KL, Nielsen KF, Vuong L, Elfeki M, Traxler MF, Engene N, Koyama N, Vining OB, Baric R, Silva RR, Mascuch SJ, Tomasi S, Jenkins S, Macherla V, Hoffman T, Agarwal V, Williams PG, Dai J, Neupane R, Gurr J, Rodríguez AMC, Lamsa A, Zhang C, Dorrestein K, Duggan BM, Almaliti J, Allard P-M, Phapale P, Nothias L-F, Alexandrov T, Litaudon M, Wolfender J-L, Kyle JE, Metz TO, Peryea T, Nguyen D-T, VanLeer D, Shinn P, Jadhav A, Müller R, Waters KM, Shi W, Liu X, Zhang L, Knight R, Jensen PR, Palsson BØ, Pogliano K, Linington RG, Gutiérrez M, Lopes NP, Gerwick WH, Moore BS, Dorrestein PC, Bandeira N. Sharing and community curation of mass spectrometry data with global natural products social molecular networking. Nat Biotechnol. 2016;34:828. doi: 10.1038/nbt.3597. [DOI] [PMC free article] [PubMed] [Google Scholar]
- 3.da Silva RR, Dorrestein PC, Quinn RA. Illuminating the dark matter in metabolomics. Proc Natl Acad Sci USA. 2015;112:12549. doi: 10.1073/pnas.1516878112. [DOI] [PMC free article] [PubMed] [Google Scholar]
- 4.Yang JY, Sanchez LM, Rath CM, Liu X, Boudreau PD, Bruns N, Glukhov E, Wodtke A, de Felicio R, Fenner A, Wong WR, Linington RG, Zhang L, Debonsi HM, Gerwick WH, Dorrestein PC. Molecular networking as a dereplication strategy. J Nat Prod. 2013;76:1686–1699. doi: 10.1021/np400413s. [DOI] [PMC free article] [PubMed] [Google Scholar]
- 5.Watrous J, Roach P, Alexandrov T, Heath BS, Yang JY, Kersten RD, van der Voort M, Pogliano K, Gross H, Raaijmakers JM, Moore BS, Laskin J, Bandeira N, Dorrestein PC. Mass spectral molecular networking of living microbial colonies. Proc Natl Acad Sci USA. 2012;109:E1743–E1752. doi: 10.1073/pnas.1203689109. [DOI] [PMC free article] [PubMed] [Google Scholar]
- 6.Dührkop K, Shen H, Meusel M, Rousu J, Böcker S. Searching molecular structure databases with tandem mass spectra using CSI:FingerID. Proc Natl Acad Sci. 2015;112:12580. doi: 10.1073/pnas.1509788112. [DOI] [PMC free article] [PubMed] [Google Scholar]
- 7.Rasche F, Böcker S. Towards de novo identification of metabolites by analyzing tandem mass spectra. Bioinformatics. 2008;24:i49–i55. doi: 10.1093/bioinformatics/btn270. [DOI] [PubMed] [Google Scholar]
- 8.Tsugawa H, Kind T, Nakabayashi R, Yukihira D, Tanaka W, Cajka T, Saito K, Fiehn O, Arita M. Hydrogen rearrangement rules: computational MS/MS fragmentation and structure elucidation using MS-FINDER software. Anal Chem. 2016;88:7946–7958. doi: 10.1021/acs.analchem.6b00770. [DOI] [PMC free article] [PubMed] [Google Scholar]
- 9.Bauer CA, Grimme S. How to compute electron ionization mass spectra from first principles. J Phys Chem A. 2016;120:3755–3766. doi: 10.1021/acs.jpca.6b02907. [DOI] [PubMed] [Google Scholar]
- 10.Grimme S. Towards first principles calculation of electron impact mass spectra of molecules. Angew Chem. 2013;52:6306–6312. doi: 10.1002/anie.201300158. [DOI] [PubMed] [Google Scholar]
- 11.Allen F, Greiner R, Wishart D. Competitive fragmentation modeling of ESI-MS/MS spectra for putative metabolite identification. Metabolomics. 2015;11:98–110. [Google Scholar]
- 12.Wolf S, Schmidt S, Müller-Hannemann M, Neumann S. In silico fragmentation for computer assisted identification of metabolite mass spectra. BMC Bioinform. 2010;11:148. doi: 10.1186/1471-2105-11-148. [DOI] [PMC free article] [PubMed] [Google Scholar]
- 13.Guthals A, Watrous JD, Dorrestein PC, Bandeira N. The spectral networks paradigm in high throughput mass spectrometry. Mol BioSyst. 2012;8:2535–2544. doi: 10.1039/c2mb25085c. [DOI] [PMC free article] [PubMed] [Google Scholar]
- 14.Shannon P, Markiel A, Ozier O, Baliga NS, Wang JT, Ramage D, Amin N, Schwikowski B, Ideker T. Cytoscape: a software environment for integrated models of biomolecular interaction networks. Genome Res. 2003;13:2498–2504. doi: 10.1101/gr.1239303. [DOI] [PMC free article] [PubMed] [Google Scholar]
- 15.Olivon F, Apel C, Retailleau P, Allard PM, Wolfender JL, Touboul D, Roussi F, Litaudon M, Desrat S. Searching for original natural products by molecular networking: detection, isolation and total synthesis of chloroaustralasines. Org Chem Front. 2018;5:2171–2178. [Google Scholar]
- 16.Olivon F, Allard P-M, Koval A, Righi D, Genta-Jouve G, Neyts J, Apel C, Pannecouque C, Nothias L-F, Cachet X, Marcourt L, Roussi F, Katanaev VL, Touboul D, Wolfender J-L, Litaudon M. Bioactive natural products prioritization using massive multi-informational molecular networks. ACS Chem Biol. 2017;12:2644–2651. doi: 10.1021/acschembio.7b00413. [DOI] [PubMed] [Google Scholar]
- 17.Nothias L-F, Nothias-Esposito M, da Silva R, Wang M, Protsyuk I, Zhang Z, Sarvepalli A, Leyssen P, Touboul D, Costa J, Paolini J, Alexandrov T, Litaudon M, Dorrestein PC. Bioactivity-based molecular networking for the discovery of drug leads in natural product bioassay-guided fractionation. J Nat Prod. 2018;81:758–767. doi: 10.1021/acs.jnatprod.7b00737. [DOI] [PubMed] [Google Scholar]
- 18.Kleigrewe K, Almaliti J, Tian IY, Kinnel RB, Korobeynikov A, Monroe EA, Duggan BM, Di Marzo V, Sherman DH, Dorrestein PC, Gerwick L, Gerwick WH. Combining mass spectrometric metabolic profiling with genomic analysis: a powerful approach for discovering natural products from cyanobacteria. J Nat Prod. 2015;78:1671–1682. doi: 10.1021/acs.jnatprod.5b00301. [DOI] [PMC free article] [PubMed] [Google Scholar]
- 19.Duncan Katherine R, Crüsemann M, Lechner A, Sarkar A, Li J, Ziemert N, Wang M, Bandeira N, Moore Bradley S, Dorrestein Pieter C, Jensen Paul R. Molecular networking and pattern-based genome mining improves discovery of biosynthetic gene clusters and their products from Salinispora species. Chem Biol. 2015;22:460–471. doi: 10.1016/j.chembiol.2015.03.010. [DOI] [PMC free article] [PubMed] [Google Scholar]
- 20.Oppong-Danquah E, Parrot D, Blümel M, Labes A, Tasdemir D. Molecular networking-based metabolome and bioactivity analyses of marine-adapted fungi co-cultivated with phytopathogens. Front Microbiol. 2018;9:2072. doi: 10.3389/fmicb.2018.02072. [DOI] [PMC free article] [PubMed] [Google Scholar]
- 21.Elyashberg ME, Williams A, Blinov K. Contemporary computer-assisted approaches to molecular structure elucidation. London: Royal Society of Chemistry; 2012. [Google Scholar]
- 22.Elyashberg M, Williams AJ, Blinov K. Structural revisions of natural products by computer-assisted structure elucidation (CASE) systems. Nat Prod Rep. 2010;27:1296–1328. doi: 10.1039/c002332a. [DOI] [PubMed] [Google Scholar]
- 23.Nuzillard J-M. Automated interpretation of NMR spectra for small organic molecules in solution. eMagRes. 2014;3:1–7. [Google Scholar]
- 24.Foroozandeh M, Morris GA, Nilsson M. PSYCHE pure shift NMR spectroscopy. Chem Eur J. 2018;24:13988–14000. doi: 10.1002/chem.201800524. [DOI] [PubMed] [Google Scholar]
- 25.Zangger K. Pure shift NMR. Prog Nucl Magn Reson Spectrosc. 2015;86–87:1–20. doi: 10.1016/j.pnmrs.2015.02.002. [DOI] [PubMed] [Google Scholar]
- 26.Smurnyy YD, Elyashberg ME, Blinov KA, Lefebvre BA, Martin GE, Williams AJ. Computer-aided determination of relative stereochemistry and 3D models of complex organic molecules from 2D NMR spectra. Tetrahedron. 2005;61:9980–9989. [Google Scholar]
- 27.Troche-Pesqueira E, Anklin C, Gil RR, Navarro-Vázquez A. Computer-assisted 3D structure elucidation of natural products using residual dipolar couplings. Angew Chem. 2017;56:3660–3664. doi: 10.1002/anie.201612454. [DOI] [PubMed] [Google Scholar]
- 28.Navarro-Vázquez A, Gil RR, Blinov K. Computer-assisted 3D structure elucidation (CASE-3D) of natural products combining isotropic and anisotropic NMR parameters. J Nat Prod. 2018;81:203–210. doi: 10.1021/acs.jnatprod.7b00926. [DOI] [PubMed] [Google Scholar]
- 29.Castro SJ, García ME, Padrón JM, Navarro-Vázquez A, Gil RR, Nicotra VE. Phytochemical study of Senecio volckmannii assisted by CASE-3D with residual dipolar couplings and isotropic 1H/13C NMR chemical shifts. J Nat Prod. 2018;81:2329–2337. doi: 10.1021/acs.jnatprod.8b00162. [DOI] [PubMed] [Google Scholar]
- 30.Gayathri C, Tsarevsky NV, Gil RR. Residual dipolar couplings (RDCs) analysis of small molecules made easy: fast and tuneable alignment by reversible compression/relaxation of reusable PMMA gels. Chem Eur J. 2010;16:3622–3626. doi: 10.1002/chem.200903378. [DOI] [PubMed] [Google Scholar]
- 31.Gil-Silva LF, Santamaría-Fernández R, Navarro-Vázquez A, Gil RR. Collection of NMR scalar and residual dipolar couplings using a single experiment. Chem Eur J. 2016;22:472–476. doi: 10.1002/chem.201503449. [DOI] [PubMed] [Google Scholar]
- 32.Li G-W, Liu H, Qiu F, Wang X-J, Lei X-X. Residual dipolar couplings in structure determination of natural products. Nat Prod Bioprospect. 2018;8:279–295. doi: 10.1007/s13659-018-0174-x. [DOI] [PMC free article] [PubMed] [Google Scholar]
- 33.Thiele CM. Residual dipolar couplings (RDCs) in organic structure determination. Eur J Org Chem. 2008;2008:5673–5685. [Google Scholar]
- 34.Thiele CM. Use of RDCs in rigid organic compounds and some practical considerations concerning alignment media. Concept Magn Reson Part A. 2007;30A:65–80. [Google Scholar]
- 35.Liu Y, Saurí J, Mevers E, Peczuh MW, Hiemstra H, Clardy J, Martin GE, Williamson RT. Unequivocal determination of complex molecular structures using anisotropic NMR measurements. Science. 2017;356:eaam5349. doi: 10.1126/science.aam5349. [DOI] [PMC free article] [PubMed] [Google Scholar]
- 36.Nath N, Schmidt M, Gil RR, Williamson RT, Martin GE, Navarro-Vázquez A, Griesinger C, Liu Y. Determination of relative configuration from residual chemical shift anisotropy. J Am Chem Soc. 2016;138:9548–9556. doi: 10.1021/jacs.6b04082. [DOI] [PubMed] [Google Scholar]
- 37.Hallwass F, Schmidt M, Sun H, Mazur A, Kummerlöwe G, Luy B, Navarro-Vázquez A, Griesinger C, Reinscheid UM. Residual chemical shift anisotropy (RCSA): a tool for the analysis of the configuration of small molecules. Angew Chem. 2011;50:9487–9490. doi: 10.1002/anie.201101784. [DOI] [PubMed] [Google Scholar]
- 38.Liu Y, Navarro-Vázquez A, Gil RR, Griesinger C, Martin GE, Williamson RT. Application of anisotropic NMR parameters to the confirmation of molecular structure. Nat Protoc. 2019;14:217–247. doi: 10.1038/s41596-018-0091-9. [DOI] [PubMed] [Google Scholar]
- 39.Goerigk L, Hansen A, Bauer C, Ehrlich S, Najibi A, Grimme S. A look at the density functional theory zoo with the advanced GMTKN55 database for general main group thermochemistry, kinetics and noncovalent interactions. Phys Chem Chem Phys. 2017;19:32184–32215. doi: 10.1039/c7cp04913g. [DOI] [PubMed] [Google Scholar]
- 40.Grimme S, Antony J, Ehrlich S, Krieg H. A consistent and accurate ab initio parametrization of density functional dispersion correction (DFT-D) for the 94 elements H-Pu. J Chem Phys. 2010;132:154104. doi: 10.1063/1.3382344. [DOI] [PubMed] [Google Scholar]
- 41.Grimme S, Ehrlich S, Goerigk L. Effect of the damping function in dispersion corrected density functional theory. J Comput Chem. 2011;32:1456–1465. doi: 10.1002/jcc.21759. [DOI] [PubMed] [Google Scholar]
- 42.Mennucci B, Cancès E, Tomasi J. Evaluation of solvent effects in isotropic and anisotropic dielectrics and in ionic solutions with a unified integral equation method: theoretical bases, computational implementation, and numerical applications. J Phys Chem B. 1997;101:10506–10517. [Google Scholar]
- 43.Cancès E, Mennucci B, Tomasi J. A new integral equation formalism for the polarizable continuum model: theoretical background and applications to isotropic and anisotropic dielectrics. J Chem Phys. 1997;107:3032–3041. [Google Scholar]
- 44.Cancès E, Mennucci B. New applications of integral equations methods for solvation continuum models: ionic solutions and liquid crystals. J Math Chem. 1998;23:309–326. [Google Scholar]
- 45.Klamt A, Schuurmann G. COSMO: a new approach to dielectric screening in solvents with explicit expressions for the screening energy and its gradient. J Chem Soc Perkin Trans. 1993;2:799–805. [Google Scholar]
- 46.Benassi E. Benchmarking of density functionals for a soft but accurate prediction and assignment of 1H and 13C NMR chemical shifts in organic and biological molecules. J Comput Chem. 2017;38:87–92. doi: 10.1002/jcc.24521. [DOI] [PubMed] [Google Scholar]
- 47.Lodewyk MW, Siebert MR, Tantillo DJ. Computational prediction of 1H and 13C chemical shifts: a useful tool for natural product, mechanistic, and synthetic organic chemistry. Chem Rev. 2012;112:1839–1862. doi: 10.1021/cr200106v. [DOI] [PubMed] [Google Scholar]
- 48.Tantillo Group (2017). CHESHIRE CCAT, the chemical shift repository for computed NMR scaling factors, with coupling constants added too. http://cheshirenmr.info/. Accessed 1 Apr 2019
- 49.Sarotti AM, Pellegrinet SC. A Multi-standard approach for GIAO 13C NMR calculations. J Org Chem. 2009;74:7254–7260. doi: 10.1021/jo901234h. [DOI] [PubMed] [Google Scholar]
- 50.Andrews KG, Spivey AC. Improving the accuracy of computed 13C NMR shift predictions by specific environment error correction: fragment referencing. J Org Chem. 2013;78:11302–11317. doi: 10.1021/jo401833b. [DOI] [PubMed] [Google Scholar]
- 51.Sarotti AM, Pellegrinet SC. Application of the multi-standard methodology for calculating 1H NMR chemical shifts. J Org Chem. 2012;77:6059–6065. doi: 10.1021/jo3008447. [DOI] [PubMed] [Google Scholar]
- 52.Hoffmann F, Li D-W, Sebastiani D, Brüschweiler R. Improved quantum chemical NMR chemical shift prediction of metabolites in aqueous solution toward the validation of unknowns. J Phys Chem A. 2017;121:3071–3078. doi: 10.1021/acs.jpca.7b01954. [DOI] [PMC free article] [PubMed] [Google Scholar]
- 53.Smith SG, Goodman JM. Assigning the stereochemistry of pairs of diastereoisomers using GIAO NMR shift calculation. J Org Chem. 2009;74:4597–4607. doi: 10.1021/jo900408d. [DOI] [PubMed] [Google Scholar]
- 54.Smith SG, Goodman JM. Assigning stereochemistry to single diastereoisomers by GIAO NMR calculation: the DP4 probability. J Am Chem Soc. 2010;132:12946–12959. doi: 10.1021/ja105035r. [DOI] [PubMed] [Google Scholar]
- 55.Grimblat N, Zanardi MM, Sarotti AM. Beyond DP4: an improved probability for the stereochemical assignment of isomeric compounds using quantum chemical calculations of NMR shifts. J Org Chem. 2015;80:12526–12534. doi: 10.1021/acs.joc.5b02396. [DOI] [PubMed] [Google Scholar]
- 56.Sarotti AM. Successful combination of computationally inexpensive GIAO 13C NMR calculations and artificial neural network pattern recognition: a new strategy for simple and rapid detection of structural misassignments. Org Biomol Chem. 2013;11:4847–4859. doi: 10.1039/c3ob40843d. [DOI] [PubMed] [Google Scholar]
- 57.Willoughby PH, Jansma MJ, Hoye TR. A guide to small-molecule structure assignment through computation of (1H and 13C) NMR chemical shifts. Nat Protoc. 2014;9:643. doi: 10.1038/nprot.2014.042. [DOI] [PubMed] [Google Scholar]
- 58.Saielli G, Nicolaou KC, Ortiz A, Zhang H, Bagno A. Addressing the stereochemistry of complex organic molecules by density functional Theory-NMR: Vannusal B in retrospective. J Am Chem Soc. 2011;133:6072–6077. doi: 10.1021/ja201108a. [DOI] [PMC free article] [PubMed] [Google Scholar]
- 59.Tarazona G, Benedit G, Fernández R, Pérez M, Rodríguez J, Jiménez C, Cuevas C. Can stereoclusters separated by two methylene groups be related by DFT studies? the case of the cytotoxic meroditerpenes halioxepines. J Nat Prod. 2018;81:343–348. doi: 10.1021/acs.jnatprod.7b00807. [DOI] [PubMed] [Google Scholar]
- 60.Li W-S, Mándi A, Liu J-J, Shen L, Kurtán T, Wu J. Xylomolones A–D from the Thai mangrove Xylocarpus moluccensis: assignment of absolute stereostructures and unveiling a convergent strategy for limonoid biosynthesis. J Org Chem. 2019;84:2596–2606. doi: 10.1021/acs.joc.8b03037. [DOI] [PubMed] [Google Scholar]
- 61.Nugroho AE, Zhang W, Hirasawa Y, Tang Y, Wong CP, Kaneda T, Hadi AHA, Morita H. Bisleuconothines B–D, modified Eburnane-Aspidosperma bisindole alkaloids from Leuconotis griffithii. J Nat Prod. 2018;81:2600–2604. doi: 10.1021/acs.jnatprod.8b00749. [DOI] [PubMed] [Google Scholar]
- 62.Nugroho AE, Hashimoto A, Wong C-P, Yokoe H, Tsubuki M, Kaneda T, Hadi AHA, Morita H. Ceramicines M–P from Chisocheton ceramicus: isolation and structure–activity relationship study. J Nat Med. 2018;72:64–72. doi: 10.1007/s11418-017-1109-2. [DOI] [PMC free article] [PubMed] [Google Scholar]
- 63.Nugroho AE, Okuda M, Yamamoto Y, Hirasawa Y, Wong C-P, Kaneda T, Shirota O, Hadi AHA, Morita H. Walsogynes B–G, limonoids from Walsura chrysogyne. Tetrahedron. 2013;69:4139–4145. [Google Scholar]
- 64.Nugroho AE, Morita H. Circular dichroism calculation for natural products. J Nat Med. 2014;68:1–10. doi: 10.1007/s11418-013-0768-x. [DOI] [PMC free article] [PubMed] [Google Scholar]
- 65.Superchi S, Scafato P, Gorecki M, Pescitelli G. Absolute configuration determination by quantum mechanical calculation of chiroptical spectra: basics and applications to fungal metabolites. Curr Med Chem. 2018;25:287–320. doi: 10.2174/0929867324666170310112009. [DOI] [PubMed] [Google Scholar]
- 66.Pescitelli G, Bruhn T. Good computational practice in the assignment of absolute configurations by TDDFT calculations of ECD spectra. Chirality. 2016;28:466–474. doi: 10.1002/chir.22600. [DOI] [PubMed] [Google Scholar]
- 67.Polavarapu PL. Molecular structure determination using chiroptical spectroscopy: where we may go wrong? Chirality. 2012;24:909–920. doi: 10.1002/chir.22015. [DOI] [PubMed] [Google Scholar]
- 68.He Y, Wang B, Dukor RK, Nafie LA. Determination of absolute configuration of chiral molecules using vibrational optical activity: a review. Appl Spectrosc. 2011;65:699–723. doi: 10.1366/11-06321. [DOI] [PubMed] [Google Scholar]
- 69.Bringmann G, Bruhn T, Maksimenka K, Hemberger Y. The assignment of absolute stereostructures through quantum chemical circular dichroism calculations. Eur J Org Chem. 2009;2009:2717–2727. [Google Scholar]
- 70.Diedrich C, Grimme S. Systematic investigation of modern quantum chemical methods to predict electronic circular dichroism spectra. J Phys Chem A. 2003;107:2524–2539. [Google Scholar]
- 71.Pecul M, Ruud K, Helgaker T. Density functional theory calculation of electronic circular dichroism using London orbitals. Chem Phys Lett. 2004;388:110–119. [Google Scholar]
- 72.Tang Y, Nugroho AE, Hirasawa Y, Tougan T, Horii T, Hadi AHA, Morita H. Leucophyllinines A and B, bisindole alkaloids from Leuconotis eugeniifolia. J Nat Med. 2019 doi: 10.1007/s11418-019-01297-5. [DOI] [PubMed] [Google Scholar]
- 73.Prema Wong CP, Nugroho AE, Awouafack MD, Win YY, Win NN, Ngwe H, Morita H, Morita H. Two new quassinoids and other constituents from Picrasma javanica wood, and their biological activities. J Nat Med. 2019 doi: 10.1007/s11418-018-01279-z. [DOI] [PubMed] [Google Scholar]
- 74.Nugroho AE, Sasaki T, Kaneda T, Hadi AHA, Morita H. Calofolic acids A–F, chromanones from the bark of Calophyllum scriblitifolium with vasorelaxation activity. Bioorg Med Chem Lett. 2017;27:2124–2128. doi: 10.1016/j.bmcl.2017.03.071. [DOI] [PubMed] [Google Scholar]
- 75.Nagakura Y, Nugroho AE, Hirasawa Y, Hosoya T, Rahman A, Kusumawati I, Zaini NC, Morita H. Sanjecumins A and B: new limonoids from Sandoricum koetjape. J Nat Med. 2013;67:381–385. doi: 10.1007/s11418-012-0677-4. [DOI] [PubMed] [Google Scholar]
- 76.He F, Nugroho AE, Wong CP, Hirasawa Y, Shirota O, Morita H, Aisa HA. Rupestines F–M, New guaipyridine sesquiterpene alkaloids from Artemisia rupestris. Chem Pharm Bull. 2012;60:213–218. doi: 10.1248/cpb.60.213. [DOI] [PubMed] [Google Scholar]
- 77.Motegi M, Nugroho AE, Hirasawa Y, Arai T, Hadi AHA, Morita H. Leucomidines A–C, novel alkaloids from Leuconotis griffithii. Tetrahedron Lett. 2012;53:1227–1230. [Google Scholar]
- 78.Najmuldeen IA, Hadi AHA, Awang K, Mohamad K, Ketuly KA, Mukhtar MR, Chong S-L, Chan G, Nafiah MA, Weng NS, Shirota O, Hosoya T, Nugroho AE, Morita H. Chisomicines A–C, Limonoids from Chisocheton ceramicus. J Nat Prod. 2011;74:1313–1317. doi: 10.1021/np200013g. [DOI] [PubMed] [Google Scholar]
- 79.Nugroho AE, Hirasawa Y, Hosoya T, Awang K, Hadi AHA, Morita H. Bisleucocurine A, a novel bisindole alkaloid from Leuconotis griffithii. Tetrahedron Lett. 2010;51:2589–2592. [Google Scholar]
- 80.Hirasawa Y, Hara M, Nugroho AE, Sugai M, Zaima K, Kawahara N, Goda Y, Awang K, Hadi AHA, Litaudon M, Morita H. Bisnicalaterines B and C, atropisomeric bisindole alkaloids from Hunteria zeylanica, showing Vasorelaxant activity. J Org Chem. 2010;75:4218–4223. doi: 10.1021/jo1006762. [DOI] [PubMed] [Google Scholar]
- 81.Deguchi J, Shoji T, Nugroho AE, Hirasawa Y, Hosoya T, Shirota O, Awang K, Hadi AHA, Morita H. Eucophylline, a tetracyclic vinylquinoline alkaloid from Leuconotis eugenifolius. J Nat Prod. 2010;73:1727–1729. doi: 10.1021/np100458b. [DOI] [PubMed] [Google Scholar]
- 82.Zou Y, Wang X, Sims J, Wang B, Pandey P, Welsh CL, Stone RP, Avery MA, Doerksen RJ, Ferreira D, Anklin C, Valeriote FA, Kelly M, Hamann MT. Computationally Assisted discovery and assignment of a highly strained and PANC-1 selective alkaloid from Alaska’s deep ocean. J Am Chem Soc. 2019;141:4338–4344. doi: 10.1021/jacs.8b11403. [DOI] [PMC free article] [PubMed] [Google Scholar]
- 83.McAlpine JB, Chen S-N, Kutateladze A, MacMillan JB, Appendino G, Barison A, Beniddir MA, Biavatti MW, Bluml S, Boufridi A, Butler MS, Capon RJ, Choi YH, Coppage D, Crews P, Crimmins MT, Csete M, Dewapriya P, Egan JM, Garson MJ, Genta-Jouve G, Gerwick WH, Gross H, Harper MK, Hermanto P, Hook JM, Hunter L, Jeannerat D, Ji N-Y, Johnson TA, Kingston DGI, Koshino H, Lee H-W, Lewin G, Li J, Linington RG, Liu M, McPhail KL, Molinski TF, Moore BS, Nam J-W, Neupane RP, Niemitz M, Nuzillard J-M, Oberlies NH, Ocampos FMM, Pan G, Quinn RJ, Reddy DS, Renault J-H, Rivera-Chávez J, Robien W, Saunders CM, Schmidt TJ, Seger C, Shen B, Steinbeck C, Stuppner H, Sturm S, Taglialatela-Scafati O, Tantillo DJ, Verpoorte R, Wang B-G, Williams CM, Williams PG, Wist J, Yue J-M, Zhang C, Xu Z, Simmler C, Lankin DC, Bisson J, Pauli GF. The value of universally available raw NMR data for transparency, reproducibility, and integrity in natural product research. Nat Prod Rep. 2019;36:35–107. doi: 10.1039/c7np00064b. [DOI] [PMC free article] [PubMed] [Google Scholar]