

Abstract
Background
Recent non-invasive 3D photography method has been applied to facial analysis, offering numerous advantages in orthodontic. The purpose of this study was to analyze the faces of a sample of healthy European adults from southern Spain with normal occlusion in order to establish reference facial soft tissue anthropometric parameters in this specific geographic-ethnic population, as well as to analyze sexual dimorphism.
Methods
A sample of 100 healthy adult volunteers consisting of 50 women (mean age, 22.92 ± 1.56 years) and 50 men (mean age, 22.37 ± 2.12 years) were enrolled in this study. All participants had normal occlusion, skeletal Class I, mesofacial pattern, and healthy body mass index. Three-dimensional photographs of the faces were captured non-invasively using Planmeca ProMax 3D ProFace®. Thirty landmarks related to the face, eyes, nose, and orolabial and chin areas were identified.
Results
Male displayed higher values in all vertical and transversal dimensions, with the exception of the lower lip height. Larger differences between sexes were observed in face, mandible, and nose. Male also had higher values in the angular measurements which referred to the nose. No sex differences were found in transverse upper lip prominence or transverse mandibular prominence. No differences were found in the ratio measurements, with the exception of intercantal width/nasal width, which was higher in women than in men.
Conclusions
Reference anthropometric measurements of facial soft tissues have been established in European adults from southern Spain with normal occlusion. Significant sexual dimorphism was found, with remarkable differences in size between sexes
Electronic supplementary material
The online version of this article (10.1186/s12903-019-0898-y) contains supplementary material, which is available to authorized users.
Keywords: 3D photography, Face, Soft tissues, Anthropometry, Morphometrics, Reference values
Background
Analysis of both hard and soft facial tissues is used in orthodontic diagnoses. Until recently, classical orthodontics considered the study of hard tissues and cephalometric measurements of upper and lower jaws and the teeth as more relevant. These measurements have thus been the most used diagnostic tools in orthodontics [1, 2]. Nevertheless, facial soft tissue morphology has gained increasing interest among clinicians. In fact, currently, orthodontic and maxillofacial surgery diagnoses are not made without the inclusion of specific soft tissue measurements. In addition, lay people (patients and their friends and relatives) asses the success of orthodontic and orthognatic surgery treatments based on perceived visual facial changes [3]. Therefore, a complete three-dimensional (3D) assessment of facial soft tissue shape, size, and proportions should be included as a fundamental step in orthodontic diagnoses, assessment of facial deformities, maxillofacial surgery planning, and evaluation of treatment results [4].
Currently, detailed facial soft tissue examinations can be carried out using 3D radiographic techniques, such as computed tomography, or cone-beam computed tomography (CBCT), which is preferable due to the use of lower radiation doses [5]. Anthropometric facial features can also be analyzed using non-invasive 3D X-ray-free systems, such as laser surface scanning, multi-image photogrammetry, stereo-photogrammetry, or recent 3D facial photography techniques. These new methods offer numerous advantages, including speed of data collection, feasibility of data storage and handling, accuracy, and reliability [6–11].
Reference normative values for specific races and ethnic groups have thus become absolutely necessary [12], as there are remarkable variations between different populations and groups [13]. Some studies have provided reference anthropometric facial data acquired using stereo-photogrammetry or photography from Chinese [4], Korean [14], Malay [15], and Turkish [16] adults. No 3D facial data are available from southern European adult populations
We used a recent non-invasive 3D photography method to analyze the faces of a sample of healthy European adults from southern Spain with normal occlusion. The main aims were to establish standards for facial soft tissue anthropometric parameters in this specific geographic-ethnic population, as well as to analyze sexual dimorphism. We also compared our findings to morphological features of other similarly studied populations.
Methods
A sample of 100 healthy adult volunteers consisting of 50 women (mean age, 22.92 ± 1.56 years) and 50 men (mean age, 22.37 ± 2.12 years) were enrolled in this study. The inclusion criteria were as follows: 1) European ethnicity, specifically that from Granada in southern Spain. Information regarding ethnicity and geographic origin was obtained using a self-administered questionnaire, which included questions regarding the participants and their parents and grandparents; 2) age between 20 and 30 years; 3) normal occlusion classified as skeletal Class I (based on ANB angle: 0–4°, as measured on a lateral cephalogram), mesofacial growth pattern (according to the Frankfort horizontal-to-mandibular plane angle: 20–28° on a lateral cephalogram), and dental angle Class I; 4) lip competence; and 5) healthy body mass index (18–25 kg/m2). The exclusion criteria were 1) craniofacial anomalies; 2) previous or current orthopedic, orthodontic, maxillofacial, or aesthetic surgery treatment; 3) nasal or facial disfigurement, deformity, asymmetry, or surgery; 4) history of facial trauma; and 5) any type of cosmetic facial aesthetic procedure. The sample size was determined using the 3.1.2 version of PS: Power and Sample Size Calculation® according to previously described methods [4, 17].
Participants volunteered for the study after a detailed explanation of the protocol and agreed to participate by signing an ethics committee-approved informed consent form.
Three-dimensional image capture, methods, and measurements
Three-dimensional photography of the faces was carried out using Planmeca ProMax 3D ProFace® (Planmeca USA, Inc.; Roselle, IL, USA), which produces a realistic 3D picture of the face (Fig. 1). Photographs were recorded using the ProFace option, which requires no radiation. The system is based on lasers that scan facial geometry and a few digital cameras, which capture texture and color. The sensor components consist of two lights, a laser, two digital cameras, and two light-emitting diodes. The spatial accuracy of this device is 0.03 mm (as reported by the manufacturer). The 3D photographs were processed using Planmeca Romexis® software, which facilitated accurate and detailed operation.
Fig. 1.
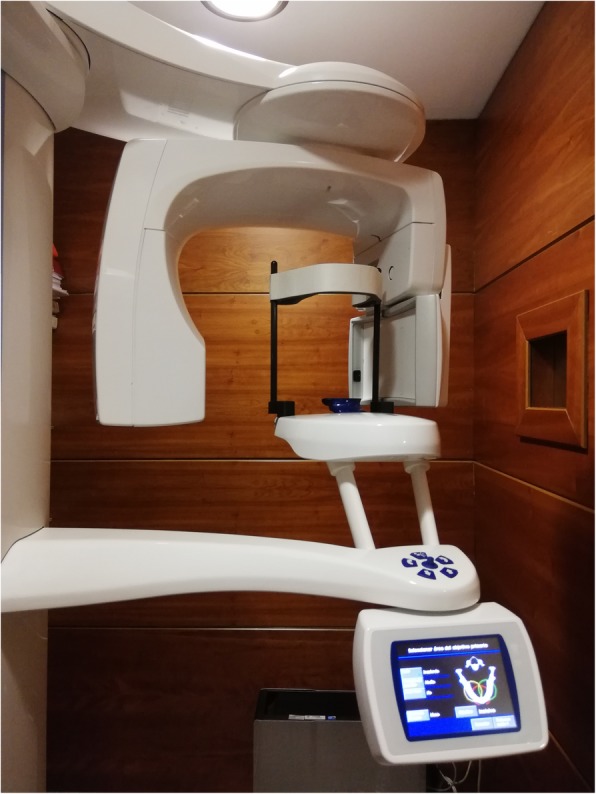
Three-dimensional photography device
Subjects were instructed not to wear heavy makeup 2 days prior to the scan. They were also instructed to shave and remove their glasses at least 2 h prior to 3D photography. During the image capture, the participant was with the head in a natural position, a neutral facial expression, the mandible in a resting position, and the lips lightly opposed without undue muscular effort.
Thirty soft tissue anthropometric landmarks related to the face, eyes, nose, and orolabial and chin areas (Fig. 2), based on those suggested by Farkas [18] and Mulliken et al. [19], were identified. The points were recorded manually using Nemotec Arnetts FAB Software®, version 10.0 (Software Nemotec SL; Madrid, Spain).
Fig. 2.
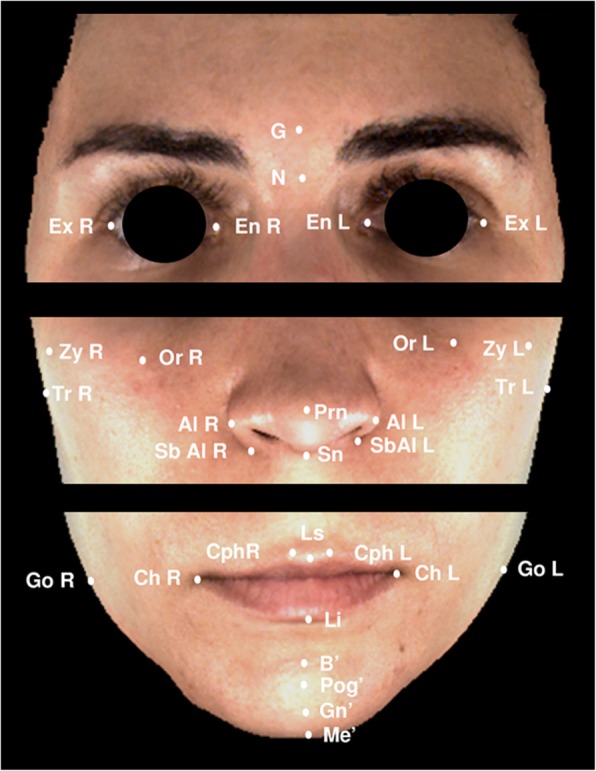
Soft tissue landmarks. N (soft-tissue nasion); G (glabella); Prn (pronasale); Sn (subnasale); Ls (labrale superius); Li (labrale inferius); B (soft-tissue B point); Pg (soft-tissue pogonion); Me (soft-tissue menton); En (endocanthion, R-Right and L-Left); Ex (exocanthion; R-Right and L-Left); Or (orbitale, R-Right and L-Left); Al (alare, R-Right and L-Left); SbAl (subalare, R-Right and L-Left); Cph (christa philtri, R-Right and L-Left) Ch (cheilion, R-Right and L-Left); Zy (zygomatic point, R-Right and L-Left); Go (soft-tissue gonion, R-Right and L-Left); and Tr (tragus, R-Right and L-Left)
Nineteen linear and 7 angular measurements were used to assess facial anthropometric morphological features, and 12 facial ratios were derived from the linear measurements (Table 1).
Table 1.
Facial soft tissue anthropometric measurements
| Measurements | |
|---|---|
| Face (mm) | |
| Face height | N-Me |
| Lower face height | Sn-Me |
| Middle facial width | Tr R- TrL |
| Facial width | ZyR- ZyL |
| Mandible width | GoR- GoL |
| Right mandibular body length | GoR-Me |
| Left mandibular body length | GoL-Me |
| Nose (mm) | |
| Nose height | N-Sn |
| Nasal bridge length | N-Prn |
| Nasal width | AlR- AlL |
| Alar base root width | SbAlR- SbAl L |
| Ocular (mm) | |
| Biocular width | ExR- ExL |
| Intercantal width | EnR- EnL |
| Biorbitale width | OrR- OrL |
| Orolabial (mm) | |
| Vermillion height | Ls-Li |
| Mouth width | ChR-ChL |
| Philtrum width | CphR-CphL |
| lower lip height | Li-B |
| Chin (mm) | |
| Chin height | Li-Me |
| B-Pg | |
| Pg-Me | |
| Angular measurements (°) | |
| Nasolabial angle | G-N-Prn |
| Nasomental angle | N-Prn-Pg |
| Transverse nasal prominence | Zy R-Prn-ZyL |
| Transverse upper lip prominence | ChR-Ls-Ch |
| Transverse mandibular prominence | GoR-Pg-GoL |
| Ratio measurements | |
| Upper face height/mandibular width | N-Sn / GoR-GoL |
| Lower face height/mandibular width | Sn-Me / GoR-GoL |
| Anterior face height/mandibular width | N-Me/ GoR-GoL |
| Anterior face height/facial width | N-Me / ZyR-ZyL |
| Intercantal width/nasal width | EnR-EnL / AlR-AlL |
| Vermilion height/mouth width | Ls-Li / ChR-ChL |
| Chin height/right mandibular body length | Li-Me / GoR-Me |
| Chin height/left mandibular body length | Li-Me / GoL-Me |
| Nose height/lower face height | N-Sn / SnMe |
| Nose height/facial width | N-Sn / ZyR-ZyL |
| Mouth width/intercantal width | ChR-ChL / EnR-EnL |
| Mandible width/biocular width | GoR-GoL / ExR-ExL |
Statistical analysis
Statistical analyses were performed using Statistical Package for the Social Sciences version 22.0 (Chicago, IL, USA). Descriptive statistics (mean, standard deviation, and standard error of the mean) for each measurement were computed for each sex. Sex differences were tested using Student’s t tests. Mann-Whitney U tests were used for measurements with non-normal data. Additional file 1: Table S1 includes all data generated or analyzed during this study (Additional file 1).
Reliability of measurements of the 3D imaging capture system used was tested using the method of moments [20]. Twenty linear measurements were made directly over the faces of 10 randomly selected participants (5 women and 5 men) using an electronic caliper (Ratio®). These measurements were then compared to those made indirectly over the 3D images captured from the same participants.
All images were scored by a single experienced observer (MLM). To test for intra-observer reliability, 10 randomly selected images (5 women and 5 men) were scored again after a two-week period. To test for inter-observer reliability, the same 10 randomly selected images were scored by another independent expert (MMN). Inter- and intra-rater agreements were calculated using intra-class correlation coefficients (ICCs).
Results
The reliability measurements of the 3D images captured by the system indicated a mean reproducibility of 1.04 mm, which is considered adequate for clinical applications [10]. The inter-examiner ICC value was 0.83 (IC 0.61–0.92). The intra-examiner ICC scores ranged from 0.51 (N-Me / ZyR-ZyL) to 0.99 (ChR-ChL / EnR-EnL); the mean ICC score for all of the variables included in the study was 0.84 (IC 0.67–0.99), with 79% of variables having ICC scores > 0.7, which is considered good agreement [21].
Table 2 shows the means, standard deviations, mean differences, and comparisons between male and female subjects for all of the morphological facial variables included in the study. A statistically significant difference was found between male and female subjects in 23 of our 38 measurements. The most prominent differences between the sexes were observed in the measurements obtained from the face region.
Table 2.
Means, standard deviations, mean differences, and p-values for facial morphologic value differences between male and female subjects
| Measurements | Male | Female | Mean difference (95% CI) |
p value |
|---|---|---|---|---|
| Mean (SD) | Mean (SD) | |||
| Face (mm) | ||||
| Face height | 120.40 (8.22) | 119.69 (4.25) | 3.48 (0.20; 6.75) | 0.038* |
| Lower face height | 66.77 (8.05) | 65.99 (4.22) | 2.77 (−0.46; 6.00) | 0.003** |
| Middle facial width | 134.97 (5.44) | 128.22 (6.37) | 9.04 (6.49; 11.60) | 0.000*** |
| Facial width | 114.42 (4.63) | 110.73 (5.06) | 7.39 (4.23; 10.55) | 0.000*** |
| Mandible width | 113.52 (6.23) | 107.58 (7.51) | 6.91 (2.80; 11.01) | 0.001*** |
| Right mandibular body length | 92.56 (13.33) | 83.48 (7.45) | 7.74 (1.78; 13.70) | 0.002** |
| Left mandibular body length | 92.48 (13.96) | 83.97 (6.89) | 7.12 (1.05; 13.18) | 0.008** |
| Nose (mm) | ||||
| Nose height | 56.94 (4.45) | 56.17 (2.83) | 1.58 (0.01; 3.15) | 0.049* |
| Nasal bridge length | 48.35 (4.76) | 47.56 (2.97) | 1.97 (0.04; 3.52) | 0.012* |
| Nasal width | 36.62 (3.28) | 31.15 (2.21) | 5.23 (3.97; 6.50) | 0.000*** |
| Alar base root width | 23.17 (6.07) | 20.17 (3.85) | 3.20 (1.25; 5.15) | 0.002** |
| Ocular (mm) | ||||
| Biocular width | 90.40 (4.68) | 86.58 (3.20) | 4.83 (3.14; 6.53) | 0.000*** |
| Intercantal width | 32.52 (4.52) | 31.38 (2.78) | 2.27 (0.56; 3.98 | 0.010** |
| Biorbitale width | 76.06 (4.79) | 71.97 (4.62) | 4.53 (2.60; 6.45) | 0.000*** |
| Orolabial (mm) | ||||
| Vermilion height | 13.07 (3.75) | 11.83 (2.45) | 1.52 (0.34; 2.70) | 0.040* |
| Mouth width | 51.11 (4.77) | 47.34 (3.65) | 4.21 (2.26; 6.17) | 0.000*** |
| Philtrum width | 10.62 (2.43) | 9.29 (1.95) | 1.73 (0.82; 2.64 | 0.000*** |
| lower lip height | 20.25 (3.20) | 19.32 (3.69) | 1.95 (−1.19; 2.59) | 0.695 |
| Chin (mm) | ||||
| Chin height | 39.07 (7.01) | 38.14 (3.68) | 2.06 (−0.82; 4.95) | 0.004** |
| B-Pg | 6.61 (2.34) | 5.69 (1.70) | 1.57 (0.37; 2.76) | 0.011* |
| Pg-Me | 12.91 (3.22) | 12.08 (2.98) | 1.77 (0.42; 3.11) | 0.011* |
| Angular measurements (°) | ||||
| Nasolabial angle | 28.22 (4.32) | 24.26 (4.30) | 3.92 (1.89; 5.95) | 0.000*** |
| Nasomental angle | 30.77 (4.00) | 28.62 (3.20) | 1.94 (0.54; 3.35) | 0.000*** |
| Transverse nasal prominence | 43.82 (2.08) | 41.64 (2.63) | 2.76 (1.50; 4.01) | 0.000*** |
| Transverse upper lip prominence | 35.82 (8.71) | 35.53 (3.49) | 0.63 (−0.86; 2.08) | 0.402 |
| Transverse mandibular prominence | 50.62 (3.61) | 49.91 (4.20) | 1.22 (−0.41; 2.85 | 0.142 |
| Ratio measurements | ||||
| Upper face height/mandibular width | 0.50 (0.05) | 0,53 (0.05) | −0.02 (− 0.05; 0.00) | 0.081 |
| Lower face height/mandibular width | 0.59 (0.08) | 0.62 (0.06) | −0.01 (− 0.06; 0.03) | 0.784 |
| Anterior face height/mandibular width | 1,06 (0,09) | 1.12 (0.09) | −0.04 (− 0.95; 0.01) | 0.140 |
| Anterior face height/facial width | 1.05 (0.08) | 1.08 (0.05) | −0.03 (− 0.07; 0.00) | 0.055 |
| Intercantal width/nasal width | 0.89 (0.13) | 1.01 (0.11) | − 0.08 (− 0.14; − 0.02) | 0.008** |
| Vermilion height/mouth width | 0.26 (0.08) | 0.25 (0.06) | 0.01 (− 0.01; 0.03) | 0.424 |
| Chin height/right mandibular body length | 0.42 (0.08) | 0.45 (0.07) | −0.02 (− 0.07; 0.02) | 0.207 |
| Chin height/left mandibular body length | 0.43 (0.09) | 0.46 (0.06) | −0.02 (− 0.06; 0.03) | 0.332 |
| Nose height/lower face height | 0.87 (0.18) | 0.86 (0.08) | 0.01 (− 0.06; 0.07) | 0.175 |
| Nose height/facial width | 0.50 (0.05) | 0.51 (0.03) | −0.02 (− 0.03; 0.00) | 0.063 |
| Mouth width/intercantal width | 1.59 (0.21) | 1.52 (1.18) | 0.01 (−0.11; 0.12) | 0.859 |
| Mandible width/biocular width | 1.26 (0.08) | 1.24 (0.09) | 0.15 (−0.03; 0.06) | 0.541 |
*p < 0.05; **p < 0.01; ***p < 0.001
Face
The male subjects had longer and mostly wider faces than the women. The largest differences were found in the transversal plane, mainly in middle facial width (134.97 ± 5.44 mm in men vs. 128.22 ± 6.37 mm in women) and in facial width (114.42 ± 4.63 mm in men vs. 110.73 ± 5.06 mm in women) (p < 0.001). Mandibles were also wider in men than in women, with higher values for mandible width (mean difference, 6.91 mm), and right (mean difference, 7.74 mm) and left (mean difference, 7.12 mm) mandibular body lengths.
Nose
All measurements (nose height, nasal bridge length, nasal width, and alar base root width) for the nose were significantly larger in men than in women. Larger differences were again found in the transversal dimension (nasal width and alar base root width), with wider noses in men than in women (mean differences, 5.23 and 3.20 mm, respectively).
Ocular region
The 3 variables used to analyze the ocular region were larger in men than in women. We observed especially large differences in biocular width (90.40 ± 4.68 mm vs. 86.58 ± 3.20 mm) and biorbitale width (76.06 ± 4.79 mm vs. 71.97 ± 4.62 mm).
Orolabial region
Vermilion height, mouth width, and philtrum width were significantly larger in men than in women. No statistically significant sex difference was found in lower lip height.
Chin
All evaluated chin measurements were significantly larger in men than in women, with a large difference in chin height (39.07 ± 7.01 mm vs. 38.14 ± 3.68 mm).
Angular measurements
Significant sex differences in angular measurements were found in the nose region (nasolabial angle, nasomental angle, and transverse nasal prominence) (p < 0.001). Transverse upper lip prominence and transverse mandibular prominence were similar in both sexes.
Ratio measurements
We found no significant sex differences in ratio measurements, with the exception of the intercantal width to nasal width ratio, which was higher in women than in men (p < 0.01).
Discussion
In spite of the recent increase in the relevance of soft tissue facial analysis, there is an absence of reference values for some races, ethnicities, and geographic population groups. These data are required to determine deviations from standard measurements. We used a recent non-invasive 3D photography method to analyze the faces of a sample of healthy European adults with normal occlusion from southern Spain. We established anthropometric facial soft tissue reference values for this specific geographic-ethnic population. We also investigated differences between the sexes in this population.
We found clear sexual dimorphism, with statistically significant differences between male and female subjects in most facial variables that were analyzed. The male subjects had higher values in all vertical and transversal dimensions, with the exception of lower lip height, which was similar in the two groups. The male subjects also had higher values in the angular measurements of the nose. No sex differences were found in transverse upper lip prominence or transverse mandibular prominence. Only one statistically significant sex difference was found in the ratio measurements (intercantal width/nasal width, which was higher in women than in men). The rest of the measured ratios were similar in both sexes.
Planmeca ProFace™, which was used to capture facial soft tissue characteristics, generates 3D photos in one imaging session while the patient position, facial expression, and muscle position remain unchanged. This leads to the production of images that are perfectly compatible (technical information provided on the company website) (http://www.planmeca.com/Imaging/3D-imaging/Planmeca-ProFace/). The reliability of the measurements produced by the 3D imaging capture system used was tested using the method of moments. Specifically, we compared the direct measurements (those made over the face of the patient using an electronic caliper) with the same measurements made indirectly (over the 3D images captured using Planmeca ProMax 3D ProFace® [Planmeca USA, Inc.; Roselle, IL, USA]) using the same randomly selected participants. The results indicated adequate reproducibility (mean, 1.04 mm) [10].
The 3D photography method offers many advantages over conventional (non-3D) photography, including accurate 3D images and reliability to perform facial analysis. Nevertheless, a more sophisticated device and software are required.
In our population, which consisted of European adults from southern Spain, prominent sex differences were observed in measurements of the face, mandible, and nose. These measurements were significantly larger in men than in women.
In our study, the male subjects had longer and wider faces than the female subjects. Similar results were found by Baik et al. in Korean adults [14] and by Ozdemir et al. in Turkish young adults [16]. Othman et al. also described longer faces in men than in women in a Malaysian population, although they did not include facial width measurements [15]. There are also differences between populations: Korean men have slightly longer faces than Europeans from southern Spain (face height, N-Me, 121.42 ± 6.03 mm vs. 120.40 ± 8.22 mm), while women from southern Spain have longer faces than Korean women (119.69 ± 69 mm vs. 114.41 ± 5.89 mm). Sexual dimorphism in face height was more prominent in the Korean population [14]. Our results are not comparable with those obtained in Turkish [16] or Malaysian [15] populations. This is because, in those studies, the authors considered face height as the distance from N to Gn, although they also found higher sexual dimorphism than we did. Sexual dimorphism has also been reported in a Chinese population [4], although the different methodology used makes it difficult to compare the Chinese study to ours.
Mandible width and right and left mandibular body length were also significantly larger in men than in women in our southern European sample. Similar results were found in Turkish and Korean adults, with wider mandibles in men than in women. Inter-group differences can be observed when comparing populations: Koreans men and women have the widest mandibles (measured from right to left gonion) (127.38 ± 7.43 mm in men and 118.01 ± 7.41 mm in women). They are followed by the Turkish (116.3 ± 1.26 mm in men and 110.2 ± 1.65 mm in women) and the southern Europeans in our study, who had the smallest mandible width (113.52 ± 6.23 mm in men and 107.58 ± 7.51 mm in women). These inter and intra-population differences in face and mandible size and shape may be attributed to several factors, including genetic or environmental factors, as suggested by paleo-anthropology studies [22–26].
In our study, all the measurements of the nose had larger values in men than in women. This was especially true of nasal width, which had a mean difference of 5.23 mm. Sexual dimorphism in nose dimensions had also been described in Malaysian adults. Malaysian men have generally longer and more prominent noses. In addition, nose height and nasal bridge length are significantly in Malaysian men (mean differences of 4.93 mm and 5.73 mm, respectively) [15]. Baik et al. [14] also found longer and more prominent noses in men than in women. In contrast, Ozdemir et al. [16] did not find sexual dimorphism in the height of the nose, the length of the nasal bridge, or the nasal root width in Turkish adults. Our southern European population had narrower noses (nasal width: 36.62 ± 3.28 mm in men and 31.15 ± 2.21 mm in women) than other racial and ethnic groups [14–16, 27–29]. In contrast, the nose height was had higher values in our group (56.94 ± 4.45 mm in men and 56.17 ± 2.83 mm in women) than in Malaysian (54.13 ± 3.61 mm in men and 49.20 mm in women) [15], Chinese (50.15 ± 4.16 mm in men and 46.93 ± 3.3 mm in women) [30], Turkish (51.9 ± 0.75 mm in men and 51.7 ± 0.58 mm in women) [16], and Korean (53.26 ± 3.46 mm in men and 48.4 ± 4.52 mm in women) [14] populations. Our results were similar to those found in white northern Italians (57.43 ± 3.93 mm in men and 54.07 ± 3.68 mm in women) [27]. A proposed explanation for sexual differences in nose dimensions is that men have higher daily energy expenditure, greater respiratory air consumption, and different body composition [22, 31].
Sexual dimorphism was also found in the ocular region in our population, with significantly higher values in men than in women for all variables analyzed. Major differences were found in biocular width (mean difference, 4.83 mm) and biorbitale width (mean difference, 4.53 mm). In the study by Othman et al. [15], only biocular width (mean difference, 4.14 mm) was significantly larger in Malay men than in Malay women. Although the main differences in biocular width were quite similar in both studies, the Malaysian subjects had higher values for both men (96.19 ± 4.64 mm) and women (92.05 ± 3.22 mm) than those found in our southern European sample (90.40 ± 4.68 mm in men and 86.58 ± 3.20 mm in women). No sexual dimorphism was found in a Korean population [14], although the linear distance ExR-ExL (what is referred to as ‘upper face width’) was even higher (106.75 ± 6.13 mm in men and 104.98 ± 5.47 mm in women) in that population. There are thus large differences in the ocular area between races and ethnic groups.
All of the measurements in the orolabial were significantly larger in men than in women, with the remarkable exception of lower lip height, which did not display a significant sex difference. Similarly, no sexual dimorphism was found in the lower vermilion height in a Turkish population [16]. In our sample, philtrum width (10.62 ± 2.43 mm in men and 9.29 ± 1.95 mm in women) and mouth width (51.11 ± 4.77 mm in men and 47.34 ± 3.65 mm in women) values were similar to those found by Othman et al. [15] in Malaysians (11.84 ± 1.90 mm in men and 10.40 ± 1.14 mm in women, and 50.83 ± 3.75 mm in men and 48.00 ± 2.61 mm in women, respectively). The above authors, however, found smaller differences in mouth width between sexes (2.83 mm vs. 4.21 mm in our study). Turkish [16] and Korean [14] subjects have wider philtrums in both sexes. The widest mouths are found in white northern Italians [27] (55.71 ± 3.81 mm in men and 50.84 ± 3.83 mm in women). The narrowest mouths are found in Turks [16] (47.1 ± 0.54 mm in men and 44 ± 0.31 mm in women).
Angular and ratio measurements are difficult to compare among the published studies due to the different methodologies and variables that have been considered. In our population, nasolabial, nasomental, and transverse nasal prominence angles were significantly larger in men than in women. In contrast, transverse upper lip prominence and transverse mandibular prominence did not show sexual dimorphism. Thus, there were significant sex differences in the angular measurements of the nose between the sexes. Baik et al. [14] also did not find significant sex differences in angular measurements, with the exception of the nasal frontal angle and the transverse nasal prominence, in a Korean population. Othman et al. [15] did not find clinically significant differences between the sexes in angular and ratio measurements in Malaysians.
Among the ratio measurements in our study, only the intercantal width/nasal width ratio was significantly different between the sexes, with higher ratios in women (1.01 ± 0.11) than men (0.89 ± 0.13). In contrast, Baik et al. [14] found significant sex differences in the ratio of anterior facial height to the interzygomatic distance and that of forehead height to forehead width. However, the ratio of facial height to upper facial height relative to mandibular width was similar in both sexes, which is consistent with our study. These results suggest that there are larger differences in the sizes, rather than the shapes, of faces between men and women. The comparisons and differences with other populations reported in our study should be interpreted with caution due to the different systems used for facial evaluation, as well as in the different variables used to analyze anthropometric facial features.
Conclusions
Here we establish reference anthropometric measurements of facial soft tissues in European adults from southern Spain with normal occlusion using non-invasive 3D photography. Most of the parameters had significant sexual dimorphism. Men had higher values in all vertical and transversal dimensions, with the exception of lower lip height, which was similar in the two groups. The greatest differences between sexes were observed in measurements obtained from the face, mandible, and nose, which were significantly larger in men than in women. However, only one statistically significant sex difference was found in the ratio measurements (intercantal width/nasal width, which was higher in women than in men).
Additional file
Variables data generated or analyzed during this study. (XLSX 51 kb)
Acknowledgments
The authors are grateful to Dr. Conchita Martín, for her contribution of the statistical analysis.
Abbreviations
- 3D
Three dimensional
- Al
Alare
- B
B point
- CBCT
Cone-beam computed tomography
- Ch
Cheilion
- Cph
Christa philtri
- En
Endocanthion
- Ex
Exocanthion
- G
Glabela
- Go
Gonion
- ICCs
Intra-class correlation coefficients
- L
Left
- Li
Labrale inferious
- Ls
Labrale superious
- Me
Menton
- N
Nasion
- Or
Orbitale
- Pg
Pogonion
- Prn
Pronasale
- R
Right
- SbAl
Subalare
- Sn
Subnasale
- Tr
Tragus
- Zy
Zygomatic point
Author contributions
Conceptualization: MLMLM, JCC, JCPF, JAA, CML, and MMN. Data curation: LMLM, CML, and MMN. Formal analysis: MLMLM, JCC, JCPF, JAA, CML, and MMN. Investigation: MLMLM and MMN. Methodology: MLMLM, JCC, JCPF, JAA, CML,and MMN. Project administration: MLMLM and MMN. Resources: JCC, JCPF, JAA, and CML. Supervision: MLMLM and MMN. Validation: MLMLM, JCC, JCPF, JAA, CML, and MMN. Visualization: MLMLM, JCC, JCPF, and MMN. Writing original draft: MLMLM, JAA, and MMN. Writing review & editing: MLMLM, JCC, JCPF, JAA, CML, and MMN. All authors have read and approved the manuscript.
Funding
Not applicable.
Availability of data and materials
All data generated or analysed during this study are included in this published article and its supplementary information files.
Ethics approval and consent to participate
Approval for this cross-sectional study was obtained from the University of Granada Ethics Committee (reference number 319/CEIH/2017). The study was ethically approved by the Institution, the procedures were in accordance with the declaration of Helsinki and all the subjects signed a consent form.
Consent for publication
Written informed consent to publish individual person’s data (images) were obtained.
Competing interests
The authors declare that they have no competing interests.
Footnotes
Publisher’s Note
Springer Nature remains neutral with regard to jurisdictional claims in published maps and institutional affiliations.
References
- 1.Ricketts RM. Perspectives in the clinical application of cephalometrics. The first fifty years. Angle Orthod. 1981;51:115–150. doi: 10.1043/0003-3219(1981)051<0115:PITCAO>2.0.CO;2. [DOI] [PubMed] [Google Scholar]
- 2.Tzou CH, Frey M. Evolution of 3D surface imaging systems in facial plastic surgery. Facial Plast Surg Clin North Am. 2011;19:591–602. doi: 10.1016/j.fsc.2011.07.003. [DOI] [PubMed] [Google Scholar]
- 3.Bishara SE, Cummins DM, Jorgensen GJ, Jakobsen JR. A computer assisted photogrammetric analysis of soft tissue changes after orthodontic treatment. Part I: methodology and reliability. Am J Orthod Dentofac Orthop. 1995;107:633–639. doi: 10.1016/S0889-5406(95)70107-9. [DOI] [PubMed] [Google Scholar]
- 4.Dong Y, Zhao Y, Bai S, Wu G, Zhou L, Wang B. Three-dimensional anthropometric analysis of chinese faces and its application in evaluating facial deformity. J Oral Maxillofac Surg. 2011;69:1195–1206. doi: 10.1016/j.joms.2010.05.023. [DOI] [PubMed] [Google Scholar]
- 5.Karatas OH, Toy E. Three-dimensional imaging techniques: a literature review. Eur J Dent. 2014;8:132–140. doi: 10.4103/1305-7456.126269. [DOI] [PMC free article] [PubMed] [Google Scholar]
- 6.Deli R, Gioia ED, Galantucci LM, Percoco G. Accurate facial morphologic measurements using a 3-camera photogrammetric method. J Craniofac Surg. 2011;22:54–59. doi: 10.1097/SCS.0b013e3181f6c4a1. [DOI] [PubMed] [Google Scholar]
- 7.Plooij JM, Maal TJ, Haers P, Borstlap WA, Kuijpers-Jagtman AM, Berge SJ. Digital three-dimensional image fusion processes for planning and evaluating orthodontics and orthognathic surgery. A systematic review. Int J Oral Maxillofac Surg. 2011;40:341–352. doi: 10.1016/j.ijom.2010.10.013. [DOI] [PubMed] [Google Scholar]
- 8.Gwilliam JR, Cunningham SJ, Hutton T. Reproducibility of soft tissue landmarks on three-dimensional facial scans. Eur J Orthod. 2006;28:408–415. doi: 10.1093/ejo/cjl024. [DOI] [PubMed] [Google Scholar]
- 9.Othman SA, Ahmad R, Mericant AF, Jamaludin M. Reproducibility of facial soft tissue landmarks on facial images captured on a 3D camera. Aust Orthod J. 2013;29:58–65. [PubMed] [Google Scholar]
- 10.Wong JY, Oh AK, Ohta E, Hunt AT, Rogers GF, Mulliken JB, et al. Validity and reliability of craniofacial anthropometric measurement of 3D digital photogrammetric images. Cleft Palate Craniofac J. 2008;45:232–239. doi: 10.1597/06-175. [DOI] [PubMed] [Google Scholar]
- 11.Brons S, van Beusichem ME, Bronkhorst EM, Draaisma J, Berge SJ, Maal TJ, et al. Methods to quantify soft-tissue based facial growth and treatment outcomes in children: a systematic review. PLoS One. 2012;7:e41898. doi: 10.1371/journal.pone.0041898. [DOI] [PMC free article] [PubMed] [Google Scholar]
- 12.Liu Y, Kau CH, Pan F, Zhou H, Zhang Q, Zacharopoulos GV. A 3-dimensional anthropometric evaluation of facial morphology among Chinese and Greek population. J Craniofac Surg. 2013;24:e353–e358. doi: 10.1097/SCS.0b013e3182902e5d. [DOI] [PubMed] [Google Scholar]
- 13.Farkas LG, Katic MJ, Forrest CR, Alt KW, Bagic I, Baltadjiev G, et al. International anthropometric study of facial morphology in various ethnic groups/races. J Craniofac Surg. 2005;16:615–646. doi: 10.1097/01.scs.0000171847.58031.9e. [DOI] [PubMed] [Google Scholar]
- 14.Baik HS, Jeon JM, Lee HJ. Facial soft-tissue analysis of Korean adults with normal occlusion using a 3-dimensional laser scanner. Am J Orthod Dentofac Orthop. 2007;131:759–766. doi: 10.1016/j.ajodo.2005.08.038. [DOI] [PubMed] [Google Scholar]
- 15.Othman SA, Majawit LP, Wan Hassan WN, Wey MC, Mohd RR. Anthropometric study of three-dimensional facial morphology in Malay adults. PLoS One. 2016;11:e0164180. doi: 10.1371/journal.pone.0164180. [DOI] [PMC free article] [PubMed] [Google Scholar]
- 16.Ozdemir ST, Sigirli D, Ercan I, Cankur NS. Photographic facial soft tissue analysis of healthy Turkish young adults: anthropometric measurements. Aesthet Plast Surg. 2009;33:175–184. doi: 10.1007/s00266-008-9274-z. [DOI] [PubMed] [Google Scholar]
- 17.Kau CH, Richmond S, Zhurov A, Ovsenik M, Tawfik W, Borbely P, et al. Use of 3-dimensional surface acquisition to study facial morphology in 5 populations. Am J Orthod Dentofacial Orthop. 2010;137(4 Suppl):S56 e1–S56 e9. doi: 10.1016/j.ajodo.2009.04.022. [DOI] [PubMed] [Google Scholar]
- 18.Farkas LG. Anthropometry of the head and face. New York: Lippincott Raven Press; 1994. [Google Scholar]
- 19.Mulliken JB, Burvin R, Farkas LG. Repair of bilateral complete cleft lip: intraoperative nasolabial anthropometry. Plast Reconstr Surg. 2001;107:307–314. doi: 10.1097/00006534-200102000-00001. [DOI] [PubMed] [Google Scholar]
- 20.Bowman KO, Shenton LR. Estimator: Method of Moments. Encyclopedia of statistical sciences. New York: Wiley; 1998. p. 2092-8.
- 21.Landis JR, Koch GG. The measurement of observer agreement for categorical data. Biometrics. 1977;33:159–174. doi: 10.2307/2529310. [DOI] [PubMed] [Google Scholar]
- 22.Bastir M, Godoy P, Rosas A. Common features of sexual dimorphism in the cranial airways of different human populations. Am J Phys Anthropol. 2011;146:414–422. doi: 10.1002/ajpa.21596. [DOI] [PubMed] [Google Scholar]
- 23.Rosas A, Bastir M, Alarcon JA, Kuroe K. Thin-plate spline analysis of the cranial base in African, Asian and European populations and its relationship with different malocclusions. Arch Oral Biol. 2008;53:826–834. doi: 10.1016/j.archoralbio.2008.02.005. [DOI] [PubMed] [Google Scholar]
- 24.Rosas A, Bastir M. Thin-plate spline analysis of allometry and sexual dimorphism in the human craniofacial complex. Am J Phys Anthropol. 2002;117:236–245. doi: 10.1002/ajpa.10023. [DOI] [PubMed] [Google Scholar]
- 25.Alarcon JA, Bastir M, Rosas A. Variation of mandibular sexual dimorphism across human facial patterns. Homo. 2016;67:188–202. doi: 10.1016/j.jchb.2015.11.004. [DOI] [PubMed] [Google Scholar]
- 26.Coquerelle M, Bookstein FL, Braga J, Halazonetis DJ, Weber GW, Mitteroecker P. Sexual dimorphism of the human mandible and its association with dental development. Am J Phys Anthropol. 2011;145:192–202. doi: 10.1002/ajpa.21485. [DOI] [PubMed] [Google Scholar]
- 27.Ferrario VF, Sforza C, Serrao G. A three-dimensional quantitative analysis of lips in normal young adults. Cleft Palate Craniofac J. 2000;37:48–54. doi: 10.1597/1545-1569_2000_037_0048_atdqao_2.3.co_2. [DOI] [PubMed] [Google Scholar]
- 28.Porter JP, Olson KL. Anthropometric facial analysis of the African American woman. Arch Facial Plast Surg. 2001;3:191–197. doi: 10.1001/archfaci.3.3.191. [DOI] [PubMed] [Google Scholar]
- 29.Porter JP. The average African American male face: an anthropometric analysis. Arch Facial Plast Surg. 2004;6:78–81. doi: 10.1001/archfaci.6.2.78. [DOI] [PubMed] [Google Scholar]
- 30.Aung SC, Foo CL, Lee ST. Three dimensional laser scan assessment of the oriental nose with a new classification of oriental nasal types. Br J Plast Surg. 2000;53:109–116. doi: 10.1054/bjps.1999.3229. [DOI] [PubMed] [Google Scholar]
- 31.Holton NE, Yokley TR, Froehle AW, Southard TE. Ontogenetic scaling of the human nose in a longitudinal sample: implications for genus Homo facial evolution. Am J Phys Anthropol. 2014;153:52–60. doi: 10.1002/ajpa.22402. [DOI] [PubMed] [Google Scholar]
Associated Data
This section collects any data citations, data availability statements, or supplementary materials included in this article.
Supplementary Materials
Variables data generated or analyzed during this study. (XLSX 51 kb)
Data Availability Statement
All data generated or analysed during this study are included in this published article and its supplementary information files.