Abstract
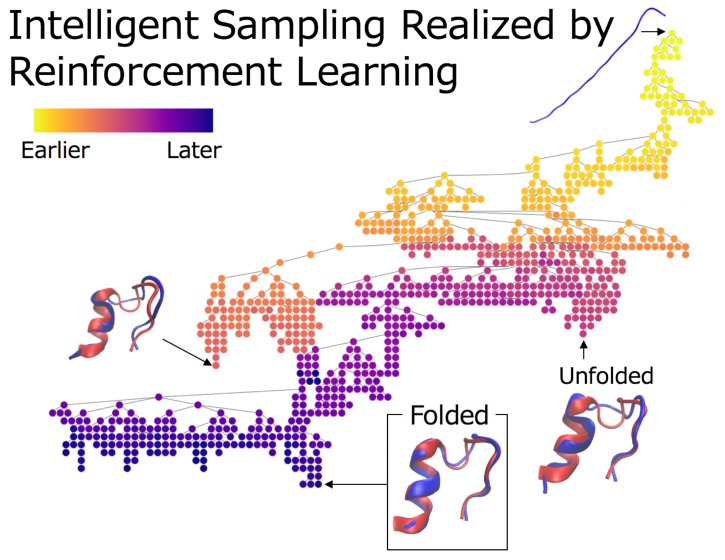
This paper proposes a novel molecular simulation method, called tree search molecular dynamics (TS-MD), to accelerate the sampling of conformational transition pathways, which require considerable computation. In TS-MD, a tree search algorithm, called upper confidence bounds for trees, which is a type of reinforcement learning algorithm, is applied to sample the transition pathway. By learning from the results of the previous simulations, TS-MD efficiently searches conformational space and avoids being trapped in local stable structures. TS-MD exhibits better performance than parallel cascade selection molecular dynamics, which is one of the state-of-the-art methods, for the folding of miniproteins, Chignolin and Trp-cage, in explicit water.
1. Introduction
In general, biomolecular systems are complex and have many degrees of freedom.1 Their biological time scales exceed the current capability of atomistic simulations, which is usually more than a microsecond. Among the various biomolecular simulation methods, molecular dynamics (MD) simulation is a powerful approach for characterizing structural information as a time series of atomic-level trajectories with femto-second resolution.2 To solve the time-scale problem, many enhanced sampling methods have been proposed to overcome the time-scale limitation. These methods can be divided into biasing and nonbiasing methods, which are listed here: conformational flooding,3 hyperdynamic,4 metadynamics,5,6 multicanonical MD (McMD),7 replica-exchange MD,8 string method,9 mile-stoning,10 adaptive biased force (ABF),11 accelerated MD,12 weighted ensemble,13 WExplore,14 parallel cascade selection MD (PaCS-MD)15 and its variants,16−19 outlier flooding method,20 and more.
Among the unbiased, enhanced sampling methods, PaCS-MD, which was previously developed by some of the authors of this study, tends to sample the conformational transition pathway between an initial structure and a given target structure. PaCS-MD comprises multiple cycles of parallel simulations (replicas) with selections of MD snapshots from the predecessor cycle to be the initial configuration of the successor cycle.15,21 It has been found that the number of replicas considerably affects the sampling efficiency22 (i.e., the larger the number of replicas is, the fewer the number of traps in the local minima in the conformational space is). In addition, resampling from the top 1.0 to 2.0% of the highly ranked conformations is assumed to provide better sampling performance.23 Therefore, a smarter selection scheme of initial configurations of replicas is needed to improve the performance of not only PaCS-MD, but also of other unbiased, enhanced sampling methods.
In this study, we introduce a new method, called tree search MD (TS-MD), by applying a tree search algorithm, upper confidence bounds for trees (UCT),24 to biomolecular sampling. UCT is a type of reinforcement learning algorithm25 and has been used to solve search problems in the field of artificial intelligence for games, including AlphaGo Zero.26−29 In addition, UCT-based approaches have proven to be effective for solving real world problems such as de novo molecular design and retrosynthesis.30−32 In these search problems, the exploration-exploitation dilemma,33,34 (i.e., the trade-off between obtaining new knowledge: exploration, and using the obtained knowledge: exploitation) becomes an issue that needs to be solved. UCT is one of the frameworks that solve this dilemma.
In this paper, we show that sampling the conformation transition pathway from the initial structure to the targeted one can be regarded as a tree search problem by considering a structure (snapshot) as a node in the tree and a short simulation from the structure as an edge between nodes. Furthermore, we demonstrate that MD-based pathway sampling can be performed by applying the UCT algorithm to the tree search problem using the folding of mini-proteins, Chignolin and Trp-cage, in explicit water as examples. We show that effective sampling can be realized from their simulation results by using the UCT approach, thereby quickly escaping from the local traps. Our implementation is available on GitHub at https://github.com/tsudalab/TSMD/.
2. Materials and Methods
2.1. TS-MD Procedure
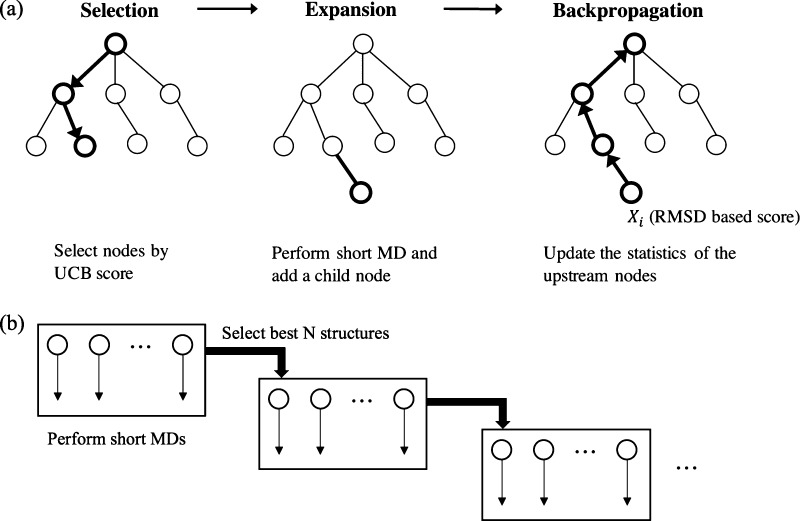
TS-MD comprises multiple hierarchical short MD simulations in predefined orders and metrics, which connect the given initial structure (reactant) to a target structure (product). Figure 1a presents an illustration of one TS-MD cycle that includes three steps: selection, expansion, and back-propagation. In the TS-MD tree, the conformational microstates (snapshots) of a protein and simulated trajectories between them are represented by nodes (circles) and edges, respectively. We employ the UCT approach24 to realize an effective transition pathway search by growing the tree by repeating the TS-MD cycle. The advantage of the UCT search is that it realizes a pathway search by growing the search tree, maintaining the balance between exploration and exploitation. Even if a search is trapped in a local stable structure, TS-MD is expected to eventually find another pathway by growing other branches by maintaining the balance.
Figure 1.
Illustration of (a) TS-MD and (b) PaCS-MD. Conformational microstates (snapshots) of a protein and simulated trajectories between them are represented by nodes (circles) and edges, respectively.
We explain the three steps of a TS-MD cycle. The details
of the process of them are illustrated as a pseudocode in Algorithm
1. Each node has its score X that is obtained from
MD simulation results and called the “reward,” and the
number of visited times n. The reward and the visited
number are updated during the TS-MD cycles. During the selection step
of TS-MD, the tree is traversed from the root to a leaf by recursively
choosing the maximum upper confidence bound (UCB) child at each branch.
Note that UCB is different from UCT. The details of UCB, which is
calculated from the rewards, are explained in the next paragraph.
If multiple child nodes obtain the same maximal value, one of them
is selected by randomization. During the expansion step, a short MD
simulation with re-randomized velocities in the system is performed
from the selected node and the snapshot with a minimum root-mean-square
deviation (RMSD) is added as a child if the child RMSD is smaller
than the parent RMSD. In the field of games, the possible moves (actions)
are predefined in most cases. However, the next moves from a node
(structure) are not trivial in conformational sampling. Thus, we prepare
some sample pathways using MD simulations with different initial velocities
and treat each pathway (edge) as a move in the field of games (reinforcement
learning). Finally, during the back-propagation step, the visit counts ni of all the selected branches
are incremented and the reward Xi is updated to the smallest achieved RMSD. The TS-MD cycle
is terminated when the minimum RMSD obtained during the search becomes
equal to or less than the reference value (RMSDmin).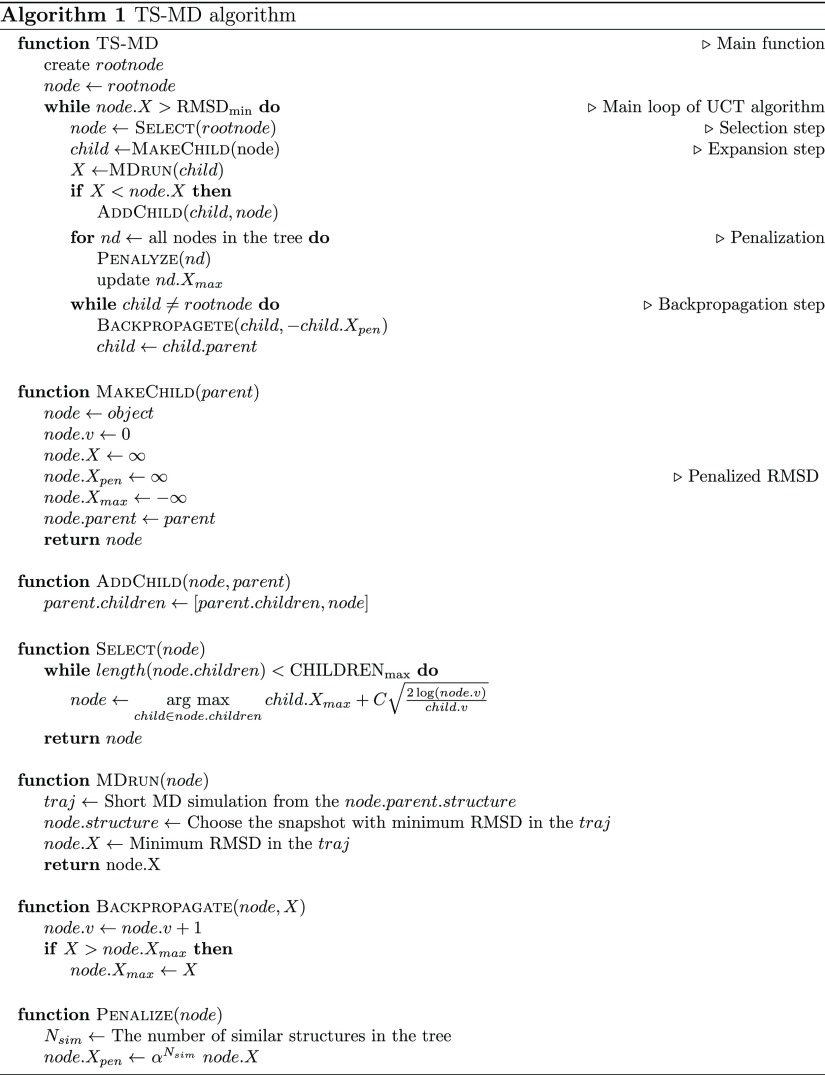
The UCB of the i-th child node can be calculated via the following equation.
| 1 |
where Xi is the reward of the i-th child calculated from MD simulations, N is the number of times the parent node has been visited, ni is the number of times the i-th child has been visited, and C is the constant used to balance the first and second terms. In this study, for the reward Xi, we take advantage of the backbone atom RMSD after least-squares-fitting of the backbone atoms to evaluate the structural similarity to the product. The negative of the minimum RMSD of the downstream nodes is used as the reward Xi for minimizing the similarity between the simulated and target conformations. Note that we use the negative of the minimum RMSD because of the maximum node with UCB during the selection step. Whenever a node is visited by the simulation (ni increases), the second term of eq 1 decreases, while the UCBs of other child nodes increase upon visiting their parent node (N increases). To maintain the balance between exploitation and exploration, the parameter C needs to be tuned according to the complexity of the target system and the simulation length.
The key point in rare event sampling is to explore new microstates, which should be low in appearance frequency.35 Within this scope, we add a penalty term in the algorithm to promote sampling in the rare region of the conformational space, to prevent traps from the local minima of a free energy landscape, or to sample in the same conformational space between branches. The penalized reward of the i-th node, X′, is calculated as follows.
| 2 |
where α is the penalty parameter and Nsim is the number of similar structures. To calculate Nsim, all the structures of the nodes in the search tree are considered. Snapshots of similar structures and dissimilar structures are distinguished by their pair-wise RMSDs being lesser and greater than 1.0 Å, respectively.
From the viewpoint of reinforcement learning, the penalized reward can be regarded as a way to solve the problem of UCT-based search in continuous space (i.e., excessive search of similar states or structures). In general, if the search space is discrete in the UCT search, such a penalty term is not required. However, if the search space is continuous, such a penalty is effective in the field of UCT search36−38 because the search space is too large. Similarly, we introduce the penalized reward, giving a larger penalty in relation to the number of similar structures that exist.
To compare the performance of TS-MD with that of an existing method, PaCS-MD15 is also demonstrated in this study. Figure 1b illustrates the PaCS-MD procedure. PaCS-MD repeats a cycle of multiple independent MD (MIMD) simulations to obtain a transition pathway between the two structures. In each cycle, short MIMDs with randomized initial velocities of the system are performed and the top snapshots are selected from the trajectories as the initial structures of the next cycle.
2.2. Computational Details
To demonstrate the performance of TS-MD, we apply both PaCS-MD and TS-MD methods to the folding of the 10-residue protein Chignolin (PDB id 1UAO(39)) and the 20-residue protein Trp-cage (PDB id 1L2Y(40)) in explicit water (Figure 2). During the folding process, an NMR structure is used as a product, whereas the artificially extended structure (see the Supporting Information) with the same amino acids using the same protonation states as the former is used as a reactant. The extended structures were prepared by using the molecular operating environment (MOE, Chemical Computing Group, Montreal, Canada). The AMBER ff99SB force field41 was employed for both the systems. The proteins were solvated with the TIP3P water model42 in rectangular simulation boxes with counter ions to maintain the system being neutral in charge. The box sizes were set to ensure that the distances between any atoms of the protein and the box edges were at least 10 Å in each dimension. Cubic boxes with initial edge lengths of 53.1 and 83.7 Å were employed for Chignolin and Trp-cage, respectively. We used these boxes for both PaCS-MD and TS-MD. As a result, the Chignolin system contained 4818 water molecules and two sodium ions, whereas the Trp-cage system contained 18 980 water molecules and one chloride ion. The energy of all the systems was minimized using the steepest descent algorithm to avoid high energy interactions in modeling with the imposing of positional restraints of the backbone atoms of the proteins (force constant: 1000 kJ/mol nm2). Then, the systems were then thermalized at 300 and 320 K for Chignolin and Trp-cage, respectively, using a canonical ensemble with a velocity-rescaling thermostat43 in 100 ps. After that, the isothermal-isobaric ensemble was employed to relax the system to 1 bar pressure using an isotropic barostat with the Parrinello–Rahman algorithm44 and to keep the corresponding temperatures in the next 100 ps. In each cycle of PaCS-MD and TS-MD, each short (100 ps) MD simulation used the same thermostat and barostat as used in the equilibrating stage, except that no positional restraint was applied to the system. The electrostatic interactions were treated using the particle mesh Ewald method.45 The simulation time step was 2 fs with constraints on all bonds via the LINCS algorithm46 and snapshots in each trajectory were recorded every 1 ps. Leapfrog integration was used. All the MD simulations were performed using the GPU version of the GROMACS 2016.5 package.47
Figure 2.
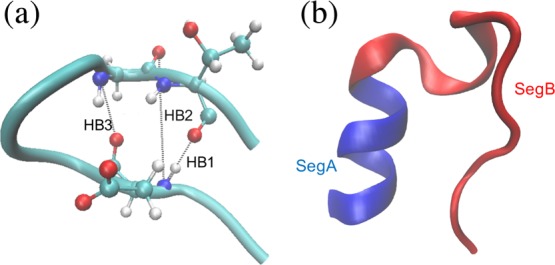
(a) Native structure of Chignolin. Chignolin can have three characteristic hydrogen bonds: HB1, HB2, and HB3. (b) Native structure of Trp-cage. The blue area represents the α helix region and the red area represents the other region.
We set the number of parallel cascades in PaCS-MD to five. Therefore, in each PaCS-MD cycle, five short MDs are performed from the five highest ranking snapshots from the previous cycle. The maximum number of child nodes (CHILDRENmax) in TS-MD was set to three.
3. Results
3.1. Chignolin Folding
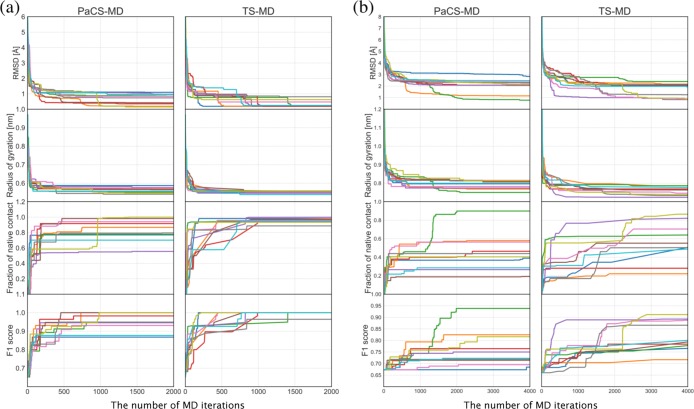
To find a reactive folding pathway of Chignolin in explicit water, PaCS-MD and TS-MD were performed up to 2000 MD iterations. Note that a cycle of PaCS-MD corresponds to five MD iterations because it consists of five short MD simulations. A cycle of TS-MD corresponds to one MD iteration. Figure 3a presents various profiles of 10 trials of PaCS-MD and TS-MD as a function of the number of MD iterations, which include the RMSD from the product, radius of gyration, the fraction of native contact,48 and F1 score of contact prediction.49 We used the backbone atom RMSD after least-square-fitting of the backbone atoms to the product. In TS-MD, the parameters C and α were set to 0.05 and 1.05, respectively. As seen in the profiles, the protein structure becomes closer to the product as the MD iteration progresses and sufficiently converges in 2000 MD iterations. Among the 10 trials, nine PaCS-MD trials and all TS-MD trials reached the RMSD of less than 1.0 Å and four PaCS-MD trials, and eight TS-MD trials reached the RMSD of less than 0.5 Å.
Figure 3.
Profiles of RMSD, radius of gyration, the fraction of native contact, and F1 score of PaCS-MD and TS-MD in (a) Chignolin folding and (b) Trp-cage folding as a function of the number of MD iterations. The simulation time of one short MD was 100 ps for both PaCS-MD and TS-MD. The total simulation times of one trial for Chignolin and Trp-cage foldings were 200 and 400 ns, respectively. Ten trials were performed for each method, and different colors indicate different trials.
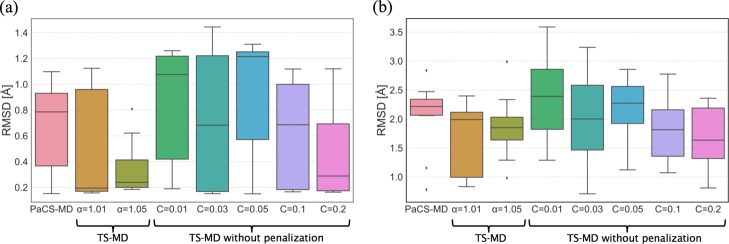
To demonstrate how the penalty to the high frequency states and the value of parameter C affect the search behavior, TS-MD with different settings of α (1.01 and 1.05) with C = 0.05 and TS-MD without penalty (α = 1) with different settings of C (0.01, 0.03, 0.05, 0.1, and 0.2) were performed. Figure 4a shows a boxplot of RMSD at the 2000th iteration to summarize the performance of each method. In TS-MD without penalty, the value of C affected the search performance, which indicates that it involves the exploration and exploitation trade-off. This effect can also be observed in the projection of sampled structures (Figure S1). In this case, because Chignolin folding can be considered as a relatively simple mechanism, a larger C could converge to the target in 3000 iterations and resulted in better performance compared to that of smaller Cs. However, the performance of TS-MD with penalty with C = 0.05 was better than those of PaCS-MD and TS-MD without penalty with any setting of C, with respect to the number of trials needed to reach the product, the median of the minimum RMSD, and the RMSD in the worst trial. The contribution of the penalty to the search efficiency was confirmed by comparing the performances between TS-MD with penalty and without penalty, with C = 0.05.
Figure 4.
Boxplots of the smallest RMSDs for 10 trials of (a) Chignolin folding (3000 iterations) and (b) Trp-cage folding (4000 iterations) for each method: PaCS-MD, TS-MD with α = 1.01, 1.05 and C = 0.05, and TS-MD without penalty with C = 0.01, 0.03, 0.05, 0.1, 0.2.
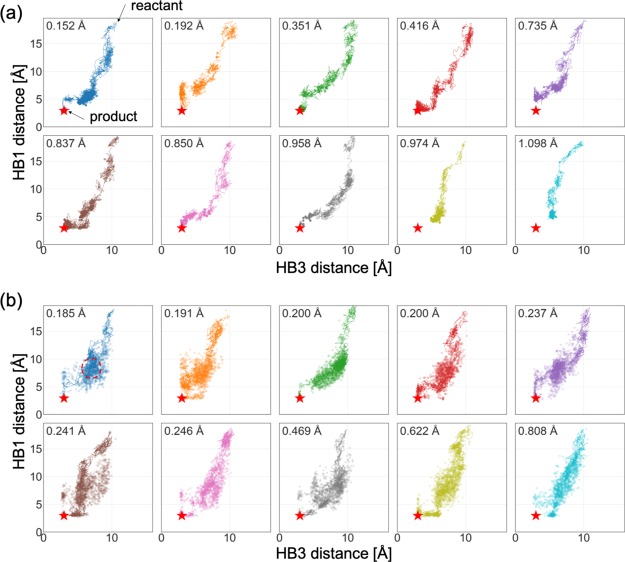
To examine, in detail, the search process, the structures were projected onto a low-dimensional space. Previous studies39,50 showed that the length of hydrogen bonds, HB1(Asp3:N-Thr8:O), HB2(Asp3:N-Gly7:O), and HB3(Asp3:O-Gly7:N) characterize the process of folding and misfolding (Figure 2a). It is reported that HB3 works as a folding trigger. The formation of HB1 occurs under the condition that HB3 completes the folding, but the conformation with HB2 leads to a misfolded structure. Figure 5 shows all the structures in the tree projected onto a subspace spanned by HB1 and HB3. In this study, reactive trajectories15 which are defined as joint multiple trajectories connecting the reactant to the structure with the minimum RMSD, are also projected. Because the space searched by PaCS-MD is quite narrow, some trials stopped at unfolded states, in which HB3 is not formed sufficiently and RMSDs are stopped around 1.0 Å. On the other hand, TS-MD searched a much broader conformational space and almost all trials successfully reached the product. As demonstrated in Figure S1b, some TS-MD trials were initially trapped into misfolded states where HB2 is formed, but eventually avoided searching those states as the MD iterations go on. In addition, there were some reactive trajectories that reached the product by passing through misfolded states. When we judge the success of folding using the distance between the H-bonds (HB1 and HB3 ≤ 3.5 Å), eight trials except for the ocher and light blue ones in Figure 5, were successfully folded by PaCS-MD and all 10 trials were folded by TS-MD. Furthermore, we calculated the principal components (PCs) of the 18 models in PDB id 1UAO, and projected the final snapshots of PaCS-MD and TS-MD to the first and second PCs as shown in Figure S2. The result shows that the best structures obtained by PaCS-MD and TS-MD are correctly folded and approach the NMR structures. Notice that we used model 1 as the targeted structure.
Figure 5.
Two-dimensional plot of Chignolin structures (points) and the reactive trajectory (a polygonal line) for each trial into the subspace spanned by the distances between key hydrogen bonds, HB1 and HB3, of (a) PaCS-MD and (b) TS-MD. The red star is the native structure (product). The minimum RMSD for each trial is at the top-left corner. The area surrounded by the red dotted circle indicates a misfolded state corresponding to that shown in Figure 6.
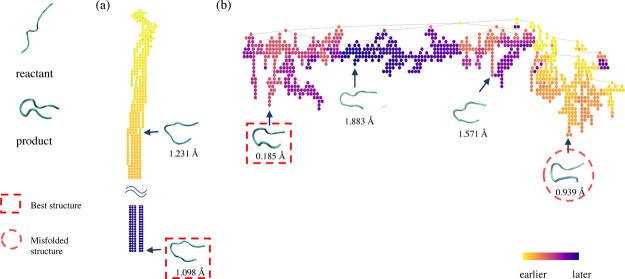
Figure 6 shows examples of the search trees of PaCS-MD and TS-MD with the reactant, product, and intermediate structures. They correspond to the trials shown in light blue (PaCS-MD) and blue (TS-MD) in Figure 5, respectively. The former shows a typical example of a failed case in PaCS-MD, and the latter shows how TS-MD avoided being trapped by misfolded states. The tree colors indicate the order in which each node was added to the tree. With PaCS-MD, the tree went deep and created only one long branch. The search was trapped in a local structure for a long time. However, TS-MD created many branches on one tree and backtracked from some branches to explore other branches when the search was trapped at a misfolded structure. The structure in the red dotted circle is a misfolded structure formed with HB2, and its projection onto the reaction coordinates is shown in Figures 5 and S1. After discovering the best structure in the red dotted rectangle, TS-MD tried to search for different pathways to the target structure. As a result, relatively small RMSD structures were obtained in the later stage (blue or purple nodes), but not less than 0.185 Å. Furthermore, to make it easy to understand the folding process, we represented the progresses of MD iterations using a color gradation (see Figure S3).
Figure 6.
Search tree examples of (a) PaCS-MD and (b) TS-MD in the Chignolin folding (light blue and blue trail in Figure 5). The color of each node indicates the order in which it is added to the tree. Intermediate structures at some nodes are also illustrated with the values of RMSDs from the product. The structures in the red dotted square have the minimum RMSD in each trial, and the one in the red dotted circle indicate a misfolded structure. In (b) TS-MD, at the beginning, the pathways to a misfolded structure were sampled preferentially. However, the search process escaped from the local minima owing to the UCT algorithm, and finally, reached the product.
3.2. Trp-Cage Folding
To find a reactive folding pathway of Trp-cage in explicit water, PaCS-MD and TS-MD were also performed up to 4000 MD iterations. Figure 3b shows the profiles of 10 trials of PaCS-MD and TS-MD. The parameters C and α for TS-MD were 0.05 and 1.01, respectively. Only 1 trial successfully reached the product in PaCS-MD and 3 trials reached in TS-MD with the criterion of RMSD < 1.0 Å. When we judge the success of folding with the criterion of RMSD ≤ 1.5 Å, two and four trials were successfully folded by PaCS-MD and TS-MD, respectively. Some trials were stopped at unfolded structures whose RMSDs were in between 2.0 and 3.0 Å. The convergence of RMSD in Trp-cage folding is slower than that in Chignolin folding because Trp-cage is larger and more complicated. Similar to the Chignolin demonstration, TS-MD with different settings of α (1.01 and 1.05) with C = 0.05 and TS-MD without penalty (α = 1) with different settings of C (0.01, 0.03, 0.05, 0.1, and 0.2) were performed. Figure 4b shows a boxplot of RMSDs at the 4000th iteration for each method. Both TS-MD with penalty and without penalty exhibited better performance than PaCS-MD.
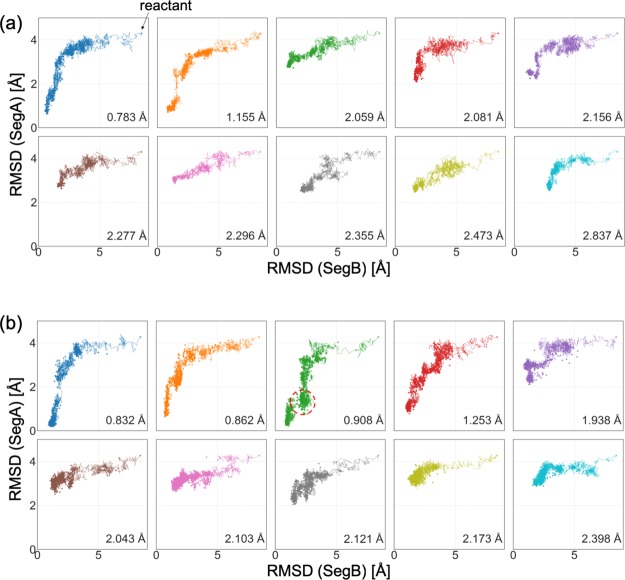
To analyze their properties, sampled structures and reactive trajectories were projected onto 2D reaction coordinates (Figure 7). We have also shown the progresses of MD iterations using a color gradation in Figure S4. Following the folding analysis by Meuzelaar et al.,51 we used RMSDs with the product in two partial segments, SegA and SegB, as the reaction coordinates. SegA contains an α helix region (residue 1–8) and SegB contains the other region (residue 8–20) (Figure 2b). In the folding process of Trp-cage, there is a free-energy barrier while the α helix structure is formed.51 As shown in the plots, there are unfolded states at 2–3 Å without the formation of the α helix structure in both PaCS-MD and TS-MD. However, TS-MD is more likely to find the correct transition pathway.
Figure 7.
Two-dimensional plot of Trp-cage structures (points) and the reactive trajectory (a polygonal line) in each trial in the subspace spanned by the RMSDs of SegA and SegB of (a) PaCS-MD and (b) TS-MD. The area surrounded by the red dotted circle indicates the unfolded state corresponding to that shown in the Figure 8.
Figure 8 shows examples of search trees of PaCS-MD and TS-MD with the reactant, product, and intermediate structures. They correspond to the orange trial in PaCS-MD and green trial in TS-MD shown in Figure 7, respectively. It is observed that PaCS-MD chooses a wrong pathway and is trapped in a local structure in which the α helix is formed wrongly. On the other hand, TS-MD searches multiple pathways, including a wrong one and escapes from local stable structures. The structure in the red dotted circle is a misfolded structure and its projection onto the reaction coordinates is shown in Figure 7. We confirmed that all folding pathways obtained by TS-MD and PaCS-MD first formed the tertiary contacts before helix formation. This pathway is identical to the major pathway of Trp-cage folding reported in a previous study.52 On the other hand, the minor pathway reported in the paper was not observed in this study. In addition, we have thoroughly performed well-tempered metadynamics6 folding of Trp-cage with the collective variable radius of gyration (Rg) and RMSD to the extended state of Trp-cage (RMSDextended_state). We mapped the TS-MD trajectories to the free energy landscape as shown in Figure S5. In the best cases, the plots demonstrated a thorough sampling of the whole free energy landscape of Trp-cage.
Figure 8.
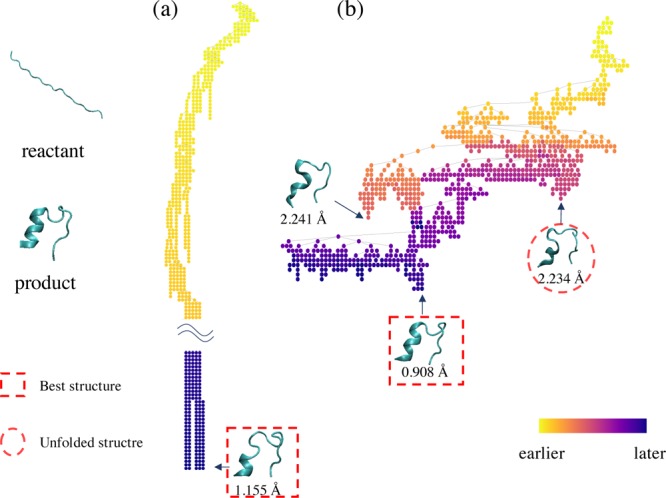
Search tree examples of (a) PaCS-MD and (b) TS-MD in the Trp-cage folding (orange and green trials in Figure 7). The color of each node indicates the order in which it is added to the tree. The intermediate structures at some nodes are also illustrated with the RMSD values from the product. The structures in the red dotted square are those having the minimum RMSD in each trial, and the structure in the red dotted circle is a misfolded structure.
4. Discussion
One of the biggest benefits of using the tree search method is that it can memorize the previous results as a tree and utilize them for further simulations. Because MD simulation is strongly dependent on a trial, it is suggested that multiple trials are be needed to observe desired events. In PaCS-MD, those trials are independent and cannot share the knowledge among each other. In contrast, because TS-MD does many trials in one tree, it can share all simulation results. This property allows TS-MD to reduce the number of simulations needed to get rare events in a complicated system.
In addition, TS-MD has several advantages and disadvantages compared to other sampling methods. Specifically, TS-MD (PaCS-MD) can generate a pathway without adding bias force, changing temperature, and modifying potential, which are often done by the previous works such as conformational flooding, hyperdynamics, metadynamics, replica exchange, multicanonical MD (McMD), accelerated MD, ABF, and others. Furthermore, implementation of TS-MD is relatively easy because there is no need to change the force field. The idea of TS-MD does not depend on the MD implementation, and our implementation is also available. As a disadvantage of TS-MD, compared to other well-established methods such as metadynamics,5 because sampling by TS-MD is not based on any physical principle, but only on the similarity to a product such as RMSD, TS-MD cannot calculate the free energy landscape without being combined with other methods such as the weighted histogram analysis method53 or the Markov state model.54−56
The results of a TS-MD search in the conformational space strongly depend on parameter C in UCT. For example, a larger value of C enables broader sampling in the conformational space, as shown in Figures S6 and S7. When computational resources are limited, it is beneficial to reduce the cost of unnecessary searching using a relatively small C. Although we treated parameter C as a constant in this study, automatic tuning methods of C have already been proposed57 and their benefits have been shown in solving real problems.58 In addition, the maximum number of child nodes (CHILDRENmax) affects the conformation sampling efficiency, although we fixed it to three in this paper. Furthermore, we introduced a penalized reward with the parameter α for the acceleration of sampling. Although we showed that the proposed method has some effectiveness for sampling transition pathways, it is not necessarily the most effective one. The development of an automatic adjustment method of optimal values for these parameters would improve the usefulness of TS-MD.
For the parameters C and α, it is possible to adjust experimentally using the following strategy to some extent. As mentioned above, the larger the value of C, the broader the search tree will grow. If the value of C is too large, the search does not proceed deeply. We show a typical example of a large value of C in Figure S8a. Our implementation of TS-MD outputs such diagrams by default. However, if the value of C is too small, the search tree becomes too deep with few branches. In addition, we show a typical example of such a search tree in Figure S8b. We can adjust C while observing the growth of such a search tree. If the search tree is too wide, then we should use a smaller value for C. It is difficult to determine the optimal C, but it is possible to narrow down its range roughly. Furthermore, the same adjustment is possible for α. If α is too large, the penalty increases and the tree spreads widely. On the other hand, if α is too small, its search is close to a search without a penalty. Therefore, α can also be roughly adjusted by observing the growth of the search trees. The abovementioned procedures are not optimal, and there may be room for improvement to tune the α and C parameters.
5. Conclusions
In this study, we proposed TS-MD, which uses reinforcement learning to enhance protein conformational sampling. TS-MD can effectively sample various states and escape from local stable structures, based on the combination of the UCT algorithm and short MD simulations. We demonstrated that the folding processes of Chignolin and Trp-cage are sampled with higher efficiency by TS-MD, compared to PaCS-MD. Although we demonstrated TS-MD-based samplings only for the folding processes of small proteins, this method can be applied to any protein conformational transition such as domain motion and protein–ligand binding. TS-MD requires a target structure in the present. However, it is also possible to use TS-MD when the target state is unknown if the reward is changed properly as the nontargeted PaCS-MD.59
There is room for improvement in the adjustment of the search parameters such as C, α, and the number of child nodes in TS-MD. In future work, we will consider how to determine the optimal parameter values for a given system. TS-MD would be applicable to larger systems such as T4 lysozyme and Villin. By the several previous studies,15,60 it is shown that the open-close transition of T4 lysozyme has multiple pathways. TS-MD can be applicable to the open-close transition of such larger systems with multiple pathways by multiple search trials from different initial velocities. However, TS-MD’s performance for such larger systems needs to be validated in the future. Furthermore, because TS-MD uses a relatively simple algorithm, we will enhance it by applying many acceleration techniques that use heuristic knowledge,61 pruning of suboptimal moves,62 and massive parallelization.63,64
Acknowledgments
We thank Dr. Shigeyuki Matsumoto and Dr. Masato Sumita for the preparation of the initial structures and helpful comments. We also thank Prof. Yasushi Okuno and Dr. Kazuki Yoshizoe for helpful comments and suggestions.
Supporting Information Available
The Supporting Information is available free of charge on the ACS Publications website at DOI: 10.1021/acsomega.9b01480.
1UAO_extended.pdb: the extended structure of Chignolin 1L2Y_extended.pdb: the extended structure of Trp-Cage; 2D plot of Chignolin structures; projected final snapshots of PaCS-MD and TS-MD; 2D plot of Chignolin structures with iteration information; 2D plot of Trp-cage structures with iteration information; trajectories mapped to the free energy landscape; 2D plot of Chignolin structures with different settings of C; 2D plot of Trp-cage structures with different settings of C; typical examples of tree growths (PDF)
This work was supported by the Ministry of Education, Culture, Sports, Science, and Technology of Japan (MEXT) as a “Priority Issue on Post-K Computer” (Building Innovative Drug Discovery Infrastructure through Functional Control of Biomolecular Systems). This article is also based on the results obtained from the “Materials Research by Information Integration” Initiative (MI2I) project, Core Research for Evolutional Science and Technology (CREST) (Grants No. JPMJCR1502), and JST AIP-PRISM Grant Number JPMJCR18Y3, Japan. The computations in this work were carried out at the supercomputer centers of RAIDEN of AIP (RIKEN) and Oakforest-PACS at the Joint Center for Advanced High Performance Computing (JCAHPC).
The authors declare no competing financial interest.
Supplementary Material
References
- Protein Physics, 2nd ed.; Finkelstein A. V., Ptitsyn O. B., Eds.; Academic Press: Amsterdam, 2016. [Google Scholar]
- Biomolecular Simulations: Methods and Protocols, 1st ed.; Finkelstein A. V., Ptitsyn O. B., Eds.; Humana Press: New York, 2013. [Google Scholar]
- Grubmüller H. Predicting slow structural transitions in macromolecular systems: Conformational flooding. Phys. Rev. E 1995, 52, 2893–2906. 10.1103/physreve.52.2893. [DOI] [PubMed] [Google Scholar]
- Voter A. F. Hyperdynamics: Accelerated Molecular Dynamics of Infrequent Events. Phys. Rev. Lett. 1997, 78, 3908–3911. 10.1103/physrevlett.78.3908. [DOI] [Google Scholar]
- Laio A.; Parrinello M. Escaping free-energy minima. Proc. Natl. Acad. Sci. 2002, 99, 12562–12566. 10.1073/pnas.202427399. [DOI] [PMC free article] [PubMed] [Google Scholar]
- Barducci A.; Bussi G.; Parrinello M. Well-tempered metadynamics: a smoothly converging and tunable free-energy method. Phys. Rev. Lett. 2008, 100, 020603. 10.1103/physrevlett.100.020603. [DOI] [PubMed] [Google Scholar]
- Nakajima N.; Nakamura H.; Kidera A. Multicanonical ensemble generated by molecular dynamics simulation for enhanced conformational sampling of peptides. J. Phys. Chem. B 1997, 101, 817–824. 10.1021/jp962142e. [DOI] [Google Scholar]
- Sugita Y.; Okamoto Y. Replica-exchange molecular dynamics method for protein folding. Chem. Phys. Lett. 1999, 314, 141–151. 10.1016/s0009-2614(99)01123-9. [DOI] [Google Scholar]
- E W.; Ren W.; Vanden-Eijnden E. String method for the study of rare events. Phys. Rev. B: Condens. Matter Mater. Phys. 2002, 66, 052301. 10.1103/physrevb.66.052301. [DOI] [Google Scholar]
- Májek P.; Elber R. Milestoning without a reaction coordinate. J. Chem. Theory Comput. 2010, 6, 1805–1817. 10.1021/ct100114j. [DOI] [PMC free article] [PubMed] [Google Scholar]
- Comer J.; Gumbart J. C.; Hénin J.; Lelièvre T.; Pohorille A.; Chipot C. The adaptive biasing force method: Everything you always wanted to know but were afraid to ask. J. Phys. Chem. B 2014, 119, 1129–1151. 10.1021/jp506633n. [DOI] [PMC free article] [PubMed] [Google Scholar]
- Hamelberg D.; Mongan J.; McCammon J. A. Accelerated molecular dynamics: A promising and efficient simulation method for biomolecules. J. Chem. Phys. 2004, 120, 11919–11929. 10.1063/1.1755656. [DOI] [PubMed] [Google Scholar]
- Bhatt D.; Zhang B. W.; Zuckerman D. M. Steady-state simulations using weighted ensemble path sampling. J. Chem. Phys. 2010, 133, 014110. 10.1063/1.3456985. [DOI] [PMC free article] [PubMed] [Google Scholar]
- Dickson A.; Brooks C. L. WExplore: Hierarchical Exploration of High-Dimensional Spaces Using the Weighted Ensemble Algorithm. J. Phys. Chem. B 2014, 118, 3532–3542. 10.1021/jp411479c. [DOI] [PMC free article] [PubMed] [Google Scholar]
- Harada R.; Kitao A. Parallel cascade selection molecular dynamics (PaCS-MD) to generate conformational transition pathway. J. Chem. Phys. 2013, 139, 035103. 10.1063/1.4813023. [DOI] [PubMed] [Google Scholar]
- Harada R.; Shigeta Y. Dynamic Specification of Initial Structures in Parallel Cascade Selection Molecular Dynamics (PaCS-MD) Efficiently Promotes Biologically Relevant Rare Events. Bull. Chem. Soc. Jpn. 2017, 90, 1236–1243. 10.1246/bcsj.20170177. [DOI] [Google Scholar]
- Harada R.; Shigeta Y. Temperature-shuffled parallel cascade selection molecular dynamics accelerates the structural transitions of proteins. J. Comput. Chem. 2017, 38, 2671–2674. 10.1002/jcc.25060. [DOI] [PubMed] [Google Scholar]
- Harada R.; Shigeta Y. On-the-Fly Specifications of Reaction Coordinates in Parallel Cascade Selection Molecular Dynamics Accelerate Conformational Transitions of Proteins. J. Chem. Theory Comput. 2018, 14, 3332–3341. 10.1021/acs.jctc.8b00264. [DOI] [PubMed] [Google Scholar]
- Harada R.; Shigeta Y. Hybrid Cascade-Type Molecular Dynamics with a Markov State Model for Efficient Free Energy Calculations. J. Chem. Theory Comput. 2019, 15, 680–687. 10.1021/acs.jctc.8b00802. [DOI] [PubMed] [Google Scholar]
- Harada R.; Nakamura T.; Takano Y.; Shigeta Y. Protein folding pathways extracted by OFLOOD: Outlier FLOODing method. J. Comput. Chem. 2015, 36, 97–102. 10.1002/jcc.23773. [DOI] [PubMed] [Google Scholar]
- Kitao A.; Harada R.; Nishihara Y.; Tran D. P.. Parallel cascade selection molecular dynamics for efficient conformational sampling and free energy calculation of proteins. AIP Conference Proceedings. 2016; Vol. 1790, p 020013.
- Tran D. P.; Takemura K.; Kuwata K.; Kitao A. Protein-Ligand Dissociation Simulated by Parallel Cascade Selection Molecular Dynamics. J. Chem. Theory Comput. 2018, 14, 404–417. 10.1021/acs.jctc.7b00504. [DOI] [PubMed] [Google Scholar]
- Harada R.; Shigeta Y. Selection rules on initial structures in parallel cascade selection molecular dynamics affect conformational sampling efficiency. J. Mol. Graph. Model. 2018, 85, 153–159. 10.1016/j.jmgm.2018.08.014. [DOI] [PubMed] [Google Scholar]
- Kocsis L.; Szepesvári C.. Bandit Based Monte-Carlo Planning. European Conference on Machine Learning, 2006; pp 282–293.
- Sutton R. S.; Barto A. G.. Reinforcement learning: An introduction; MIT Press: Cambridge, 1998; Vol. 1. [Google Scholar]
- Silver D.; et al. Mastering the game of go without human knowledge. Nature 2017, 550, 354. 10.1038/nature24270. [DOI] [PubMed] [Google Scholar]
- Silver D.; et al. Mastering the game of Go with deep neural networks and tree search. Nature 2016, 529, 484. 10.1038/nature16961. [DOI] [PubMed] [Google Scholar]
- Cazenave T.Nested Monte-Carlo Search. International Joint Conference on Artificial Intelligence, 2009; pp 456–461.
- Ikehata N.; Ito T.. Monte-Carlo tree search in Ms. Pac-Man. IEEE Conference on Computational Intelligence and Games (CIG), 2011; pp 39–46.
- Yang X.; Zhang J.; Yoshizoe K.; Terayama K.; Tsuda K. ChemTS: an efficient python library for de novo molecular generation. Sci. Technol. Adv. Mater. 2017, 18, 972–976. 10.1080/14686996.2017.1401424. [DOI] [PMC free article] [PubMed] [Google Scholar]
- Sumita M.; Yang X.; Ishihara S.; Tamura R.; Tsuda K. Hunting for Organic Molecules with Artificial Intelligence: Molecules Optimized for Desired Excitation Energies. ACS Cent. Sci. 2018, 4, 1126–1133. 10.1021/acscentsci.8b00213. [DOI] [PMC free article] [PubMed] [Google Scholar]
- Segler M. H. S.; Preuss M.; Waller M. P. Planning chemical syntheses with deep neural networks and symbolic AI. Nature 2018, 555, 604–610. 10.1038/nature25978. [DOI] [PubMed] [Google Scholar]
- Auer P.; Cesa-Bianchi N.; Fischer P. Finite-time analysis of the multiarmed bandit problem. Machine Learning 2002, 47, 235–256. 10.1023/a:1013689704352. [DOI] [Google Scholar]
- Betz R.; Dror R. O. How effectively can adaptive sampling methods capture spontaneous ligand binding?. J. Chem. Theory Comput. 2019, 15, 2053. 10.1021/acs.jctc.8b00913. [DOI] [PMC free article] [PubMed] [Google Scholar]
- Teo I.; Mayne C. G.; Schulten K.; Lelièvre T. Adaptive Multilevel Splitting Method for Molecular Dynamics Calculation of Benzamidine-Trypsin Dissociation Time. J. Chem. Theory Comput. 2016, 12, 2983–2989. 10.1021/acs.jctc.6b00277. [DOI] [PMC free article] [PubMed] [Google Scholar]
- Couëtoux A.; Hoock J.-B.; Sokolovska N.; Teytaud O.; Bonnard N.. Continuous upper confidence trees. International Conference on Learning and Intelligent Optimization, 2011; pp 433–445.
- Yee T.; Lisỳ V.; Bowling M. H.. Monte Carlo Tree Search in Continuous Action Spaces with Execution Uncertainty. International Joint Conference on Artificial Intelligence, 2016; pp 690–697.
- Ohto K.; Tanaka T.. A Curling Agent Based on the Monte-Carlo Tree Search Considering the Similarity of the Best Action Among Similar States. Advances in Computer Games; Springer, 2017; pp 151–164. [Google Scholar]
- Satoh D.; Shimizu K.; Nakamura S.; Terada T. Folding free-energy landscape of a 10-residue mini-protein, chignolin. FEBS Lett. 2006, 580, 3422–3426. 10.1016/j.febslet.2006.05.015. [DOI] [PubMed] [Google Scholar]
- Neidigh J. W.; Fesinmeyer R. M.; Andersen N. H. Designing a 20-residue protein. Nat. Struct. Mol. Biol. 2002, 9, 425. 10.1038/nsb798. [DOI] [PubMed] [Google Scholar]
- Hornak V.; Abel R.; Okur A.; Strockbine B.; Roitberg A.; Simmerling C. Comparison of multiple Amber force fields and development of improved protein backbone parameters. Proteins Struct. Funct. Bioinfomat. 2006, 65, 712–725. 10.1002/prot.21123. [DOI] [PMC free article] [PubMed] [Google Scholar]
- Jorgensen W. L.; Chandrasekhar J.; Madura J. D.; Impey R. W.; Klein M. L. Comparison of simple potential functions for simulating liquid water. J. Chem. Phys. 1983, 79, 926–935. 10.1063/1.445869. [DOI] [Google Scholar]
- Bussi G.; Donadio D.; Parrinello M. Canonical sampling through velocity rescaling. J. Chem. Phys. 2007, 126, 014101. 10.1063/1.2408420. [DOI] [PubMed] [Google Scholar]
- Parrinello M.; Rahman A. Polymorphic transitions in single crystals: A new molecular dynamics method. J. Appl. Phys. 1981, 52, 7182–7190. 10.1063/1.328693. [DOI] [Google Scholar]
- Essmann U.; Perera L.; Berkowitz M. L.; Darden T.; Lee H.; Pedersen L. G. A smooth particle mesh Ewald method. J. Chem. Phys. 1995, 103, 8577–8593. 10.1063/1.470117. [DOI] [Google Scholar]
- Hess B.; Bekker H.; Berendsen H. J. C.; Fraaije J. G. E. M. LINCS: a linear constraint solver for molecular simulations. J. Comput. Chem. 1997, 18, 1463–1472. . [DOI] [Google Scholar]
- Abraham M. J.; Murtola T.; Schulz R.; Páll S.; Smith J. C.; Hess B.; Lindahl E. GROMACS: High performance molecular simulations through multi-level parallelism from laptops to supercomputers. SoftwareX 2015, 1–2, 19–25. 10.1016/j.softx.2015.06.001. [DOI] [Google Scholar]
- Best R. B.; Hummer G.; Eaton W. A. Native contacts determine protein folding mechanisms in atomistic simulations. Proc. Natl. Acad. Sci. U.S.A. 2013, 110, 17874–17879. 10.1073/pnas.1311599110. [DOI] [PMC free article] [PubMed] [Google Scholar]
- Schaarschmidt J.; Monastyrskyy B.; Kryshtafovych A.; Bonvin A. M. J. J. Assessment of contact predictions in CASP12: Co-evolution and deep learning coming of age. Proteins Struct. Funct. Bioinfomat. 2018, 86, 51–66. 10.1002/prot.25407. [DOI] [PMC free article] [PubMed] [Google Scholar]
- Harada R.; Kitao A. Exploring the Folding Free Energy Landscape of a β-Hairpin Miniprotein, Chignolin, Using Multiscale Free Energy Landscape Calculation Method. J. Phys. Chem. B 2011, 115, 8806–8812. 10.1021/jp2008623. [DOI] [PubMed] [Google Scholar]
- Meuzelaar H.; Marino K. A.; Huerta-Viga A.; Panman M. R.; Smeenk L. E. J.; Kettelarij A. J.; van Maarseveen J. H.; Timmerman P.; Bolhuis P. G.; Woutersen S. Folding dynamics of the Trp-cage miniprotein: evidence for a native-like intermediate from combined time-resolved vibrational spectroscopy and molecular dynamics simulations. J. Phys. Chem. B 2013, 117, 11490–11501. 10.1021/jp404714c. [DOI] [PubMed] [Google Scholar]
- Juraszek J.; Bolhuis P. G. Sampling the multiple folding mechanisms of Trp-cage in explicit solvent. Proc. Natl. Acad. Sci. 2006, 103, 15859–15864. 10.1073/pnas.0606692103. [DOI] [PMC free article] [PubMed] [Google Scholar]
- Kumar S.; Rosenberg J. M.; Bouzida D.; Swendsen R. H.; Kollman P. A. The weighted histogram analysis method for free-energy calculations on biomolecules. I. The method. J. Comput. Chem. 1992, 13, 1011–1021. 10.1002/jcc.540130812. [DOI] [Google Scholar]
- Chodera J. D.; Singhal N.; Pande V. S.; Dill K. A.; Swope W. C. Automatic discovery of metastable states for the construction of Markov models of macromolecular conformational dynamics. J. Chem. Phys. 2007, 126, 155101. 10.1063/1.2714538. [DOI] [PubMed] [Google Scholar]
- Pande V. S.; Beauchamp K.; Bowman G. R. Everything you wanted to know about Markov State Models but were afraid to ask. Methods 2010, 52, 99–105. 10.1016/j.ymeth.2010.06.002. [DOI] [PMC free article] [PubMed] [Google Scholar]
- Prinz J.-H.; Wu H.; Sarich M.; Keller B.; Senne M.; Held M.; Chodera J. D.; Schütte C.; Noé F. Markov models of molecular kinetics: Generation and validation. J. Chem. Phys. 2011, 134, 174105. 10.1063/1.3565032. [DOI] [PubMed] [Google Scholar]
- Browne C. B.; Powley E.; Whitehouse D.; Lucas S. M.; Cowling P. I.; Rohlfshagen P.; Tavener S.; Perez D.; Samothrakis S.; Colton S. A survey of monte carlo tree search methods. IEEE Trans. Comput. Int. AI Games 2012, 4, 1–43. 10.1109/tciaig.2012.2186810. [DOI] [Google Scholar]
- Dieb T. M.; Yoshizoe S.; Hou Z.; Shiomi J.; Tsuda K.; Tsuda K. MDTS: automatic complex materials design using Monte Carlo tree search. Sci. Technol. Adv. Mater. 2017, 18, 498–503. 10.1080/14686996.2017.1344083. [DOI] [PMC free article] [PubMed] [Google Scholar]
- Harada R.; Kitao A. Nontargeted parallel cascade selection molecular dynamics for enhancing the conformational sampling of proteins. J. Chem. Theory Comput. 2015, 11, 5493–5502. 10.1021/acs.jctc.5b00723. [DOI] [PubMed] [Google Scholar]
- Harada R.; Takano Y.; Shigeta Y. Fluctuation Flooding Method (FFM) for accelerating conformational transitions of proteins. J. Chem. Phys. 2014, 140, 03B625_1. 10.1063/1.4869594. [DOI] [PubMed] [Google Scholar]
- Gelly S.; Silver D. Monte-Carlo tree search and rapid action value estimation in computer Go. Art. Intell. 2011, 175, 1856–1875. 10.1016/j.artint.2011.03.007. [DOI] [Google Scholar]
- Chaslot G. M. J.-B.; Winands M. H. M.; HERIK H. J. V. D.; Uiterwijk J. W. H. M.; Bouzy B. Progressive strategies for Monte-Carlo tree search. New Math. Natur. Comput. 2008, 04, 343–357. 10.1142/s1793005708001094. [DOI] [Google Scholar]
- Chaslot G. M. J.-B.; Winands M. H. M.; van Den Herik H. J.. Parallel monte-carlo tree search. International Conference on Computers and Games, 2008; pp 60–71.
- Yoshizoe K.; Kishimoto A.; Kaneko T.; Yoshimoto H.; Ishikawa Y.. Scalable distributed monte-carlo tree search. In Fourth Annual Symposium on Combinatorial Search, 2011.
Associated Data
This section collects any data citations, data availability statements, or supplementary materials included in this article.


