Abstract
In this study, we investigate the adsorption capability of molybdenum sulfide (MoS2)/thiol-functionalized multiwalled carbon nanotube (SH-MWCNT) nanocomposite for rapid and efficient removal of heavy metals [Pb(II) and Cd(II)] from industrial mine water. The MoS2/SH-MWCNT nanocomposite was synthesized by acid treatment and sulfurization of MWCNTs followed by a facile hydrothermal reaction technique using sodium molybdate and diethyldithiocarbamate as MoS2 precursors. Morphological and chemical features of the nanocomposite material were studied using various characterization techniques. Furthermore, the effects of adsorbent (MoS2/SH-MWCNT nanocomposite) concentration, contact time, initial concentration of heavy-metal ions, and reaction temperature were examined to determine the efficiency of the adsorption process in batch adsorption experiments. Kinetics and isotherm studies showed that the adsorption process followed pseudo-second-order and Freundlich adsorption isotherm models, respectively. Thermodynamic parameters calculated using van’t Hoff plots show the spontaneity and endothermic nature of adsorption. MoS2/SH-MWCNT nanocomposite demonstrates a high adsorption capacity for Pb(II) (90.0 mg g–1) and Cd(II) (66.6 mg g–1) following ion-exchange and electrostatic interactions. Metal–sulfur complex formation was identified as the key contributor for adsorption of heavy-metal ions followed by electrostatic interactions for multilayer adsorption. Transformation of adsorbent into PbMoO4–xSx and CdMoO4–xSx complex because of the adsorption process was confirmed by X-ray diffraction and scanning electron microscopy-energy-dispersive spectrometry. The spent adsorbent can further be used for photocatalytic and electrochemical applications; therefore, the generated secondary byproducts can also be employed for other purposes.
1. Introduction
Water is the most needed molecule on the planet and is a source of sustainable life. However, millions of people experience water scarcity on a daily basis. Rapid growth in industrialization, population, and urbanization has also contributed to the severe exponential increase of water pollution because of the disposal of untreated organic/inorganic toxic effluents into fresh waterbodies.1,2 Heavy-metal ions (HMIs) (e.g., Zn, Pb, Hg, Ag, As, Cd, Cr, and Ni) are a class of inorganic pollutants introduced into waterbodies through untreated waste effluents majorly from industries such as mining, fertilizers, batteries, pesticides, refining, tanneries, and paper and are an increasing critical threat to healthy ecosystems.3,4 HMIs introduced into the food chain through contaminated water may be hazardous and life-threatening for humans, animals, and aquatic bodies after exposure to even low concentrations (ppm).5 Due to their toxic nature, long-term persistence, and nonbiodegradable and bioaccumulation behavior, removing HMIs from contaminated wastewater effluents before being discharged to waterbodies has become an important concern.6
Lead [Pb(II)] and cadmium [Cd(II)] are among the most toxic and carcinogenic heavy metals released into the ecosystem through industrial waste effluents.7,8 Pb(II) and Cd(II) are also found to impede plant growth, interrupt uptake and transport, and affect photosynthesis.9 The Environmental Protection Agency has set the maximum permissible exposure limit for Pb(II) and Cd(II) in drinking water, i.e., less than 0.015 and 0.005 mg L–1, respectively.7,10 Thus, even at trace concentrations, they can chronically affect human beings as well as plants. These serious issues have led to the development of advanced methodologies and economically feasible nanomaterials for efficient removal of heavy metals from water.
Several technologies, such as coprecipitation, membrane filtration, reverse osmosis, coagulation, and adsorption, have been employed for the complete removal of HMIs from wastewater.4,11 Among these techniques, adsorption is considered the most favorable because of advantages such as ease of operation, cost-effectiveness, high performance, and application to both small- and large-scale operations.12,13 Numerous adsorbents such as activated carbon,14 biomaterials,15 clay/layered double hydroxides,16,17 hydrogels,18 zeolites,19 silica gel,20 and nanocomposites21,22 have been utilized for HMIs removal from contaminated water. However, these nanoadsorbent materials also present some disadvantages such as low specific active surface area and poor selectivity. Therefore, new promising nanoadsorbents need to be identified for the elimination of HMIs from water sources.
Multiwalled carbon nanotubes (MWCNTs), a carbon family member, are graphite nanosheets rolled into a tubular structure. Because of their high surface area, porosity, ease of functionalization, layered and hollow structure, large-scale production, and light mass density, MWCNTs have gained interest in water purification and are considered as an efficient adsorbent for HMI removal.23 However, the adsorption capacity of pristine MWCNTs has been found to be quite low; for instance, the adsorption capacity of raw MWCNTs was recorded to be 2.94 mg g–1 for Pb(II) removal.24 Grafting functional groups through acid modification, sulfurization, doping with metals, and constructing nanohybrid materials with MWCNTs is the best approach to enhance the adsorption potential of MWCNTs.25
Recently, two-dimensional MoS2 nanosheets have also attracted attention in many applications including adsorption due to their large surface area, excellent chemical and thermal stability, mechanical flexibility, and environmentally friendly nature.26−30 S atoms in MoS2 behave as soft bases and easily form complexes with metal ions such as Pb(II) and Hg(II), which act as soft acids.26,27 However, the absence of functional groups on the surfaces of pristine MoS2 is a major drawback that affects its performance as an adsorbent. In this context, Wang et al.31 constructed MoS2–carbon dot nanohybrids modified with magnetic ferrite as an adsorbent for Pb(II) removal from aqueous solution. MoS2 nanostructures with increased interlayer spacing were also prepared to achieve high uptake of Pb(II) and Hg(II).27,32 Furthermore, MoS2 nanostructures were also modified with other nanomaterials (such as CuS nanosheets and graphene oxide) to enhance the adsorption potential toward targeted pollutants in water.33,34
Based on these observations, herein, MoS2 with thiol-functionalized MWCNT (MoS2/SH-MWCNT) nanocomposite was synthesized following a facile hydrothermal route. During synthesis, intercalation of Na/hydrated Na or SO42– into the MoS2 nanosheets is helpful in the exfoliation of MoS2 nanosheets, which enlarges the specific surface area of the nanocomposite material. MoS2/carbon nanotube (CNT)-based nanocomposites have shown high potential for electrochemical applications, reinforcement of polymers, and in lubrication because of the introduction of advanced characteristics and high surface areas in the nanocomposite material.21−24 However, the possibility of MoS2/MWCNT nanocomposite material as an adsorbent in water treatment is still unexplored.35−38 It is expected that the synergic behavior of MoS2 nanosheets and MWCNTs would enhance the adsorption performance because of excessive active sites. To establish the adsorption capacity of MoS2/SH-MWCNT nanocomposite, the material was used as an adsorbent to remove Pb(II) and Cd(II) from industrial mining water. The results also prove that such nanocomposite can act as a promising adsorbent for future environmental remediation.
2. Results and Discussion
2.1. Structural and Morphological Characterization
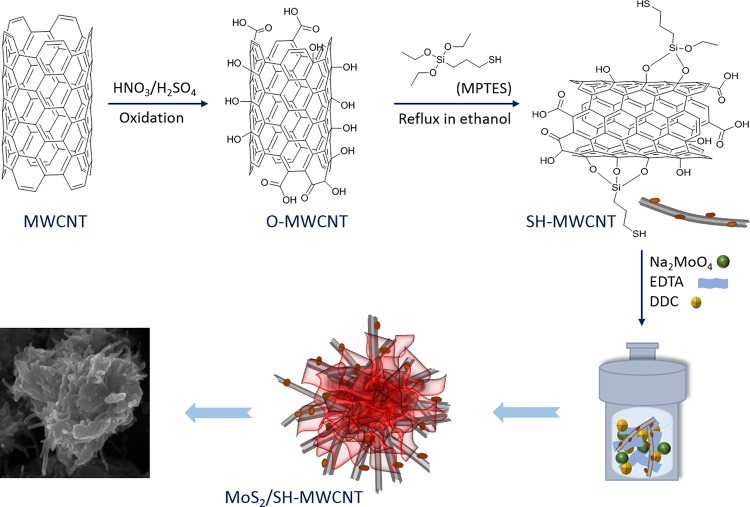
The MoS2/SH-MWCNT nanocomposite was synthesized (Figure 1) following a facile hydrothermal approach using commercially available MWCNTs, mercaptopropyltriethoxysilane (MPES), sodium molybdate, and diethyldithiocarbamate (DDC) as MoS2 precursors. Fourier transform infrared spectra of various samples are presented in Figure S1, Supporting Information (SI). Figure 2a presents the recorded X-ray diffraction (XRD) patterns of the MWCNT, oxygenated MWCNT (O-MWCNT), and MoS2/SH-MWCNT nanocomposite in terms of intensity counts versus 2θ. MWCNT and O-MWCNT diffractograms (JCPDS card no. 75-1621) showed one intense diffraction peak at 2θ = 25.6°, which corresponds to the (002) plane, and one low-intensity peak at 2θ = 43°, which corresponds to the (100) reflection plane, and these peaks were assigned to the graphitic structure. There were no significant changes observed in the 2θ values of the XRD patterns when MWCNTs were oxidized to O-MWCNTs. However, the diffraction peak intensity of O-MWCNTs was found to be higher than that of MWCNTs, which indicates the enhanced crystallinity of O-MWCNTs. This might be due to the removal of amorphous carbon and other impurities during acid treatment of MWCNTs.39 Similar observations were also observed in previous studies.40,41 XRD patterns of the MoS2/SH-MWCNT nanocomposite show peaks at 2θ values of 8.85, 17.53, 32.6, and 57°, which were identified as the (002), (004), (100), and (110) crystal planes of MoS2, respectively. Generally, the XRD of MoS2 shows one intense peak at 14°, which is indexed to the (002) plane representing an interlayer spacing of 6.155 Å between MoS2 nanosheets, along with other diffraction peaks. However, the intercalation into MoS2 nanosheets shifted this peak to a lower diffraction angle (2θ).27,42 Intercalation of Na/hydrated Na or SO42– from DDC into the MoS2 nanosheets expands the interlayer spacing from 6.155 to 10.02 Å and represents the (002) plane diffraction peak at 8.85°. Additionally, the appearance of the 17.53° peak in the XRD spectrum of MoS2/SH-MWCNT nanocomposite is assigned to the (004) plane of MoS2 nanosheets, which confirmed the lattice expansion in MoS2 nanostructures. The XRD spectrum of the MoS2/SH-MWCNT nanocomposite did not show any peaks that could be assimilated to MWCNT, which might be due to the low concentration and low diffraction intensity of MWCNT in the nanohybrid material.43
Figure 1.
Schematic presentation of the synthesis route of the MoS2/SH-MWCNT nanocomposite.
Figure 2.
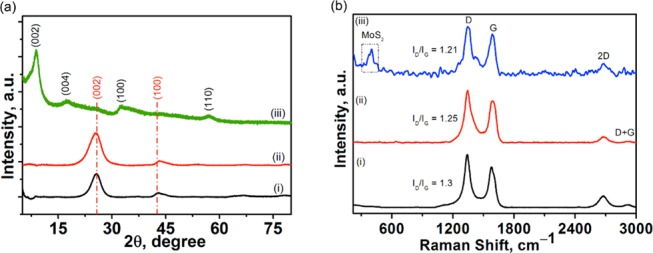
(a) XRD patterns and (b) Raman spectra of (i) MWCNT, (ii) O-MWCNT, and (iii) MoS2/SH-MWCNT nanocomposite.
Similar to XRD patterns, no changes were observed in the Raman spectra of MWCNT after acid treatment (O-MWCNT) (Figure 2b). Raman spectra of the MWCNT and O-MWCNT exhibit two sharp high-frequency bands: (a) a double-resonance Raman mode D-band originated from scattering of local disorder due to the amorphous carbon and defects (sp2-hybridized carbons) at 1345 cm–1 and (b) G-bands associated with the first-order-mode Raman signature, which is characteristic of the graphite structure (sp2-hybridized E2g stretching of carbons) of carbon nanotubes at 1580 cm–1. The intensity ratio (ID/IG) quantitatively illustrates the defects and metrics of carbon nanotubes. O-MWCNT shows a comparatively low ID/IG ratio (1.25) than MWCNT (1.30), which indicates the removal of amorphous carbon and generation of sidewall defects and ordered graphitic sheets after acid treatment of MWCNT.44 These sidewall defects are considered to be caused by the oxidation of MWCNT at the side walls. Additionally, MWCNT and O-MWCNT also exhibit a higher-frequency shoulder at 2680 cm–1 in the second-order region, which represents the 2D band, and the overtone of the D-band but is independent of the defects on the MWCNT. The presence of a D + G-band at 2920 cm–1 strongly supports the highly disordered graphene sheets in MWCNT and O-MWCNT. In addition to the characteristic peaks of MWCNT (D- and G-bands), the Raman spectrum of MoS2/SH-MWCNT nanocomposite also displays two characteristic bands at 401 and 380 cm–1, which are assigned to the out-of-plane (1Ag) and in-plane (1E2g) vibrational modes of MoS2, respectively.33
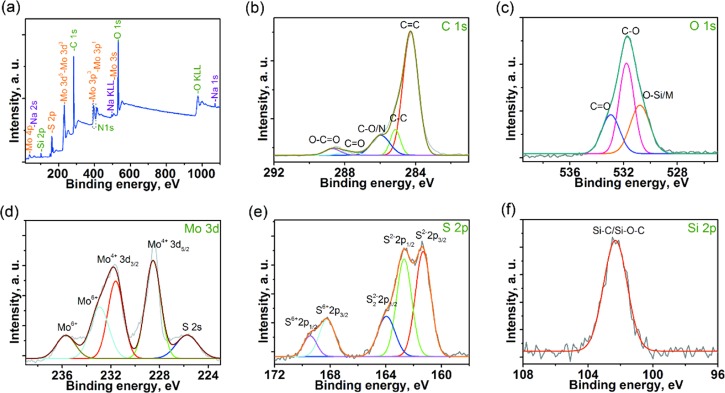
The chemical composition and valence state of constituent elements in MoS2/SH-MWCNT nanocomposite were investigated by recording the full scan survey X-ray photoelectron spectroscopy (XPS) spectrum (Figure 3a), which confirmed the presence of all main elements (Mo, S, C, O, and Si) in the nanocomposite. Furthermore, high-resolution spectra of each element (Figure 3b–f) present in the MoS2/SH-MWCNT nanocomposite were deconvoluted and studied thoroughly. Figure 3b depicts the high-resolution C 1s spectra, which were deconvoluted and fitted into the five major peaks centered at 284.3, 285.1, 285.8, 287.8, and 288.5 eV. The major peak with high intensity at 284.3 eV is assigned to the sp2-hybridized C=C carbons of the MWCNT core skeleton. The following weak peak at 285.1 eV binding energy represents the sp3-hybridized carbons due to the defects on the MWCNT walls and other methylene units from MPES linked to MWCNTs. The other peaks at 285.8 and 287.8 eV indicate the presence of oxygen functionalities, which originate from acid treatment of MWCNT, thus forming C–O and C=O groups, respectively, and also representing the linkage between the MPES and MWCNTS. Another low-intensity peak at a higher binding energy (288.5 eV) was due to the presence of the −COOH functional group derived from the exposure to environmental air. Oxygen functional groups were also further confirmed by the high-resolution XPS image of O 1s (Figure 3c), which was deconvoluted into three peaks at 530.8, 531.7, and 532.9 eV and are attributed to the O–Si/O–Mo, C–O, and C=O functional groups, respectively. These peaks again confirm the successful oxidation of MWCNT through acid treatment and linkage with MPES. In addition, the appearance of an Si 2p XPS peak (Figure 3f) at 102.3 eV reassures the grafting of MPES and MWCNT through Si–O bonds.45Figure 3d,e displays the high-resolution XPS images of Mo (3d) and S (2p) elements. Mo 3d XPS image (Figure 3d) can be resolved into four peaks: 228.5, 231.6, 232.9, and 235.7 eV. The well-resolved doublet at a lower binding energy around 228.5 and 231.6 eV can be ascribed to the Mo4+ 3d3/2 and Mo4+ 3d5/2, respectively, of the 2H-MoS2.30,46 The difference between spin–orbit splitting of these two peaks was found to be 3.1 eV, which is attributed to the Mo4+ oxidation states and reveals the synthesis of MoS2 on MWCNTs. Low-intensity peaks at higher binding energies around 232.9 and 235.7 eV correspond to the Mo6+ 3d, which might be due to the exposure of the nanocomposite to the air and formation of MoO3 or MoO4 as a result of oxidation.47 The XPS image of Mo 3d also exhibits a peak at 225.6 eV, which is due to the divalent S 2s spin orbitals. The S 2p XPS image (see Figure 3e) was deconvoluted into five major peaks centered at 161.3, 162.6, 163.9, 168.2, and 169.4 eV. The existence of two major peaks at 161.3 and 162.6, representing S2– 2p3/2 and S2– 2p1/2 spin orbits, respectively, are ascribed to the S2– of MoS2 nanosheets. One peak at a binding energy of 163.9 eV might be due to the presence of bridging disulfide S22–, which reveals the linkage between the thiol group on MWCNTs and MoS2.48 Two extra peaks at 168.2 and 169.4 eV can be assigned to the S6+ 2p3/2 and S6+ 2p1/2 spin orbitals of SO42–, respectively, which might be attributed to the intercalation of sulfate as Na2SO4/NH4SO4 between MoS2 nanosheets during the synthesis of the MoS2/SH-MWCNT nanocomposite. The intercalation of S(VI) as SO42– can also be supported by the presence of Na (1s and 2p) and N (1s) XPS peaks in the survey spectrum of MoS2/SH-MWCNTs. The observed increased interlayer d-spacing further supports intercalation of Na/hydrated Na or SO42– between MoS2 nanosheets for the MoS2(002) lattice plane in the XRD spectrum of MoS2/SH-MWCNT nanocomposite. The N 1s XPS peak might also be due to the presence of the ethylenediaminetetraacetic acid (EDTA) used during the synthesis of MoS2/SH-MWCNT nanocomposite.
Figure 3.
(a) Full scan survey XPS spectrum and high-resolution (b) C 1s, (c) O 1s, (d) Mo 3d, (e) S 2p, and (f) Si 2p XPS images of MoS2/SH-MWCNT nanocomposite.
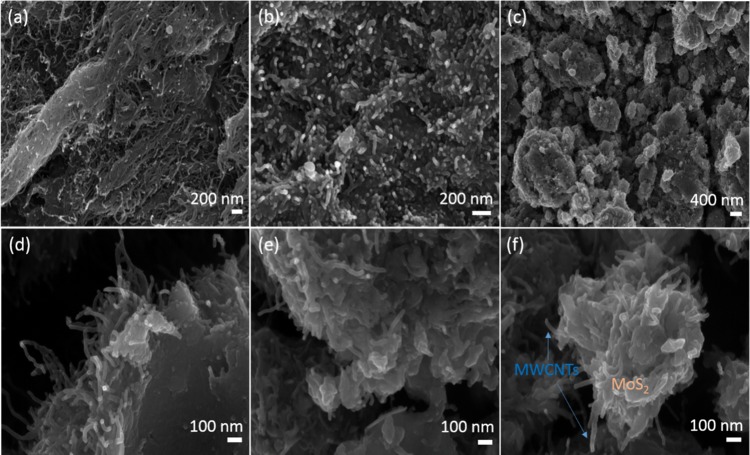
Figure 4 shows the scanning electron microscopy (SEM) images of MWCNTs (Figure 4a) and O-MWCNTs (Figure 4b), which confirm that after acid treatment, MWCNT retains its intact structure and forms interconnected three-dimensional (3D) network with each other. After hydrothermal treatment of SH-MWCNTs with sodium molybdate and DDC to prepare the MoS2/SH-MWCNT nanocomposite material, MoS2 nanosheets (Figure 4c–f) were grown continuously on the MWCNTs network and also wrapped around the outer surface of a few MWCNTs. Such an observation suggests the lateral growth of MoS2 nanosheets along the MWCNTs.
Figure 4.
Field emission SEM images of (a) MWCNTs, (b) O-MWCNTs, and (c–f) MoS2/SH-MWCNT nanocomposite.
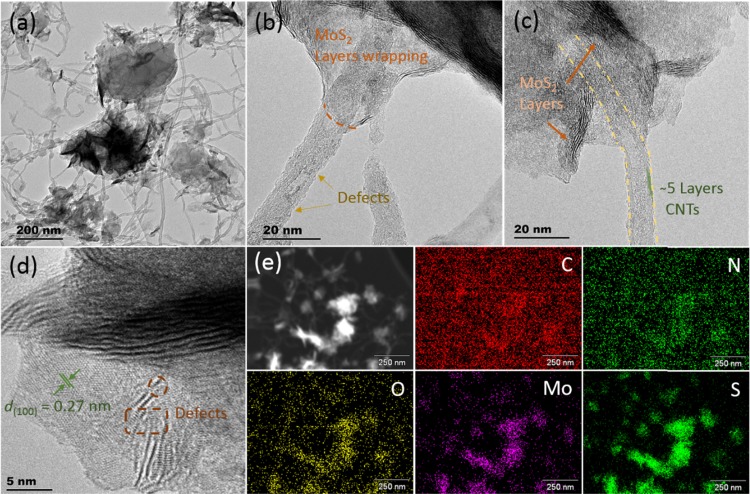
High-resolution transmission electron microscopy (HRTEM) images of the MoS2/SH-MWCNT nanocomposite (Figure 5a–d) reveal the cross-linking 3D network behavior of MWCNTs with few-layered MoS2 nanosheets. The functionalization of MWCNT introduced defects and distortion in MWCNTs (Figure 5b). The outer diameter of MWCNTs was found to be 9–12 nm and composed of 5–10 walls (Figure 5c) inside the nanotube. The distinct lattice fringes in the basal plane of MoS2/SH-MWCNT nanocomposite with an interlayer spacing of 0.27 nm (Figure 5d) are consistent with the (100) crystal lattice plane of MoS2 nanosheets. Irregular wrapping of MoS2 nanosheets on the MWCNTs causes an overlapped crystalline lattice and also creates some crystallographic defects on the surface. Furthermore, the presence of elemental compositions was analyzed by EDX (Figure S2), and elemental mapping was performed at the specific area (Figure 5e), which specified the presence of Mo and S elements for MoS2 along with carbon, nitrogen, and oxygen in the MoS2/SH-MWCNT nanocomposite.
Figure 5.
High-resolution TEM images of (a–c) MoS2/SH-MWCNT nanocomposite and (d) with (100) plane and defects. (e) Elemental mapping of MoS2/SH-MWCNT nanocomposite showing the presence of carbon (C), nitrogen (N), oxygen (O), molybdenum (Mo), and sulfur (S) in the nanocomposite.
The N2 adsorption–desorption isotherm of MWCNT and MoS2/SH-MWCNTs is shown in Figure 6 and was examined to evaluate the surface texture properties, porosity, and pore size distribution. Both isotherms are classified as type IV with a distinctive H3-hysteresis loop at a relative pressure (p/po) ≤ 0.9. This observation indicates the existence of mesoporous and macroporous structures in samples. The sharp increase in the N2 adsorption plot of MWCNTs at a relative pressure (p/po) of >0.9 is attributed to the microporous structure with a 13.7 nm mean pore sizes in the sample.35 In addition, the high surface area (256.22 m2 g–1) with high pore volume (0.877 cm3 g–1) of MWCNTs suggests the availability of more sites for oxidation through acid treatment and functionalization with MPES and co-lateral growth of MoS2. In contrast, the surface area and pore volume of the MoS2/SH-MWCNT nanocomposite were reduced to 40.35 m2 g–1 and 0.196 cm3 g–1, respectively (Table 1). Correspondingly, the pore size distribution also became narrower from MWCNTs (0–240 nm) to MoS2/SH-MWCNT nanocomposite (0–136 nm). The low surface area and pore size distribution of MoS2/SH-MWCNT nanocomposite compared to the MWCNTs suggest successful consumption of active surface sites and partial possession of pore space on MWCNTs.49 Generally, MoS2 exhibited a quite low surface area (<20 m2 g–1).30,50 The boosted surface area in the MoS2/SH-MWCNT nanocomposite is attributed to the exfoliation of the MoS2 nanosheets, which is also consistent with the XRD findings and provides more exposure to the S–Mo–S edges, which contribute to surface applications.
Figure 6.
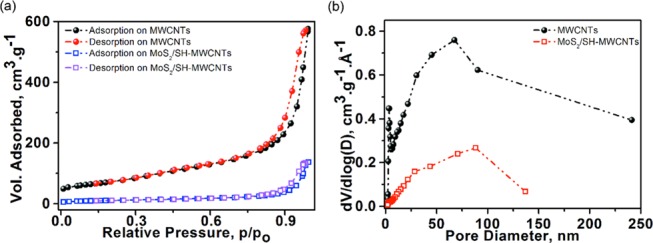
(a) Nitrogen adsorption–desorption isotherms and (b) pore size distribution of MWCNT and MoS2/SH-MWCNT nanocomposite.
Table 1. Surface Area and Porosity of MWCNT and MoS2/SH-MWCNT Nanocomposite.
| sample | surface area (SBET) (m2 g–1) | mean pore volume (cm3 g–1) | mean pore diameter (nm) |
|---|---|---|---|
| MWCNTs | 256.22 | 0.877 | 13.7 |
| MoS2/SH-MWCNT nanocomposite | 40.35 | 0.196 | 19.4 |
2.2. Adsorption of Pb(II) and Cd(II) from Contaminated Mine Waters
2.2.1. Effect of Adsorbent Dosage
The effect of adsorbent dosage (Figure 7a) on heavy-metal-ion removal was investigated using MoS2/SH-MWCNT nanocomposite. Different amounts of MoS2/SH-MWCNT nanocomposite, ranging from 1 to 4 mg mL–1, were introduced into the mine water and stirred for 1 h to adsorb heavy-metal ions. After 60 min of adsorption, the remaining concentrations of Pb(II) and Cd(II) were measured in the mine water. Almost all (≥98%) Pb(II) (Figure S3) was adsorbed within 1 h on using a dose of 2 mg mL–1 of the adsorbent. However, only 80% Cd(II) (Figure S3) could be removed on using 2 mg mL–1 dosages of MoS2/SH-MWCNT nanocomposite in the mine water. Further increase in adsorbent dosage did not improve the adsorption efficiency of Cd(II), which remained almost constant (∼80%). This might be because at large concentrations of adsorbent in the solution, the adsorbent begins to agglomerate and the active sites cannot be properly explored for the adsorption of contaminant from water. In addition, the diffusion paths for contaminants increase.27 Therefore, the optimal concentration of MoS2/SH-MWCNT nanocomposite for further study was determined to be 2 mg mL–1.
Figure 7.
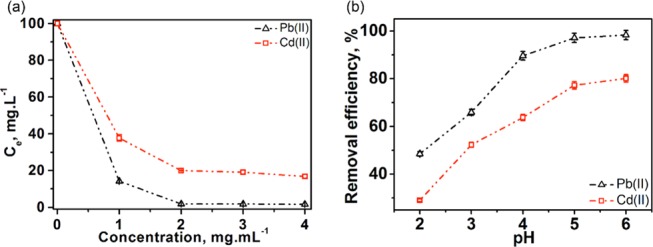
Effect of (a) MoS2/SH-MWCNT nanocomposite dosage and (b) pH on the adsorption of Pb(II) and Cd(II) from mine water. Adsorption conditions: heavy-metal concentration (Co): 100 mg L–1; temperature = 25 °C; and time = 60 min.
2.2.2. Effect of pH
The pH of the solution has a significant impact on the surface charge and degree of ionization of adsorbent, which affects the adsorption potential. To study the effect of pH on the adsorption capacity of MoS2/SH-MWCNT nanocomposite for Pb(II) and Cd(II) removal, adsorption experiments were performed at different pH values ranging from 2 to 6, as shown in Figure 7b. At pH > 6, HMIs start to precipitate as hydroxides; thus, pH experiments were performed at pH range 2−6. Figure 7b shows that at low pH, the removal efficiency of MoS2/SH-MWCNT nanocomposite toward Pb(II) and Cd(II) is quite low and it increases with high pH. This might be because at low pH, most of the free oxygen moieties on the adsorbent get protonated. Consequently, MoS2/SH-MWCNT nanocomposite with protonated positively charged surfaces repels metal ions via electrostatic repulsion and do not participate in complex formation, which results in low metal-ion removal. However, on increasing the pH of the solution, the enhanced removal efficiency of metal ions was due to the accessibility of more adsorption sites on the adsorbent. High Pb(II) (>98%) and Cd(II) (80%) adsorption was observed at pH 6. Therefore, for adsorption experiments, pH 6 was considered as the optimum pH, which was also the actual pH of mine water (Table S1).
2.2.3. Effect of Contact Time and Adsorption Kinetics
The effect of contact time on the adsorption of Pb(II) and Cd(II) (100 mg mL–1) from mine water on MoS2/SH-MWCNT nanocomposite (2 mg mL–1) was observed from 0 to 150 min at room temperature. Figure 8a represents quick adsorption of heavy-metal ions within the initial 10 min contact time between adsorbent and adsorbate. The adsorption then gradually reached an equilibrium stage in approximately 60 min. Fast adsorption might be attributed to the availability of a large number of active binding sites on the MoS2/SH-MWCNT nanocomposite surface. HMIs occupied most of the vacant active surface area within 10 min of the reaction time. The low adsorption rate observed after 10 min of contact time might be due to the progressive decrease of adsorption binding sites on the adsorbent and/or slow diffusion of metal ions into the inner pores. Thus, the optimum contact time was fixed at 60 min for the rest of the adsorption experiments.
Figure 8.
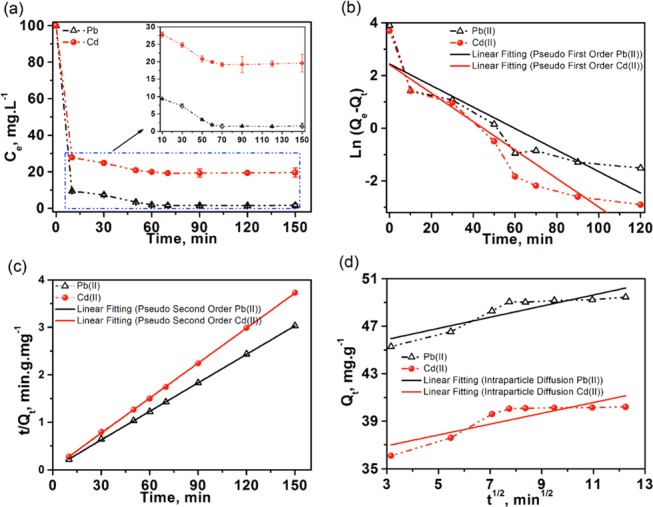
(a) Effect of contact time between adsorbate and adsorbent on the maximum uptake of Pb(II) and Cd(II) using MoS2/SH-MWCNT nanocomposite. (b) Pseudo-first-order, (c) pseudo-second-order, and (d) intraparticle diffusion kinetic models for the adsorption of [Pb(II) and Cd(II)] from mine water using MoS2/SH-MWCNT nanocomposite as adsorbent. Adsorption conditions: Co = 100 mg mL–1; temperature = 25 °C; and adsorbent dosage = 2 mg mL–1.
Furthermore, the metal-ion adsorption rate and mechanism could be described using different kinetic models. Intraparticle diffusion, pseudo-first-order, and pseudo-second-order kinetic models were chosen to study the adsorption kinetics of Pb(II) and Cd(II) on MoS2/SH-MWCNT nanocomposite. Pseudo-first-order kinetics follows the physisorption process, and diffusion was considered as the rate-determining step. Linear pseudo-first-order kinetics is expressed as eq 1
| 1 |
where Qe and Qt are the amount of adsorbed heavy-metal ion (mg g–1) per mass of MoS2/SH-MWCNT nanocomposite at equilibrium and at time t (min), respectively, and k1 is the constant (min–1).
However, in the pseudo-second-order model, the rate-limiting step is usually the chemisorption process, which involves the sharing or exchange of electrons between both interacting adsorbate and adsorbent molecules.51 The linearized equation of the pseudo-second-order model can be described as shown in eq 2
| 2 |
where k2 is the pseudo-second-order kinetics constant.
The intraparticle diffusion model is associated with the diffusion of adsorbate to the inner pores as the rate-determining step and can be described as eq 3
| 3 |
where kid and C signify the rate constant (mg g–1 min–1/2) and constant (mg g–1) for intraparticle diffusion model, respectively.
All kinetics models were plotted following the respective linear equation, and the best-fit model was selected based on the value of the highest determination coefficient (R2). Figure 8b represents the linear plot of pseudo-first-order kinetics [t vs Ln(Qe – Qt)] for Pb(II) and Cd(II) adsorption, exhibiting low R2 values (0.77–0.84). A low R2 value shows that the adsorption of heavy-metal ions using MoS2/SH-MWCNT nanocomposite is not well fitted or follows the pseudo-first-order kinetics. However, linear fitting to t versus t/Qt plot (Figure 8c) with high R2 values (0.99) demonstrated that the adsorption process follows pseudo-second-order kinetics. Moreover, Qe values (Table S2) calculated using the pseudo-second-order adsorption kinetic model were found to be similar to experimental values (calculated using eq 8) of adsorption capacity. Therefore, the adsorption process of heavy-metal ions on MoS2/SH-MWCNT nanocomposite can be well explained by pseudo-second-order kinetics and is governed by chemisorption. An intraparticle diffusion model was also applied to the adsorption of Pb(II) and Cd(II) on MoS2/SH-MWCNT nanocomposite and exhibited low R2 values (0.7–0.78). From Figure 8d, it is evident that the linear fitting of the plot is not passing through the origin, which reveals that the intraparticle diffusion model is not the rate-controlling step during the adsorption process. Figure 8d also showed the multilinearity of the plot, which exhibits two steps. All of the data points of metal-ion adsorption fall on two straight lines, of which the first steep line demonstrated the adsorption of metal ions on the most available vacant sites or the external surface (external diffusion) on the adsorbent, whereas the next step suggests the adsorption or metal-ion diffusion on internal pores (intraparticle diffusion).11 All kinetic parameters calculated for Pb(II) and Cd(II) adsorption on MoS2/SH-MWCNT nanocomposite from the kinetic models are shown in Table S2.
2.2.4. Effect of Initial Heavy-Metal-Ion Concentration and Adsorption Isotherms
The effect of the initial concentration of Pb(II) and Cd(II) in the mine water on the adsorption efficiency of MoS2/SH-MWCNT nanocomposite was also evaluated and is depicted in Figure 9a. The percentage of Pb(II) removal did not differ for all of the initial concentration ranges of Pb(II) in the mine water. High adsorption efficiency of MoS2/SH-MWCNT nanocomposite was observed (99.3%) at 20 mg L–1 initial concentration for Pb(II) in the solution. The % removal of Pb(II) decreased slightly with an increase in initial concentration of solution. However, more visible changes in % metal-ion removal were observed in Cd(II) adsorption. At lower concentration of Cd(II) in the mine water, MoS2/SH-MWCNT nanocomposite absorbs all of the Cd(II) quickly on the available sites because of less competition between the metal ions to be adsorbed on the binding sites. Therefore, at lower concentrations (20–40 mg mL–1), the % removal of Cd(II) was high and almost constant. However, with the increase in the concentration of Cd(II) in the solution, the rate of adsorption was affected by the low ratio of available binding sites to metal-ion concentration, thus leading to a struggle of metal ions to bind on the limited binding sites as binding sites became saturated. A similar trend of adsorption was also observed using 2 mg mL–1 O-MWCNT (Figure S4a) as an adsorbent for different initial concentrations of Pb(II) and Cd(II). However, the % removal of heavy-metal ions using O-MWCNT as the adsorbent was found to be quite lower than that using MoS2/SH-MWCNT nanocomposite (Figure S4b).
Figure 9.
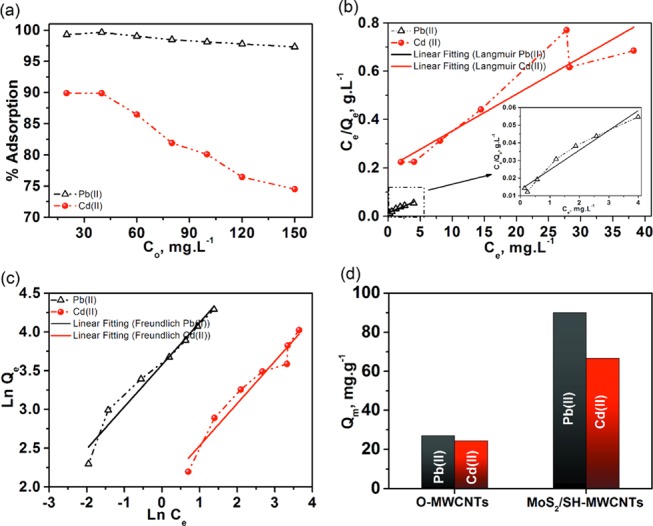
(a) Effect of initial concentrations of Pb(II) and Cd(II) in the solution on the adsorption behavior of MoS2/SH-MWCNT nanocomposite as an adsorbent in terms of % removal of heavy-metal ions. (b) Langmuir and (c) Freundlich adsorption isotherms for the adsorption of [Pb(II) and Cd(II)] from mine water using MoS2/SH-MWCNT nanocomposite as adsorbent. (d) Comparison of adsorption capacity of O-MWCNT and MoS2/SH-MWCNT nanocomposite for Pb(II) and Cd(II). Adsorption conditions: time = 60 min; temperature = 25 °C; and adsorbent dosage = 2 mg mL–1.
The adsorption isotherm was described to understand the adsorption pattern or distribution of adsorbate onto the adsorbent as the adsorption process attained the equilibrium. The adsorption isotherm was fitted to Freundlich, Langmuir, Temkin, and Dubinin–Radushkevich (D–R) isotherm models. The two commonly used isotherm models, i.e., Langmuir and Freundlich, and their experimental adsorption data are explained here briefly. Calculated parameters from all isotherms and their equations are listed in Table S3. The Langmuir isotherm illustrates monolayer adsorption on identical sites of the adsorbent surface with uniform energies of adsorption. It can be expressed with the linear eq 4
| 4 |
where KL and Qm stand for Langmuir constant (L mg–1) and maximum adsorption capacity (mg g–1), respectively.
Similarly, the Freundlich isotherm considers the reversible and multilayer adsorption on heterogeneous adsorption sites associated with different adsorption energies. The Freundlich adsorption isotherm can be represented by eq 5
| 5 |
where Kf denotes the Freundlich isotherm constant (mg g–1)/(mg L–1)1/n, which is associated with the energy of adsorption, and n is the adsorption intensity, which provides details regarding the degree of heterogeneity. 1/n ≤ 1 suggests the feasibility of the adsorption process.
Adsorption data were fit on all studied adsorption isotherms and are displayed in Figures 9b,c, S5, and S6. The best-fitting isotherm model with the highest R2 value could be distinguished among others (Table S2). Experimental data exhibit a better fit to the Freundlich isotherm model (R2 0.86–0.95) than all other studied isotherm models. Such an observation indicates the presence of heterogeneous adsorption sites on the MoS2/SH-MWCNT nanocomposite and the behavior of multilayer coverage. Additionally, a 1/n value using the Freundlich isotherm was calculated to be approximately 0.54, which also shows favorable adsorption characteristics for the adsorption of both [Pb(II) and Cd(II)] metal ions on the MoS2/SH-MWCNT nanocomposite.
Moreover, the adsorption capacities of the MoS2/SH-MWCNT nanocomposite [Qm, mg g–1 = 90 (Pb(II)) and 66.6 (Cd(II))] were also compared to those of O-MWCNT [Qm, mg g–1 = 27.027 (Pb(II)) and 24.4 (Cd(II))] and other adsorbents from the literature (Table 2) for Pb(II) and Cd(II) removal from mine water. These observations suggest the potential of MoS2/SH-MWCNT nanocomposite for heavy-metal-ion uptake from mine water. Adsorption data for Pb(II) and Cd(II) ions on O-MWCNTs were also fitted on Langmuir and Freundlich isotherms, as shown in Figure S7. Unlike the MoS2/SH-MWCNT nanocomposite, O-MWCNTs were found to follow the Langmuir adsorption isotherm with a high correlation coefficient, indicating that the monolayer adsorption occurred on the surface with uniform adsorption energies. The adsorption capacities of MoS2/SH-MWCNT nanocomposite were found to be significantly higher than those of O-MWCNT nanocomposite (Figure 9d), which might be attributed to the additional functional groups (S, O, and C) in the MoS2/SH-MWCNT nanocomposite, which promotes the formation of lead–sulfur complexes. In addition, the excellent adsorption potential of MoS2/SH-MWCNT nanocomposite toward metal ions was supported by measuring the surface charge using ζ potential. ζ potential values for O-MWCNT and MoS2/SH-MWCNT nanocomposite were found to be −26.9 and −54.65, respectively (Figure S8). The MoS2/SH-MWCNT nanocomposite shows a comparatively high negatively charged surface, which supports the high interaction with metal ions with higher adsorption capacities. Furthermore, the nature of the adsorption process was also explained using Temkin and Dubinin–Kaganer–Radushkevich (DKR) isotherms. A positive heat of adsorption (β) value (Table S3 and Figure S5) from the Temkin isotherm supports the endothermic behavior of adsorption,52 and the calculated value of E (mean free energy) from the (D–R) isotherm (E > 8 kJ mol–1) also suggests the chemisorption nature of adsorption.13 Therefore, these observations proposed multilayer adsorption of metal ions on heterogeneous sites following chemisorption.
Table 2. Comparison of Pb(II) and Cd(II) Removal from Industrial Wastewater Using Different Adsorbents.
| adsorption capacity (mg g–1) |
|||
|---|---|---|---|
| adsorbent | Pb(II) | Cd(II) | references |
| waste mud | 24.4 | (53) | |
| chitin-based Chitorem SC-80 | 1.2 | 1.81 | (54) |
| chitosan | 58.71 | (55) | |
| iron oxide-coated sludge | 42.4 | 14.7 | (56) |
| iron slag | 95.24 | (57) | |
| steel slag | 32.26 | (57) | |
| xanthate-modified apple pomace | 178 | 112 | (58) |
| polyacrylamido-2-methyl-1-propane sulfonic acid | 0.4–4.3 | 0.19–0.52 | (59) |
| peanut husk powder | 27.03 | 11.36 | (60) |
| shoe material type I | 60 | (61) | |
| shoe material type II | 85 | (61) | |
| O-MWCNT | 27.07 | 24.4 | this study |
| MoS2/SH-MWCNTs | 90.0 | 66.67 | this study |
2.2.5. Effect of Temperature and Thermodynamic Analysis
Temperature is also one of the key parameters to monitor the adsorption efficiency of adsorbents. The increases in reaction temperature affect the solubility of the heavy-metal ions in the solution and also the kinetic energy. Therefore, the effect of adsorption temperature on the removal of metal ions from mine water using MoS2/SH-MWCNT nanocomposite was also investigated. Figure 10a shows that with an increase in temperature from 25 to 55 °C, the adsorption of metal ions also increases. Other nanoadsorbents in the literature have also shown the same behavior for heavy-metal-ion adsorption with temperature.62,63 This kind of behavior suggests that the adsorption process is endothermic, which is consistent with the Temkin isotherm observations, as explained in the previous section. One of the possible reasons could be the high mobility of metal ions due to enhanced thermal energy, which further supports the diffusivity of metal ions from the external layer to the internal pores of MWCNTs.64 Increases in temperature also open the network structure of the nanoadsorbent by providing the required activation energy and make it more convenient for the adsorbate to pass through and be adsorbed on the internal structure. In addition, the high temperature of the reaction medium leads to deprotonation of the functional groups (e.g., carboxylic acid) present on the adsorbent surface, which provide favorable spots for metal-ion bindings.65
Figure 10.
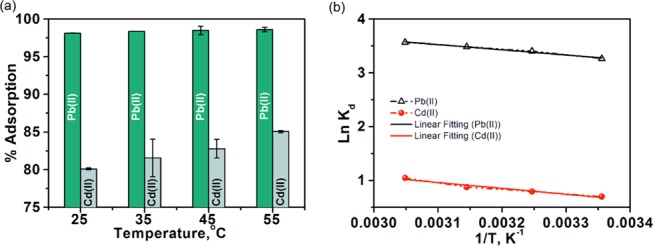
Effect of temperature of the solution on the % removal of heavy-metal ions [Pb(II) and Cd(II)] from mine water using MoS2/SH-MWCNT nanocomposite as the adsorbent and (b) linear thermodynamic plot of Ln Kd vs 1/T for the adsorption of heavy-metal ions onto the MoS2/SH-MWCNT nanocomposite. Adsorption conditions: Co = 100 mg mL–1; time = 60 min; and adsorbent dosage = 2 mg mL–1.
Additionally, to understand the effect of temperature on adsorption behavior, three thermodynamic parameters, i.e., Gibb’s free energy (ΔG°), entropy (ΔS°), and enthalpy (ΔH°), were calculated following eqs 6 and 7
| 6 |
| 7 |
where Kd is the thermodynamic constant representing metal-ion distribution at T temperature (K) and can be calculated by the ratio of metal-ion adsorption capacity to the remaining metal-ion concentration in the solution (Qe/Ce), and R is the universal gas constant (8.314 J mol–1 K–1).
Equation 7 was used to construct van’t Hoff plots (Ln Kd vs 1/T) (Figure 10b) for Pb(II) and Cd(II) adsorption on MoS2/SH-MWCNT nanocomposite, which helped to calculate the ΔS° and ΔH° values using intercept and slope, respectively. All of the calculated thermodynamic parameters for Pb(II) and Cd(II) adsorption are summarized in Table 3.
Table 3. Thermodynamics Parameters for the Adsorption of Heavy-Metal Ions on MoS2/SH-MWCNT Nanocomposite at Various Temperatures.
| metal ion | temperature (°C) | ΔG° (kJ mol–1) | ΔH° (kJ mol–1) | ΔS° (J mol–1 k–1) |
|---|---|---|---|---|
| Pb(II) | 25 | –8.12 | 8.06 | 54.3 |
| 35 | –8.66 | |||
| 45 | –9.2 | |||
| 55 | –9.75 | |||
| Cd(II) | 25 | –0.786 | 9.076 | 36.13 |
| 35 | –1.87 | |||
| 45 | –2.41 | |||
| 55 | –2.77 |
Positive ΔH° values from the van’t Hoff plot further confirm the endothermic behavior of the adsorption process; hence, the amount of adsorption increases with increasing temperature.66 Positive ΔS° values indicate the degree of freedom and increased randomness of the adsorbate molecules at the solid–liquid interface. Negative ΔG° values at all temperature conditions revealed the feasibility and spontaneity of the adsorption process. A continuous decrease in ΔG° value with increased temperature suggests that the adsorption process is more promising at high-temperature values.
2.3. Adsorption Mechanism
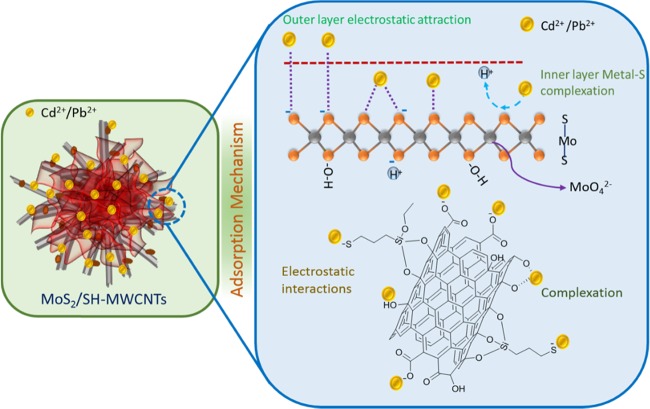
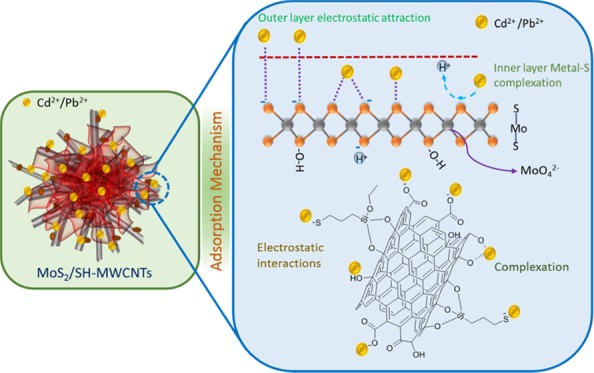
Figure 11 illustrates the adsorption mechanism of metal ions on MoS2/SH-MWCNT nanocomposite. Isotherm studies revealed that the adsorption follows the Freundlich adsorption isotherm and hence obeys multilayer adsorption of Pb(II) and Cd(II) on MoS2/SH-MWCNT nanocomposite. Inner layer adsorption of metal ions on MoS2/SH-MWCNT nanocomposite can be attributed to the formation of the metal–sulfur complex between the Pb(II)/Cd(II) ion and sulfur present on the MoS2 in the aqueous solution through the exchange of H+ ions. In addition, the negatively charged surface of the MoS2/SH-MWCNT nanocomposite (Figure S8) as determined using the ζ potential analyzer favored the electrostatic interaction between the positively charged heavy metals and the negatively charged adsorbent. Therefore, the multilayer adsorption of metal ions is associated with the electrostatic interaction between the Pb(II)/Cd(II) metal ions and the negatively charged functional groups (such as −COO–, –OH, and –SH) on the adsorbent. The formation of the metal–sulfur complex through ion-exchange and electrostatic interactions is considered to be the plausible mechanistic approach for metal-ion adsorption on MoS2/SH-MWCNT nanocomposite. A similar adsorption mechanism following metal–sulfur complex formation was also illustrated in a previous study for heavy-metal removal using MoS2 as an adsorbent.26,27
Figure 11.
Diagrammatic illustration of Pb(II) and Cd(II) adsorption mechanism on MoS2/SH-MWCNTs.
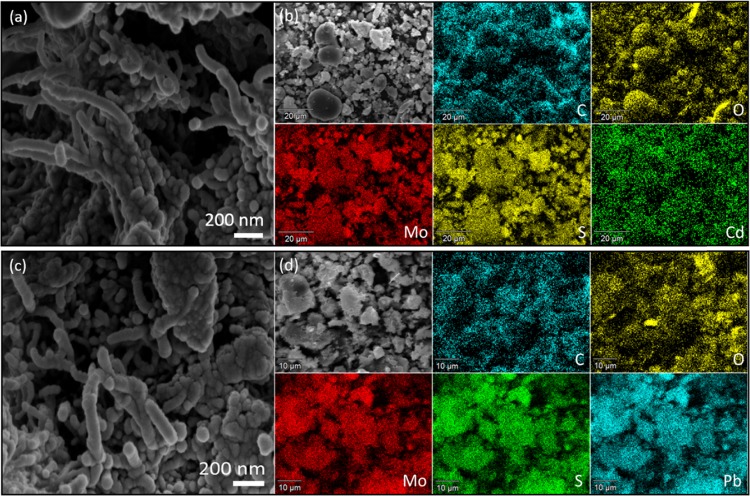
To gain more insights into the adsorption mechanism of Pb(II) and Cd(II) on adsorbent (MoS2/SH-MWCNT nanocomposite), XRD and SEM-energy-dispersive spectrometry (EDS) measurements of nanocomposite samples were obtained after the adsorption experiments. On comparing the XRD patterns of MoS2/SH-MWCNT nanocomposite (Figure 2a) before and after adsorption of HMIs [Pb(II) and Cd(II)] (Figure S9), significant changes were observed along with previous peaks, suggesting the transformation of MoS2/SH-MWCNT nanocomposite after adsorption. The intensity of the MoS2 diffraction peak at the (002), (004), and (100) lattice planes is reduced, indicating the intercalation of heavy metal into the layers of nanostructured materials through ion-exchange reaction.67 Because of the low diffraction intensity of MWCNTs, the characteristic peaks of MWCNTs could not be traced in the XRD pattern. Additional major diffraction peaks in Pb(II)-adsorbed MoS2/SH-MWCNT nanocomposite were found to be in good agreement with JCPDS file no. 44-148668 suggesting the conversion of Pb(II)-adsorbed MoS2/SH-MWCNT nanocomposite into PbMoO4–xSx following the ion-exchange mechanism. The other low-intensity peaks were associated with metastable phases. Similarly, the XRD pattern for Cd(II)-adsorbed MoS2/SH-MWCNT nanocomposite also exhibited additional significant peaks, which correspond to the CdMoO4–xSx (JCPDS no. 07-0209).69 The additional peaks in the sample are related to CdS nanoparticles (NPs). Moreover, the conversion of MoS2/SH-MWCNT nanocomposite into PbMoO4–xSx and CdMoO4–xSx after adsorption is also consistent with the findings of the adsorption isotherm (D–R isotherm) and kinetic (pseudo-second-order) models, which proposed that the adsorption process occurs via chemisorption by sharing of electrons. Similar XRD patterns of Pb(II)-adsorbed MoS2 nanocomposite suggesting the formation of PbMoO4 after adsorption have also been reported in the literature.27,70 The morphological changes after adsorption were studied using SEM and EDX mapping (Figure 12). SEM images of Cd(II)-adsorbed MoS2/SH-MWCNT nanocomposite exhibited CdMoO4–xSx and CdS NPs besides MWCNTs (Figure 12a,b). EDS maps highlight the uniform dissemination of C, Mo, O, Cd, and S throughout the sample. Similarly, MoS2 in nanocomposite is converted to PbMoO4–xSx NPs in the presence of Pb(II) ions (Figure 12c,d). EDS maps of Pb(II)-adsorbed MoS2/SH-MWCNT nanocomposite also support the conversion. PbMoO4 and CdMoO4 are already well-reported photocatalysts and have been employed in several photocatalytic applications.71,72 Recently, Kumar et al.27 have confirmed the formation of PbMoO4–xSx NPs after adsorption of Pb(II) on MoS2 nanocomposite and successfully utilized them for the photocatalytic degradation of ciprofloxacin. Therefore, after adsorption, the generated heavy-metal-ion-loaded MoS2/SH-MWCNT nanocomposite can further be engaged in photocatalytic approaches.
Figure 12.
SEM images of Cd(II) (a, b) and Pb(II) (c, d) adsorbed MoS2/SH-MWCNT nanocomposite, followed by EDS mapping.
3. Conclusions
In summary, MoS2/SH-MWCNT nanocomposite was successfully prepared following a facile hydrothermal approach. Enhanced interlayer spacing of MoS2 nanosheets was achieved by intercalation of Na or hydrated Na and NaSO4 using DDC as a sulfur source. HRTEM analyses revealed that MoS2/SH-MWCNT nanocomposite exhibits cross-linking 3D network behavior of thiol-functionalized MWCNTs of 9–12 nm diameter with 5–10 walls and few-layered MoS2 nanosheets. The characteristics of the adsorption of heavy-metal ions [Pb(II) and Cd(II)] on MoS2/SH-MWCNT nanocomposite were thoroughly investigated using mining industry wastewater. The increased interlayered spacing between the MoS2 sheets supports more exposure of accessible sulfur sites for adsorption of heavy-metal ions via metal–sulfur complex formation. Effects of various adsorption parameters such as contact time, adsorbent dosage, initial concentration of adsorbate, and temperature were also studied. Higher adsorption capacities of MoS2/SH-MWCNT nanocomposite [Pb(II) = 90.0 mg g–1 and Cd(II) = 66.6 mg g–1] compared to O-MWCNTs [Qm, mg g–1 = 27.027 (Pb(II)) and 24.4 (Cd(II))] support the role of MoS2 in the adsorption efficiency. The adsorption process was found to be best fitted to the Freundlich isotherm and pseudo-second-order kinetic model, revealing a multilayer chemisorption process. High adsorption efficiency of MoS2/SH-MWCNT nanocomposite toward heavy-metal ions is the combined effect of ion-exchange, electrostatic interactions, and complex formation between the adsorbate and adsorbent. Temkin isotherm and thermodynamic studies of the adsorption process indicate the endothermic behavior of adsorption. The higher negative ζ potential caused the superior adsorption of heavy-metal ions on MoS2/SH-MWCNT nanocomposite. The formation of PbMoO4–xSx and CdMoO4–xSx NPs after adsorption of Pb(II) and Cd(II) on MoS2/SH-MWCNT nanocomposite can further be applied in photocatalytic approaches and revealed the potential of the nanocomposite for secondary waste treatment.
4. Experimental Section
4.1. Materials
Mercaptopropyltriethoxysilane (MPES, 95%), sodium molybdate dihydrate (Na2MoO4·2H2O, >99%), ethylenediaminetetraacetic acid (EDTA, >99), sodium diethyldithiocarbamate (DDC, Na as Na2SO4 30.5–32.5%), lead nitrate [Pb(NO3)2, >99%], and cadmium acetate dihydrate [Cd(CH3COO)2·2H2O, 98%] were procured from Sigma-Aldrich, South Africa. Multiwalled carbon nanotubes (MWCNTs, NC7000 series) were purchased from NANOCYL SA (Belgium). Ethanol (99.9%), sulfuric acid (H2SO4, 98%), and nitric acid (HNO3, 37%) were obtained from Minema Chemicals, South Africa.
4.2. Functionalization of MWCNTs
Surface oxidation of pristine MWCNTs was performed using H2SO4 and HNO3. In a typical process, 1.0 g of pristine MWCNT was added in a 100 mL mixture of 3:1 (v/v) H2SO4 (98%) and HNO3 (37%) and bath-sonicated for 10 min. Sonication promotes the disentanglement and uniform dispersion of MWCNT in the acid solution. Subsequently, this mixture was allowed to reflux at 80 °C for 8 h to introduce oxygen moieties onto the surface of MWCNT such as carboxylic acid and hydroxyl functional groups. After oxidation treatment, the reaction was quenched and diluted on adding 1.0 L of distilled water. Oxygenated MWCNT (O-MWCNT) was collected through centrifugation, and all of the undigested acid was removed by washing O-MWCNT with distilled water. Wet cake of O-MWCNT was dried in a vacuum oven at 55 °C.
In the next step, silanization of O-MWCNTs was performed by dispersing 2.0 g of O-MWCNT in ethanol following bath sonication for 30 min. Concurrently, 10 mL of MPES was added to the solution dropwise with magnetic stirring at room temperature. The reaction solution was refluxed at 70 °C for 12 h with continuous stirring. Ethoxy groups of MPES are prone to interact with the hydroxyl and carboxylic groups on O-MWCNTs and form thiol-terminated SH-MWCNT. After 12 h, the reaction was allowed to cool naturally to room temperature, and silanized MWCNT (SH-MWCNT) was collected via centrifugation. Wet cake of MWCNTs-SH was washed with ethanol followed by distilled water and dried in an oven at 60 °C at reduced pressure.
4.3. Synthesis of Hierarchical MoS2/SH-MWCNT Nanocomposite
To prepare the MoS2/SH-MWCNT nanocomposite, 5.0 g of sodium molybdate dihydrate and 5.0 g of EDTA were added to the 90 mL SH-MWCNT dispersion in distilled water, and the pH of the reaction mixture was tuned to 9 using 1 M NaOH. The SH-MWCNT nanocomposite dispersion in water was achieved by sonication of 1.0 g of SH-MWCNTs in 90 mL of distilled water for 2 h. Sodium DDC (5.0 g) was also added to the solution as a sulfur source to synthesize MoS2, and the mixture was stirred for 1 h. Subsequently, the reaction mixture was transferred into a Teflon-lined hydrothermal chamber securely covered by a stainless steel jacket. Hydrothermal treatment was performed at 200 °C for 24 h. Later, the reaction was cooled at room temperature and centrifuged to collect the MoS2/SH-MWCNT as a reaction product. MoS2/SH-MWCNT was washed four times with distilled water to remove all indigested chemicals and byproducts and dried at 90 °C in an oven for 24 h.
4.4. Adsorption of Heavy-Metal Ions [Pb(II) and Cd(II)] from Mine Water
To address the real practical application, water from a mine drainage from Potchefstroom, South Africa, was collected and studied for the removal of heavy-metal ions [Pb(II) and Cd(II)] using MoS2/SH-MWCNT nanocomposite via a batch adsorption process. The concentrations of all possible heavy-metal ions in the mine drainage water were evaluated (Table S1) via full scan by an inductively coupled plasma atomic emission spectrometer (ICP-AES). Precisely, removal of Pb(II) and Cd(II) metal ions was the focus; therefore, their concentration in mine drainage water was spiked up to 100 mg L–1. Initially, several experiments were run to optimize the dosage of the adsorbent required for the maximum uptake of the metal ions from mine water. A dose of 2 mg mL–1 was considered as optimum and was gently mixed in mine water for 60 min using a magnetic stirrer for adsorption of the heavy-metal ions. Pb(II) and Cd(II) concentrations in mine water were checked before and after adsorption using ICP-AES. All adsorption experiments were conducted in triplicate, and the average of those results was considered with an error bar. Adsorption isotherm experiments for Pb(II) and Cd(II) adsorption were performed to calculate the maximum adsorption capacity of the adsorbent (2 mg mL–1, O-MWCNTs and MoS2/SH-MWCNT nanocomposite) using various concentrations of Pb(II) and Cd(II) (20, 40, 60, 80, 100, 120, and 150 mg L–1) in mine water. Kinetics of Pb(II) and Cd(II) adsorption were investigated using 2 mg mL–1 MoS2/SH-MWCNT nanocomposite in 100 mL of mine water with 100 mg L–1 concentration of either Pb(II) and Cd(II), which was stirred vigorously at room temperature for 150 min. The remaining concentration of heavy-metal ions at different contact times (10, 30, 50, 70, 90, 120, and 150 min) with adsorbent was determined to evaluate the kinetic data. To determine the thermodynamic parameters of the adsorption process, the adsorption of Pb(II) and Cd(II) onto MoS2/SH-MWCNT nanocomposite was also explored at various temperatures (25, 35, 45, and 55 °C).
Adsorption capacity at equilibrium (Qe, mg g–1) and removal efficiency of heavy-metal ions (%) were calculated following eqs 8 and 9, respectively
| 8 |
| 9 |
where Co and Ce (mg L–1) are the initial and equilibrium concentrations of heavy metals in the solution, respectively. V symbolizes the volume of mine water (mL) taken for the adsorption study, and m denotes the weight (g) of adsorbent used.
Acknowledgments
The authors acknowledge Department of Science and Technology (HGERA8X), Council for Scientific and Industrial Research (HGER74P), and University of Johannesburg (86310) for financial support.
Supporting Information Available
The Supporting Information is available free of charge on the ACS Publications website at DOI: 10.1021/acsomega.9b01603.
Detailed characterization of MoS2/SH-MWCNT nanocomposite before and after adsorption; Temkin adsorption and Dubinin–Radushkevich (D–R) adsorption isotherms; ζ potential of O-MWCNT and MoS2/SH-MWCNT nanocomposite; and various kinetic and isotherm parameter values (PDF)
The authors declare no competing financial interest.
Supplementary Material
References
- Bolisetty S.; Peydayesh M.; Mezzenga R. Sustainable technologies for water purification from heavy metals: review and analysis. Chem. Soc. Rev. 2019, 48, 463–487. 10.1039/c8cs00493e. [DOI] [PubMed] [Google Scholar]
- Zhang Y.; Almodovar-Arbelo N. E.; Weidman J. L.; Corti D. S.; Boudouris B. W.; Phillip W. A. Fit-for-purpose block polymer membranes molecularly engineered for water treatment. npj Clean Water 2018, 1, 2 10.1038/s41545-018-0002-1. [DOI] [Google Scholar]
- Schaider L. A.; Senn D. B.; Estes E. R.; Brabander D. J.; Shine J. P. Sources and fates of heavy metals in a mining-impacted stream: Temporal variability and the role of iron oxides. Sci. Total Environ. 2014, 490, 456–466. 10.1016/j.scitotenv.2014.04.126. [DOI] [PMC free article] [PubMed] [Google Scholar]
- Sharma S.; Bhattacharya A. Drinking water contamination and treatment techniques. Appl. Water Sci. 2017, 7, 1043–1067. 10.1007/s13201-016-0455-7. [DOI] [Google Scholar]
- Singh A.; Sharma R. K.; Agrawal M.; Marshall F. M. Health risk assessment of heavy metals via dietary intake of foodstuffs from the wastewater irrigated site of a dry tropical area of India. Food Chem. Toxicol. 2010, 48, 611–619. 10.1016/j.fct.2009.11.041. [DOI] [PubMed] [Google Scholar]
- Wan Ngah W. S.; Hanafiah M. A. K. M. Removal of heavy metal ions from wastewater by chemically modified plant wastes as adsorbents: A review. Bioresour. Technol. 2008, 99, 3935–3948. 10.1016/j.biortech.2007.06.011. [DOI] [PubMed] [Google Scholar]
- Shen L.-L.; Zhang G.-R.; Li W.; Biesalski M.; Etzold B. J. M. Modifier-free microfluidic Electrochemical Sensor for Heavy-Metal Detection. ACS Omega 2017, 2, 4593–4603. 10.1021/acsomega.7b00611. [DOI] [PMC free article] [PubMed] [Google Scholar]
- Balistrieri L. S.; Mebane C. A.; Cox S. E.; Puglis H. J.; Calfee R. D.; Wang N. Potential Toxicity of Dissolved Metal Mixtures (Cd, Cu, Pb, Zn) to Early Life Stage White Sturgeon (Acipenser transmontanus) in the Upper Columbia River, Washington, United States. Environ. Sci. Technol. 2018, 52, 9793–9800. 10.1021/acs.est.8b02261. [DOI] [PubMed] [Google Scholar]
- Afolayan A. O.Accumulation of Heavy Metals from Battery Waste in Topsoil, Surface Water, and Garden Grown Maize at Omilende Area, Olodo, Nigeria. Global Challenges 2018, 21700090. 10.1002/gch2.201700090 [DOI] [PMC free article] [PubMed] [Google Scholar]
- Sun D. T.; Peng L.; Reeder W. S.; Moosavi S. M.; Tiana D.; Britt D. K.; Oveisi E.; Queen W. L. Rapid, Selective Heavy Metal Removal from Water by a Metal–Organic Framework/Polydopamine Composite. ACS Cent. Sci. 2018, 4, 349–356. 10.1021/acscentsci.7b00605. [DOI] [PMC free article] [PubMed] [Google Scholar]
- Kumar N.; Mittal H.; Alhassan S. M.; Ray S. S. Bionanocomposite Hydrogel for the Adsorption of Dye and Reusability of Generated Waste for the Photodegradation of Ciprofloxacin: A Demonstration of the Circularity Concept for Water Purification. ACS Sustainable Chem. Eng. 2018, 6, 17011–17025. 10.1021/acssuschemeng.8b04347. [DOI] [Google Scholar]
- Peng W.; Li H.; Liu Y.; Song S. A review on heavy metal ions adsorption from water by graphene oxide and its composites. J. Mol. Liq. 2017, 230, 496–504. 10.1016/j.molliq.2017.01.064. [DOI] [Google Scholar]
- Kumar N.; Mittal H.; Parashar V.; Ray S. S.; Ngila J. C. Efficient removal of rhodamine 6G dye from aqueous solution using nickel sulphide incorporated polyacrylamide grafted gum karaya bionanocomposite hydrogel. RSC Adv. 2016, 6, 21929–21939. 10.1039/C5RA24299A. [DOI] [Google Scholar]
- Luo X.; Lei X.; Cai N.; Xie X.; Xue Y.; Yu F. Removal of Heavy Metal Ions from Water by Magnetic Cellulose-Based Beads with Embedded Chemically Modified Magnetite Nanoparticles and Activated Carbon. ACS Sustainable Chem. Eng. 2016, 4, 3960–3969. 10.1021/acssuschemeng.6b00790. [DOI] [Google Scholar]
- Koley P.; Sakurai M.; Aono M. Controlled Fabrication of Silk Protein Sericin Mediated Hierarchical Hybrid Flowers and Their Excellent Adsorption Capability of Heavy Metal Ions of Pb(II), Cd(II) and Hg(II). ACS Appl. Mater. Interfaces 2016, 8, 2380–2392. 10.1021/acsami.5b11533. [DOI] [PubMed] [Google Scholar]
- Kong Y.; Wang L.; Ge Y.; Su H.; Li Z. Lignin xanthate resin–bentonite clay composite as a highly effective and low-cost adsorbent for the removal of doxycycline hydrochloride antibiotic and mercury ions in water. J. Hazard. Mater. 2019, 368, 33–41. 10.1016/j.jhazmat.2019.01.026. [DOI] [PubMed] [Google Scholar]
- Kumar N.; Reddy L.; Parashar V.; Ngila J. C. Controlled synthesis of microsheets of ZnAl layered double hydroxides hexagonal nanoplates for efficient removal of Cr(VI) ions and anionic dye from water. J. Environ. Chem. Eng. 2017, 5, 1718–1731. 10.1016/j.jece.2017.03.014. [DOI] [Google Scholar]
- Ma J.; Zhou G.; Chu L.; Liu Y.; Liu C.; Luo S.; Wei Y. Efficient Removal of Heavy Metal Ions with An EDTA Functionalized Chitosan/Polyacrylamide Double Network Hydrogel. ACS Sustainable Chem. Eng. 2017, 5, 843–851. 10.1021/acssuschemeng.6b02181. [DOI] [Google Scholar]
- Huang Y.; Zeng X.; Guo L.; Lan J.; Zhang L.; Cao D. Heavy metal ion removal of wastewater by zeolite-imidazolate frameworks. Sep. Purif. Technol. 2018, 194, 462–469. 10.1016/j.seppur.2017.11.068. [DOI] [Google Scholar]
- Niu Y.; Qu R.; Sun C.; Wang C.; Chen H.; Ji C.; Zhang Y.; Shao X.; Bu F. Adsorption of Pb(II) from aqueous solution by silica-gel supported hyperbranched polyamidoamine dendrimers. J. Hazard. Mater. 2013, 244–245, 276–286. 10.1016/j.jhazmat.2012.11.042. [DOI] [PubMed] [Google Scholar]
- Alqadami A. A.; Naushad M.; Abdalla M. A.; Ahamad T.; Abdullah Alothman Z.; Alshehri S. M.; Ghfar A. A. Efficient removal of toxic metal ions from wastewater using a recyclable nanocomposite: A study of adsorption parameters and interaction mechanism. J. Cleaner Prod. 2017, 156, 426–436. 10.1016/j.jclepro.2017.04.085. [DOI] [Google Scholar]
- Zhao X.-R.; Xu X.; Teng J.; Zhou N.; Zhou Z.; Jiang X.-Y.; Jiao F.-P.; Yu J.-G. Three-dimensional porous graphene oxide-maize amylopectin composites with controllable pore-sizes and good adsorption-desorption properties: Facile fabrication and reutilization, and the adsorption mechanism. Ecotoxicol. Environ. Saf. 2019, 176, 11–19. 10.1016/j.ecoenv.2019.03.069. [DOI] [PubMed] [Google Scholar]
- Ihsanullah; Abbas A.; Al-Amer A. M.; Laoui T.; Al-Marri M. J.; Nasser M. S.; Khraisheh M.; Atieh M. A. Heavy metal removal from aqueous solution by advanced carbon nanotubes: Critical review of adsorption applications. Sep. Purif. Technol. 2016, 157, 141–161. 10.1016/j.seppur.2015.11.039. [DOI] [Google Scholar]
- Vuković G. D.; Marinković A. D.; Škapin S. D.; Ristić M. Đ.; Aleksić R.; Perić-Grujić A. A.; Uskoković P. S. Removal of lead from water by amino modified multi-walled carbon nanotubes. Chem. Eng. J. 2011, 173, 855–865. 10.1016/j.cej.2011.08.036. [DOI] [Google Scholar]
- Sarkar B.; Mandal S.; Tsang Y. F.; Kumar P.; Kim K.-H.; Ok Y. S. Designer carbon nanotubes for contaminant removal in water and wastewater: A critical review. Sci. Total Environ. 2018, 612, 561–581. 10.1016/j.scitotenv.2017.08.132. [DOI] [PubMed] [Google Scholar]
- Wang Z.; Mi B. Environmental Applications of 2D Molybdenum Disulfide (MoS2) Nanosheets. Environ. Sci. Technol. 2017, 51, 8229–8244. 10.1021/acs.est.7b01466. [DOI] [PubMed] [Google Scholar]
- Kumar N.; Fosso-Kankeu E.; Ray S. S. Achieving Controllable MoS2 Nanostructures with Increased Interlayer Spacing for Efficient Removal of Pb(II) from Aquatic Systems. ACS Appl. Mater. Interfaces 2019, 11, 19141–19155. 10.1021/acsami.9b03853. [DOI] [PubMed] [Google Scholar]
- Massey A. T.; Gusain R.; Kumari S.; Khatri O. P. Hierarchical Microspheres of MoS2 Nanosheets: Efficient and Regenerative Adsorbent for Removal of Water-Soluble Dyes. Ind. Eng. Chem. Res. 2016, 55, 7124–7131. 10.1021/acs.iecr.6b01115. [DOI] [Google Scholar]
- Umukoro E. H.; Kumar N.; Ngila J. C.; Arotiba O. A. Expanded graphite supported p-n MoS2-SnO2 heterojunction nanocomposite electrode for enhanced photo-electrocatalytic degradation of a pharmaceutical pollutant. J. Electroanal. Chem. 2018, 827, 193–203. 10.1016/j.jelechem.2018.09.027. [DOI] [Google Scholar]
- Kumar N.; George B. P. A.; Abrahamse H.; Parashar V.; Ngila J. C. Sustainable one-step synthesis of hierarchical microspheres of PEGylated MoS2 nanosheets and MoO3 nanorods: Their cytotoxicity towards lung and breast cancer cells. Appl. Surf. Sci. 2017, 396, 8–18. 10.1016/j.apsusc.2016.11.027. [DOI] [Google Scholar]
- Wang J.; Zhang W.; Yue X.; Yang Q.; Liu F.; Wang Y.; Zhang D.; Li Z.; Wang J. One-pot synthesis of multifunctional magnetic ferrite–MoS2–carbon dot nanohybrid adsorbent for efficient Pb(ii) removal. J. Mater. Chem. A 2016, 4, 3893–3900. 10.1039/C6TA00269B. [DOI] [Google Scholar]
- Ai K.; Ruan C.; Shen M.; Lu L. MoS2 Nanosheets with Widened Interlayer Spacing for High-Efficiency Removal of Mercury in Aquatic Systems. Adv. Funct. Mater. 2016, 26, 5542–5549. 10.1002/adfm.201601338. [DOI] [Google Scholar]
- Tian C.; Xiang X.; Wu J.; Li B.; Cai C.; Khan B.; Chen H.; Yuan Y.; Zu X. Facile Synthesis of MoS2/CuS Nanosheet Composites as an Efficient and Ultrafast Adsorbent for Water-Soluble Dyes. J. Chem. Eng. Data 2018, 63, 3966–3974. 10.1021/acs.jced.8b00593. [DOI] [Google Scholar]
- Jiang X.; Luo H.; Yin Y.; Zhou W. Facile synthesis of MoS2/reduced graphene oxide composites for efficient removal of Cr(vi) from aqueous solutions. RSC Adv. 2017, 7, 24149–24156. 10.1039/C7RA03531D. [DOI] [Google Scholar]
- Shi Y.; Wang Y.; Wong J. I.; Tan A. Y. S.; Hsu C.-L.; Li L.-J.; Lu Y.-C.; Yang H. Y. Self-assembly of hierarchical MoSx/CNT nanocomposites (2<x<3): towards high performance anode materials for lithium ion batteries. Sci. Rep. 2013, 3, 2169 10.1038/srep02169. [DOI] [PMC free article] [PubMed] [Google Scholar]
- McDowell M. T.; Lichterman M. F.; Carim A. I.; Liu R.; Hu S.; Brunschwig B. S.; Lewis N. S. The Influence of Structure and Processing on the Behavior of TiO2 Protective Layers for Stabilization of n-Si/TiO2/Ni Photoanodes for Water Oxidation. ACS Appl. Mater. Interfaces 2015, 7, 15189–15199. 10.1021/acsami.5b00379. [DOI] [PubMed] [Google Scholar]
- Wang T.; Chen S.; Pang H.; Xue H.; Yu Y. MoS2-Based Nanocomposites for Electrochemical Energy Storage. Adv. Sci. 2017, 4, 1600289 10.1002/advs.201600289. [DOI] [PMC free article] [PubMed] [Google Scholar]
- Zhang X.; Luster B.; Church A.; Muratore C.; Voevodin A. A.; Kohli P.; Aouadi S.; Talapatra S. Carbon Nanotube–MoS2 Composites as Solid Lubricants. ACS Appl. Mater. Interfaces 2009, 1, 735–739. 10.1021/am800240e. [DOI] [PubMed] [Google Scholar]
- Zhou F.; Wang Y.; Wu W.; Jing T.; Mei S.; Zhou Y. Synergetic signal amplification of multi-walled carbon nanotubes-Fe3O4 hybrid and trimethyloctadecylammonium bromide as a highly sensitive detection platform for tetrabromobisphenol A. Sci. Rep. 2016, 6, 38000 10.1038/srep38000. [DOI] [PMC free article] [PubMed] [Google Scholar]
- Gao Y.; Zhang Y.; Williams G. R.; O’Hare D.; Wang Q. Layered double hydroxide-oxidized carbon nanotube hybrids as highly efficient flame retardant nanofillers for polypropylene. Sci. Rep. 2016, 6, 35502 10.1038/srep35502. [DOI] [PMC free article] [PubMed] [Google Scholar]
- Farbod M.; Tadavani S. K.; Kiasat A. Surface oxidation and effect of electric field on dispersion and colloids stability of multiwalled carbon nanotubes. Colloids Surf., A 2011, 384, 685–690. 10.1016/j.colsurfa.2011.05.041. [DOI] [Google Scholar]
- Lin Z.; Liu Y.; Halim U.; Ding M.; Liu Y.; Wang Y.; Jia C.; Chen P.; Duan X.; Wang C.; Song F.; Li M.; Wan C.; Huang Y.; Duan X. Solution-processable 2D semiconductors for high-performance large-area electronics. Nature 2018, 562, 254–258. 10.1038/s41586-018-0574-4. [DOI] [PubMed] [Google Scholar]
- Zhao Y.; Ikram M.; Zhang J.; Kan K.; Wu H.; Song W.; Li L.; Shi K. Outstanding gas sensing performance of CuO-CNTs nanocomposite based on asymmetrical schottky junctions. Appl. Surf. Sci. 2018, 428, 415–421. 10.1016/j.apsusc.2017.09.173. [DOI] [Google Scholar]
- Moraitis G.; Špitalský Z.; Ravani F.; Siokou A.; Galiotis C. Electrochemical oxidation of multi-wall carbon nanotubes. Carbon 2011, 49, 2702–2708. 10.1016/j.carbon.2011.02.060. [DOI] [Google Scholar]
- Gusain R.; Kumar P.; Sharma O. P.; Jain S. L.; Khatri O. P. Reduced graphene oxide–CuO nanocomposites for photocatalytic conversion of CO2 into methanol under visible light irradiation. Appl. Catal., B 2016, 181, 352–362. 10.1016/j.apcatb.2015.08.012. [DOI] [Google Scholar]
- Kumari S.; Mungse H. P.; Gusain R.; Kumar N.; Sugimura H.; Khatri O. P. Octadecanethiol-grafted molybdenum disulfide nanosheets as oil-dispersible additive for reduction of friction and wear. FlatChem 2017, 3, 16–25. 10.1016/j.flatc.2017.06.004. [DOI] [Google Scholar]
- Dong H.; Liu C.; Ye H.; Hu L.; Fugetsu B.; Dai W.; Cao Y.; Qi X.; Lu H.; Zhang X. Three-dimensional Nitrogen-Doped Graphene Supported Molybdenum Disulfide Nanoparticles as an Advanced Catalyst for Hydrogen Evolution Reaction. Sci. Rep. 2015, 5, 17542 10.1038/srep17542. [DOI] [PMC free article] [PubMed] [Google Scholar]
- Zhao L.; Jia J.; Yang Z.; Yu J.; Wang A.; Sang Y.; Zhou W.; Liu H. One-step synthesis of CdS nanoparticles/MoS2 nanosheets heterostructure on porous molybdenum sheet for enhanced photocatalytic H2 evolution. Appl. Catal., B 2017, 210, 290–296. 10.1016/j.apcatb.2017.04.003. [DOI] [Google Scholar]
- Adeniran B.; Mokaya R. Low temperature synthesized carbon nanotube superstructures with superior CO2 and hydrogen storage capacity. J. Mater. Chem. A 2015, 3, 5148–5161. 10.1039/C4TA06539E. [DOI] [Google Scholar]
- Lau V. W.-h.; Masters A. F.; Bond A. M.; Maschmeyer T. Ionic-Liquid-Mediated Active-Site Control of MoS2 for the Electrocatalytic Hydrogen Evolution Reaction. Chem. – Eur. J. 2012, 18, 8230–8239. 10.1002/chem.201200255. [DOI] [PubMed] [Google Scholar]
- Ho Y. S.; McKay G. Pseudo-second order model for sorption processes. Process Biochem. 1999, 34, 451–465. 10.1016/S0032-9592(98)00112-5. [DOI] [Google Scholar]
- Ahmad M. A.; Ahmad Puad N. A.; Bello O. S. Kinetic, equilibrium and thermodynamic studies of synthetic dye removal using pomegranate peel activated carbon prepared by microwave-induced KOH activation. Water Resour. Ind. 2014, 6, 18–35. 10.1016/j.wri.2014.06.002. [DOI] [Google Scholar]
- Ozdes D.; Gundogdu A.; Kemer B.; Duran C.; Senturk H. B.; Soylak M. Removal of Pb(II) ions from aqueous solution by a waste mud from copper mine industry: Equilibrium, kinetic and thermodynamic study. J. Hazard. Mater. 2009, 166, 1480–1487. 10.1016/j.jhazmat.2008.12.073. [DOI] [PubMed] [Google Scholar]
- Pinto P. X.; Al-Abed S. R.; Reisman D. J. Biosorption of heavy metals from mining influenced water onto chitin products. Chem. Eng. J. 2011, 166, 1002–1009. 10.1016/j.cej.2010.11.091. [DOI] [Google Scholar]
- Benavente M.; Moreno L.; Martinez J. Sorption of heavy metals from gold mining wastewater using chitosan. J. Taiwan Inst. Chem. Eng. 2011, 42, 976–988. 10.1016/j.jtice.2011.05.003. [DOI] [Google Scholar]
- Phuengprasop T.; Sittiwong J.; Unob F. Removal of heavy metal ions by iron oxide coated sewage sludge. J. Hazard. Mater. 2011, 186, 502–507. 10.1016/j.jhazmat.2010.11.065. [DOI] [PubMed] [Google Scholar]
- Feng D.; van Deventer J. S. J.; Aldrich C. Removal of pollutants from acid mine wastewater using metallurgical by-product slags. Sep. Purif. Technol. 2004, 40, 61–67. 10.1016/j.seppur.2004.01.003. [DOI] [Google Scholar]
- Chand P.; Bafana A.; Pakade Y. B. Xanthate modified apple pomace as an adsorbent for removal of Cd(II), Ni(II) and Pb(II), and its application to real industrial wastewater. Int. Biodeterior. Biodegrad. 2015, 97, 60–66. 10.1016/j.ibiod.2014.10.015. [DOI] [Google Scholar]
- Phetphaisit C. W.; Yuanyang S.; Chaiyasith W. C. Polyacrylamido-2-methyl-1-propane sulfonic acid-grafted-natural rubber as bio-adsorbent for heavy metal removal from aqueous standard solution and industrial wastewater. J. Hazard. Mater. 2016, 301, 163–171. 10.1016/j.jhazmat.2015.08.056. [DOI] [PubMed] [Google Scholar]
- Abdelfattah I.; Ismail A. A.; Sayed F. A.; Almedolab A.; Aboelghait K. M. Biosorption of heavy metals ions in real industrial wastewater using peanut husk as efficient and cost effective adsorbent. Environ. Nanotechnol., Monit. Manag. 2016, 6, 176–183. 10.1016/j.enmm.2016.10.007. [DOI] [Google Scholar]
- Iqbal M.; Iqbal N.; Bhatti I. A.; Ahmad N.; Zahid M. Response surface methodology application in optimization of cadmium adsorption by shoe waste: A good option of waste mitigation by waste. Ecol. Eng. 2016, 88, 265–275. 10.1016/j.ecoleng.2015.12.041. [DOI] [Google Scholar]
- Meena A. K.; Kadirvelu K.; Mishra G. K.; Rajagopal C.; Nagar P. N. Adsorptive removal of heavy metals from aqueous solution by treated sawdust (Acacia arabica). J. Hazard. Mater. 2008, 150, 604–611. 10.1016/j.jhazmat.2007.05.030. [DOI] [PubMed] [Google Scholar]
- Arshadi M.; Ghiaci M.; Gil A. Schiff Base Ligands Immobilized on a Nanosized SiO2–Al2O3 Mixed Oxide as Adsorbents for Heavy Metals. Ind. Eng. Chem. Res. 2011, 50, 13628–13635. 10.1021/ie2015153. [DOI] [Google Scholar]
- Zhu H.-s.; Yang X.-j.; Mao Y.-p.; Chen Y.; Long X.-l.; Yuan W.-k. Adsorption of EDTA on activated carbon from aqueous solutions. J. Hazard. Mater. 2011, 185, 951–957. 10.1016/j.jhazmat.2010.09.112. [DOI] [PubMed] [Google Scholar]
- Li T.-t.; Liu Y.-g.; Peng Q.-q.; Hu X.-j.; Liao T.; Wang H.; Lu M. Removal of lead(II) from aqueous solution with ethylenediamine-modified yeast biomass coated with magnetic chitosan microparticles: Kinetic and equilibrium modeling. Chem. Eng. J. 2013, 214, 189–197. 10.1016/j.cej.2012.10.055. [DOI] [Google Scholar]
- Zhao J.; Niu Y.; Ren B.; Chen H.; Zhang S.; Jin J.; Zhang Y. Synthesis of Schiff base functionalized superparamagnetic Fe3O4 composites for effective removal of Pb(II) and Cd(II) from aqueous solution. Chem. Eng. J. 2018, 347, 574–584. 10.1016/j.cej.2018.04.151. [DOI] [Google Scholar]
- Lin C.-H.; Wong D. S.-H.; Lu S.-Y. Layered Protonated Titanate Nanosheets Synthesized with a Simple One-Step, Low-Temperature, Urea-Modulated Method as an Effective Pollutant Adsorbent. ACS Appl. Mater. Interfaces 2014, 6, 16669–16678. 10.1021/am5035335. [DOI] [PubMed] [Google Scholar]
- Bi J.; Wu L.; Zhang Y.; Li Z.; Li J.; Fu X. Solvothermal preparation, electronic structure and photocatalytic properties of PbMoO4 and SrMoO4. Appl. Catal., B 2009, 91, 135–143. 10.1016/j.apcatb.2009.05.016. [DOI] [Google Scholar]
- Zhang J.; Zhao T.; Wang B.; Li L.; Zou L.; Gan S. PEG-assisted hydrothermal synthesis and photoluminescence of CdMoO4:Tb3+ green phosphor. J. Phys. Chem. Solids 2015, 79, 14–22. 10.1016/j.jpcs.2014.11.003. [DOI] [Google Scholar]
- Xie L.; Yu Z.; Islam S. M.; Shi K.; Cheng Y.; Yuan M.; Zhao J.; Sun G.; Li H.; Ma S.; Kanatzidis M. G. Remarkable Acid Stability of Polypyrrole-MoS4: A Highly Selective and Efficient Scavenger of Heavy Metals Over a Wide pH Range. Adv. Funct. Mater. 2018, 28, 1800502 10.1002/adfm.201800502. [DOI] [Google Scholar]
- Mostafa Hosseinpour-Mashkani S.; Maddahfar M.; Sobhani-Nasab A. Novel silver-doped CdMoO4: synthesis, characterization, and its photocatalytic performance for methyl orange degradation through the sonochemical method. J. Mater. Sci.: Mater. Electron. 2016, 27, 474–480. 10.1007/s10854-015-3776-7. [DOI] [Google Scholar]
- Datta R. S.; Ou J. Z.; Mohiuddin M.; Carey B. J.; Zhang B. Y.; Khan H.; Syed N.; Zavabeti A.; Haque F.; Daeneke T.; Kalantar-zadeh K. Two dimensional PbMoO4: A photocatalytic material derived from a naturally non-layered crystal. Nano Energy 2018, 49, 237–246. 10.1016/j.nanoen.2018.04.041. [DOI] [Google Scholar]
Associated Data
This section collects any data citations, data availability statements, or supplementary materials included in this article.


