Abstract
The absolute configuration of the alkaloid galantamine was studied using a range of solution-state techniques; nuclear magnetic resonance (NMR), vibrational circular dichroism (VCD), and Raman optical activity (ROA). While the combined use of NMR and VCD does provide a fast, high-resolution methodology for determining the absolute configuration of galantamine, both techniques were needed in concert to achieve this goal. ROA, on the other hand, proved to be sensitive enough to assign the full absolute configuration without relying on other techniques. In both cases, statistical validation was applied to aid the determination of absolute configuration. In the case of galantamine, ROA combined with statistical validation is shown to be a powerful stand-alone tool for absolute configuration determination.
1. Introduction
The vibrational optical activity (VOA) spectroscopic techniques: either combining infrared absorption (IR) with vibrational circular dichroism (VCD) or Raman scattering with Raman optical activity (ROA), respectively, have emerged as powerful analytical tools in the last decade.1,2 Both sets of techniques combine the structural sensitivity of vibrational spectroscopy with the three-dimensional chiral resolution offered from chiroptical spectroscopy, leading to more information-rich spectra than those obtained from electronic circular dichroism.3−5 Hence, these techniques offer a complementary route to structure elucidation and absolute configuration analysis, especially when classical methods, such as X-ray crystallography cannot be applied.7−9 In particular, VCD has been adopted by the field of analytical chemistry in this context.10−14 Contrarily, ROA has for historical reasons mainly been applied to structural biological studies of biomacromolecules.2,15,16 Because of technical limitations in the early years of ROA development, the method was mainly used to study samples in aqueous solution, as water has a very benign Raman profile. Water is, on the other hand, a problematic solvent for IR, and thus the two branches of VOA diverged in research foci. As the ROA technology has developed, the abovementioned limitations have been set aside, opening this very sensitive spectroscopic technique to new fields. Recently, the absolute configuration of Taxol in methanol was studied using ROA,17 setting the stage for the method to enter the field of analytical chemistry? Here, we examine the versatility of the VOA techniques by applying three solution-based methods to the same benchmark study: nuclear magnetic resonance (NMR), IR/VCD, and Raman/ROA. The very nature of chiroptical methods entails that the study employs a combination of the experimental methods. Mentioned along with computational simulation techniques and comparison algorithms to predict and assign spectral bands. As a benchmark, we have chosen the chiral alkaloid galantamine. (−)-Galantamine (Figure 1) is found in the bulbs and flowers of several species from the Amaryllidaceae family, such as the Caucasian snowdrop (Galanthus woronowii), common snowdrop (Galanthus nivalis), and several species of daffodils (Narcissus spp.).18−20 It is approved by the EMA (European Medicine Agency) and the US FDA (Food and Drug Administration) as a competitive inhibitor of acetylcholinesterase and an allosteric modulator of the nicotinic acetylcholine receptor.21−25 It has proven effective in the treatment of mild-to-moderate Alzheimer’s disease.26−30 BEcause of the possibly significantly different biological activity of stereoisomers of medicinally active molecules, knowledge of the relative and absolute configuration of compounds such as galantamine is of utmost importance.
Figure 1.
Structure and atom numbering of galantamine. The molecule contains three chiral centers, at atom numbers 4a, 6, and 8a.
In this study, we show that while, in this particular case, NMR or VCD independently are limited to identifying the relative configuration of galantamine, combining the two techniques allows for full (relative and absolute) configuration analysis. In contrast, ROA is able to unambiguously assign the absolute configuration of galantamine on its own, strongly endorsing the technique as a potential stand-alone chiroptical method in structure elucidation.
2. Computational Methods
Calculation of NMR, VCD, and ROA spectra requires all conformers of the compound to be taken into account. Therefore, a stochastic conformational search with molecular mechanics force fields was performed on the four possible relative configurations shown in Figure 2. For each relative configuration, two enantiomers are possible. For NMR, IR, and Raman spectroscopy, both enantiomers of each of these duos have the same spectrum. For VCD and ROA, there is an exact mirror image relationship between the spectra of enantiomers. Hence, it suffices to compute only one enantiomer of each of the four relative configurations. For the conformational search, algorithms from the software packages Conflex31−33 (“reservoir filling”) and Spartan1634 (Monte Carlo) were employed, in combination with the MMFF94S35,36 and SYBYL37 force fields, respectively. These two parallel approaches yield some redundant conformers, which were removed prior to ab initio geometry optimization and the calculation of the VOA spectra. All conformers were subsequently optimized at the B3LYP/6-31G* level of theory using Gaussian 09,38 and all unique conformers with a relative enthalpy of at most 5 kcal/mol above the most stable one were further optimized at the B3LYP/aug-cc-pVDZ level. Harmonic frequencies, dipole strengths, and rotational strengths were then calculated at this same level for each conformer. To obtain the respective IR and VCD spectra, harmonic frequencies were scaled with a global scale factor σ optimized for maximum IR similarity using CompareVOA39 with a Lorentzian broadening function with a full width at half maximum (fwhm) of 10 cm–1 for the dipole and rotational strengths. For the Raman and ROA spectra, the same level of theory was used, and Raman and ROA intensities were calculated with an incident light wavelength of 532 nm. Raman and ROA intensities were broadened with a Lorentzian function with fwhm of 20 cm–1. Finally, magnetic shielding tensors were calculated at the mPW1PW91/6-311+G** level of theory using Gaussion 09, for comparison with experimental 1H and 13C data. In line with the work of Goodman et al.,40,41 we compute a probability that an observed error in chemical shift could be obtained by chance for every configuration. To that end, all conformers were re-optimized and isotropic shielding constants were calculated at the PW1PW91/6-311+G(2d,p) level of theory.42,43 Isotropic shielding constants were converted to chemical shifts relative to tetramethylsilane (TMS) using linear regression with the experimental chemical shift data. Gauge-independent atomic orbitals were used in all calculations, together with a self-consistent reaction field for solvent modeling, using a dielectric constant for chloroform of ε = 4.71.
Figure 2.
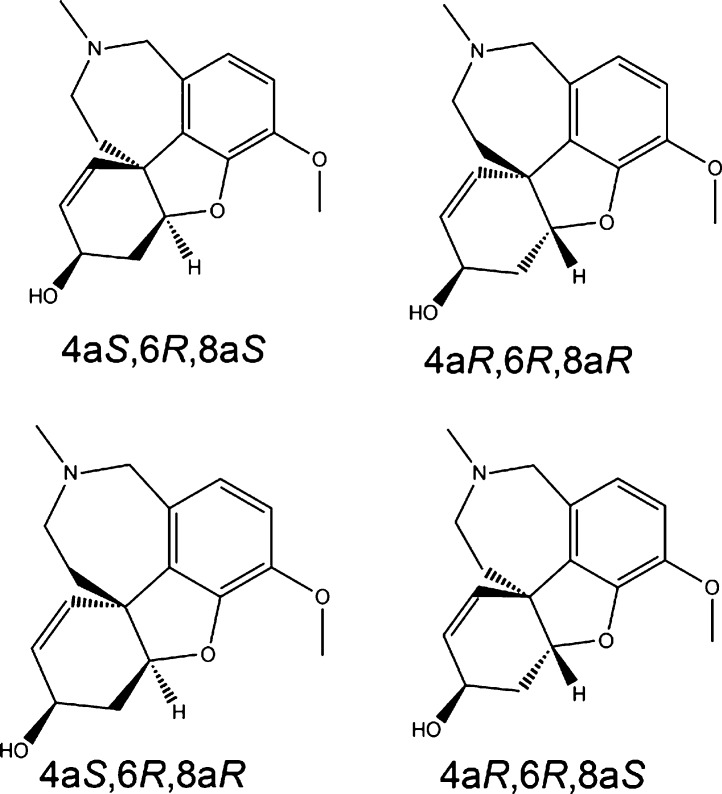
Four possible relative configurations of galantamine.
3. Experimental Techniques
3.1. Preparation of the Free Base of Galantamine Hydrobromide
(−)-Galantamine hydrobromide was kindly provided by Janssen Pharmaceutica N.V., Beerse, Belgium. (−)-Galantamine hydrobromide (2.0 g) was taken into 20 mL of water and the pH was adjusted to 9–9.5 with 10% Na2CO3 solution at room temperature. Sodium chloride (1.5 g) and toluene (20 mL) were added to this mixture, which was subsequently stirred at 50–55 °C for 45 min. The aqueous layer was separated and washed with toluene (2 × 10 mL) at 50–55 °C. The combined organic layers were removed in vacuo at a maximum temperature of about 60 °C. Remaining traces of solvent and water were removed by overnight lyophilization, yielding 1.33 g of the free base.
3.2. NMR Spectroscopy
1H, 13C, COSY, NOESY, and HMQC spectra were recorded in CDCl3 at 400 MHz (1H) and 100 MHz (13C) with TMS as the internal standard. Galantamine (1): 1H-NMR (400 MHz, CDCl3): δ 6.67 (1H, d, J = 8.2 Hz, CH3OCCHCH), 6.63 (1H, d, J = 8.2 Hz, CH3OCCHCH), 6.06 (1H, dd, J = 10.4, 1.2 Hz, CCH=CHCH(OH)), 6.01 (1H, ddd, J = 10.4, 5.6, 1.2 Hz, CCH=CHCH(OH)), 4.62 (1H, s, ArOCHCH2), 4.15 (1H, t, J = 1.2 Hz, CH=CHCH(OH)), 4.11 (1H, d, J = 15.3 Hz, NCH2Ar), 3.84 (3H, s, OCH3), 3.72 (1H, d, J = 15.3 Hz, NCH2Ar), 3.30 (1H, dd, J = 14.4, 12.8 Hz, NCH2CH2), 3.07 (1H, d, J = 14.4 Hz, NCH2CH2), 2.70 (1H, ddd, J = 14.8, 3.3, 1.9 Hz, OCHCH2CH(OH)), 2.42 (3H, s, NCH3), 2.10 (1H, td, J = 12.8, 2.8 Hz, NCH2CH2), 2.01 (1H, ddd, J = 16.0, 5.6, 2.4 Hz, OCHCH2CH(OH)), 1.61 (1H, dd, J = 10.0, 1.2 Hz, NCH2CH2); 13C-NMR (100 MHz, CDCl3): δ 146.16 (COCH3), 144.54 (CH3OCCO), 133.27 (NCH2CCCO), 129.50 (NCH2CCCO), 128.00 (CCH=CHCH(OH)), 126.93 (CCH=CHCH(OH)), 122.44 (CH3OCCHCH), 111.62 (CH3OCCHCH), 88.96 (CH(OH)CH2CHO), 62.29 (CH=CHCH(OH)), 60.65 (NCH2Ar), 56.19 (ArOCH3), 53.96 (CH2, NCH2CH2), 48.41 (NCH2CH2CCH=CH), 42.01 (CH3,NCH3), 33.85 (CH(OH)CH2CHO), 30.19 (NCH2CH2C).
3.3. IR and VCD Spectroscopy
IR and VCD spectra for (−)-Galantamine were recorded on a dual PEM ChiralIR-2X spectrometer (Biotools Inc., Jupiter, FL). All measurements were performed in CDCl3 with a concentration of 0.168 M. A cell with 100 μm path length and BaF2 windows was used. Both the sample and the solvent spectrum were recorded with a resolution of 4 cm–1, totaling 30 000 scans each with both PEMs optimized at 1400 cm–1. The final baseline-corrected VCD spectrum was obtained through subtraction of the solvent spectrum.
3.4. Raman and ROA Spectroscopy
Raman and ROA spectra were recorded on a ChiralRAMAN-2X (BioTools Inc., Jupiter, FL) instrument, providing backscattering Raman and ROA (SCP180) data with a resolution of approximately 7 cm–1. Galantamine was recorded in a freshly prepared 1 M CHCl3 solution for 420 min with a laser power at the source of 100 mW, using a 532 nm excitation wavelength.
4. Results and Discussion
4.1. Conformational Analysis
From Figure 1, three asymmetric carbon atoms (4a, 6 and 8a) can be identified in galantamine, yielding 23 = 8 possible absolute configurations. However, it suffices to consider only four configurations because NMR is not sensitive to the absolute configuration and for the VOA techniques, the spectrum of an enantiomer can be obtained simply by mirroring the spectrum. Because NMR, VCD, and ROA are geometry-dependent properties, conformational analysis on all four relative configurations was performed in order to properly account for this dependency. The four configurations considered are 4aS,6R,8aS, 4aR,6R,8aR, 4aS,6R,8aR, and 4aR,6R,8aS, see Figure 2.
Conformational analysis was performed on these four configurations as described in the Computational Methods section. Only the unique minima with a relative enthalpy ΔH° < 5.0 kcal/mol relative to the most stable conformer in the potential energy surface as computed at the B3LYP/6-31G* level of theory were retained. This resulted in a total of 40 conformers for 4aR,6R,8aR, 19 for 4aR,6R,8aS, 17 for 4aS,6R,8aR and 7 for 4aS,6R,8aS.
It can be observed that the 4aS,6R,8aS configuration has considerably fewer conformers than the other three configurations. This is due to it being the only configuration that allows for an intramolecular hydrogen bond between the alcohol hydrogen and the furan oxygen, largely reducing the flexibility of the 4a–8a six-membered ring. The other three configurations do not have such a restricting hydrogen bond, allowing additional flexibility in that ring. All low-energy conformers are included in the spectroscopic analysis.
4.2. NMR Analysis
Traditionally, (1D-)NMR, in combination with COSY, HMQC, and NOESY experiments, is used for the determination of the relative configuration of natural products.5,6 Although successful, we here opt for a different approach that is less labor intensive, can be partially automated and allows for avoidance of any bias by providing a level of confidence to the assignment of the relative configuration, which is not possible with a manual NMR assignment. This approach starts with the calculation of isotropic shielding constants for all H and C atoms of each conformer of each configuration. These shielding constants are readily available when a VCD calculation is performed, hence no extra calculations are needed. To obtain calculated chemical shifts that can be compared to the 1H and 13C experimental chemical shifts, a linear regression of the shielding constant versus the experimental shifts was performed. This linear regression is shown in Figure 3 for the 1H NMR experiment with the calculated shift of the 4aS,6R,8aS configuration. The linear regression data for the other diastereoisomers are completely analogous.
Figure 3.
Linear regression of the calculated isotropic magnetic shielding for all H-atoms of 4aS,6R,8aS vs the experimental 1H NMR chemical shifts.
This linear fit has several advantages. First of all, the y-intercept gives an estimate for the isotropic shielding constant of the internal standard, most often TMS. This is used to convert the shielding constants to chemical shifts of an atom (δi = σTMS – σi). Second, the slope of the linear fit can be used as a scale factor to correct for the systematic errors in the calculations because of the many approximations made. Finally, the correlation coefficient r2 gives a measure for the random error. A high r2 denotes a tight fit to the experiment, meaning that the calculated shifts give an accurate estimate of the experiment. A lower r2 is a sign that the experiment is not accurately reproduced, which can suggest that the calculation corresponds to another structure (relative configuration) than the experiment. The scaled calculated shifts can be obtained42,43 as
In order to evaluate the agreement between these calculated shifts and the experimental ones, two more parameters are computed. The first is the corrected mean absolute error (CMAE), computed as CMAE = 1/n∑1n|δi,calc – δi,exp| where n corresponds to the number of atoms considered. The lower the CMAE value, the better the agreement with the experiment. To obtain a level of confidence for an NMR assignment, the DP4 method proposed by Goodman et al.40,41 was also employed. In this method, the probability that an observed error in chemical shift is obtained by chance for each possible configuration is evaluated. Using Bayes’ theorem, this is converted to the probability that each candidate structure in turn is the correct one. All 13C and 1H data have been processed this way, with the detailed results presented in Table 1.
Table 1. CMAE, Maximum Deviation, R2, and DP4 Probability for the Comparison of Calculated Chemical Shifts for All Four configurations Versus the Experiments on the Natural Producta.
| configuration | CMAE | εmax | R2 | slope | intercept | DP4 probability (%) |
|---|---|---|---|---|---|---|
| 1H | ||||||
| 4aS,6R,8aS | 0.067 | 0.183 | 0.998 | –1.088 | 32.17 | 99.8 |
| 4aR,6R,8aR | 0.132 | 0.467 | 0.989 | –1.082 | 32.16 | 0.2 |
| 4aS,6R,8aR | 0.249 | 0.856 | 0.963 | –1.158 | 32.41 | 0.0 |
| 4aR,6R,8aS | 0.242 | 0.864 | 0.964 | –1.175 | 32.48 | 0.0 |
| 13C | ||||||
| 4aS,6R,8aS | 1.730 | 5.126 | 0.997 | –1.032 | 187.50 | 99.4 |
| 4aR,6R,8aR | 2.101 | 6.208 | 0.996 | –1.026 | 186.32 | 0.6 |
| 4aS,6R,8aR | 3.334 | 9.802 | 0.990 | –1.053 | 188.18 | 0.0 |
| 4aR,6R,8aS | 3.866 | 12.646 | 0.985 | –1.043 | 188.30 | 0.0 |
For both 1H and 13C NMR, 4aS,6R,8aS has the preferred relative configuration. The difference with 4aR,6R,8aR can however only be confidently established using Bayes’ theorem as reflected in the DP4 probability.
From the data analysis, it is very clear that for both 13C and 1H the 4aS,6R,8aS enantiomeric pair configuration of galantamine gives the best fit to the experimental data. For this configuration, both 13C and 1H calculations give the lowest value for the CMAE and maximum error εmax, and have the highest correlation coefficient R2. These observations are confirmed by the DP4 analysis, which gives a very high probability for the 4aS,6R,8aS pair relative configuration. The three other relative configurations have a very small probability of being the correct structure. Furthermore, if 1H and 13C data are combined in the DP4 analysis, the probability that 4aS,6R,8aS is the correct structure rises to 100%. These results thus lead to a very high confidence that galantamine has either the 4aS,6R,8aS or the 4aR,6S,8aR absolute configuration, as NMR cannot distinguish between both enantiomers. Hence, while NMR analysis, without chemical substitution, is a powerful analytical technique, it is limited by the lack of chiral sensitivity. Hence, NMR as a single technique without special extra techniques or interventions such as chiral agents does not suffice to determine absolute configurations although it does for relative configuration.
4.3. IR/VCD Spectroscopy
The experimental and predicted IR and VCD spectra of galantamine and the four possible absolute configurations are presented in Figures 4 and 5, respectively.
Figure 4.
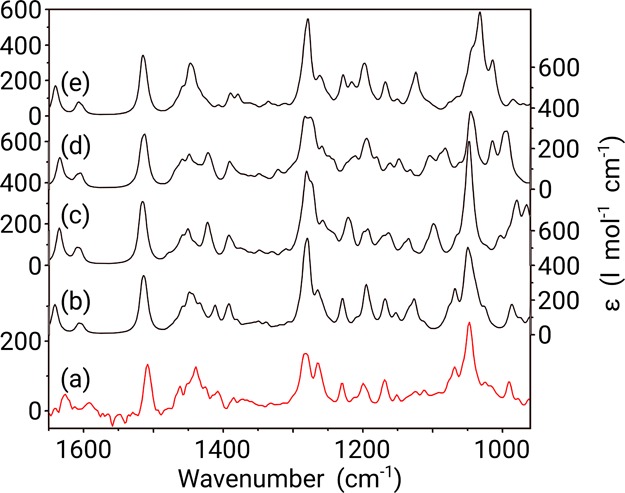
Comparison between the experimental IR spectrum (measured in CDCl3) (a) of galantamine and Boltzmann weighted calculated IR spectra of the 4aS,6R,8aS (b), 4aS,6R,8aR (c), 4aR,6R,8aS (d), and 4aR,6R,8aR (e) configurations of the molecule. Y-axis labels are placed alternating left/right to avoid congestion.
Figure 5.
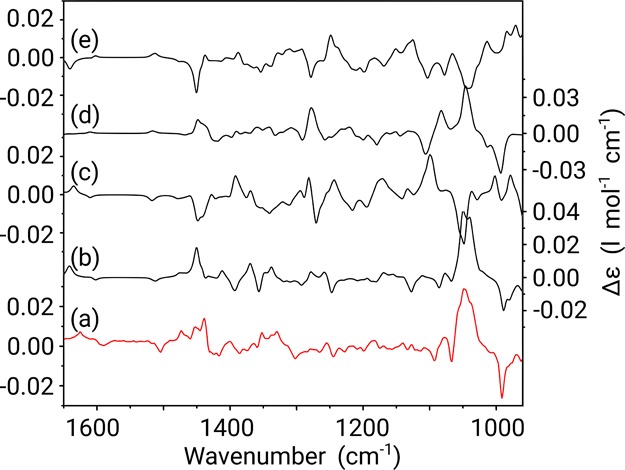
Comparison between the experimental VCD spectrum (measured in CDCl3) (a) of galantamine and Boltzmann weighted calculated VCD spectra of the 4aS,6R,8aS (b), 4aS,6R,8aR (c), 4aR,6R,8aS (d), and 4aR,6R,8aR (e) configurations of the molecule. Y-axis labels are placed alternating left/right to avoid congestion.
Studying the IR spectra in Figure 4, it is clear that there is a reasonable overall agreement for all four configurations. However, the pattern between 970 and 1080 cm–1 is most adequately reproduced for the 4aS,6R,8aS configuration of galantamine, as is the pattern between 1400 and 1475 cm–1. This way, IR gives a first indication of the relative configuration of galantamine. However, the distinction between the four calculated spectra is far too small to be able to draw any kind of conclusion on the relative configuration. IR does not even suffice to distinguish relative configurations.
Compared to the IR data, the VCD spectra in Figure 5 provide a much more complicated picture, with complex positive and negative band structures. Even so, from a simple visual inspection alone, it is tempting to immediately discount the 4aR,6R,8aR and 4aS,6R,8aR configurations, as these appear to have the incorrect sign through most of the spectra. Therefore, such analysis would in fact favor the opposite enantiomers (4aS,6S,8aS and 4aR,6S,8aS), which means that a qualitative assignment of absolute configuration is impossible.
Hence, as a stand-alone technique, VCD fails to deliver an unambiguous assignment of absolute configuration in the case of galantamine. Even so, if VCD spectroscopy is combined with the NMR analysis, the 4aS,6R,8aS emerges as a clear favorite. This is an interesting conclusion, as VCD has, in the case of the alkaloid jonquailine, been shown to be crucial to correctly assign absolute configuration.44
4.4. Raman/ROA Spectroscopy
Equivalent to the previous section, the experimental and predicted Raman and ROA spectra of galantamine and the four possible absolute configurations are presented in Figures 6 and 7, respectively.
Figure 6.
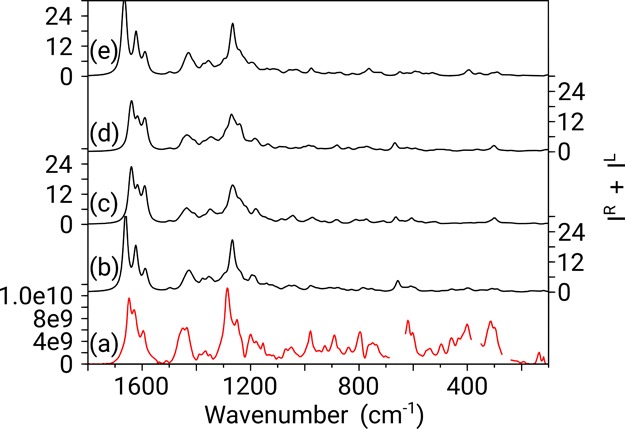
Boltzmann weighted calculated Raman spectra for 4aS,6R,8aS (b), 4aS,6R,8aR (c), 4aR,6R,8aS (d), and 4aR,6R,8aR (e), compared with the experimental Raman (measured in CHCl3) (a). Regions deleted in the experimental Raman spectrum are due to strong solvent bands interfering with the spectrum. Y-axis labels are placed alternating left/right to avoid congestion.
Figure 7.
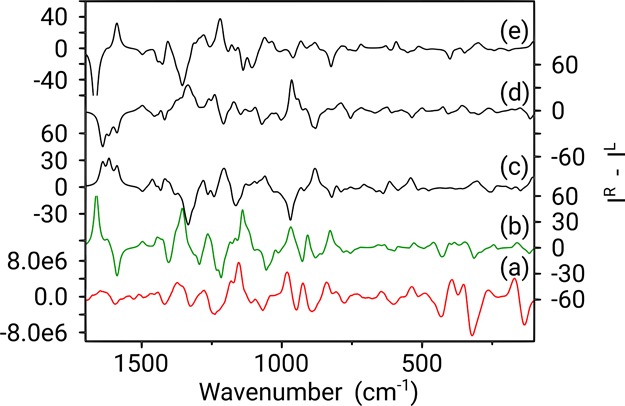
Boltzmann weighted calculated ROA spectra for 4aS,6R,8aS (b), 4aS,6R,8aR (c), 4aR,6R,8aS (d), and 4aR,6R,8aR (e), compared with the experimental ROA spectrum (measured in CHCl3) (a). Y-axis labels are placed alternating left/right to avoid congestion.
As was the case for IR, the Raman data (Figure 6) can arguably be assigned to all four possible configurations, as the main features of the experimental spectrum, from 1100 to 1700 cm–1, are quite well reproduced in all four predicted spectra. Interestingly, below 1100 cm–1, all predicted spectra tend to underestimate the intensity of the bands, leading to very weak features compared to the experimental spectrum.
The ROA spectra in Figure 7 reveal a startling comparison, in contrast to the visual inspection of the VCD data. Instantly, the predicted spectrum of the 4aS,6R,8aS configuration of galantamine appears as the best comparison to experiment. Except for an intensity exaggeration of the couplet between 1660 and 1700 cm–1 and the positive band at 1350 cm–1, most bands from this configuration can be assigned in terms of shape, position, and intensity to the experimental spectrum. This is not the case for any of the other three possible configurations and neither does an assignment of opposite enantiomer seem appropriate. Therefore, from a simple qualitative analysis, ROA is able to positively identify a single absolute configuration.
4.5. Statistical Validation
Visual inspection of spectra and assignment of the absolute configuration from VOA spectra alone can lead to significant bias and may influence any conclusion drawn. To that end, dedicated VOA algorithms have been designed that allow establishing a numerical degree of agreement between experimental and theoretical spectra. Our group introduced the CompareVOA algorithm that projects a numerical measure of agreement between a theoretical spectrum and an experimental spectrum in a database of known and validated correct assignments and from this extracts a level of confidence.39 However, this method depends on a database of validated assignments and moreover such a database does not (yet) exist for ROA spectra. An alternative approach to unbiased validation of an assignment relies on an internal validation step. The details of the so-called Amphidromus algorithm can be found in Vandenbussche et al.45 but the essence consists of the following steps:
The similarity Rexp,calc is computed between the calculated spectrum and the experimental spectrum. Good agreement is reflected in a high similarity value, optimally equal to 100%.
The calculated spectrum is perturbed randomly to generate a set of new spectra x and the similarity to both the original calculated spectrum and the experimental spectrum is computed, leading to the values Rx,calc and Rx,exp, respectively. This is repeated for a large set of perturbations (x = 25000).
The values of Rx,calc and Rx,exp are plotted and the shape of the point cloud examined. If the computed and experimental spectra coincide, the point cloud actually becomes a straight line. The more circular the cloud becomes, the less validated the agreement between theory and experiment is.
This algorithm clearly reveals where the best agreement is found between theory and experiment. In the case of VCD, the calculated spectra of two diastereomers match experiment equally well, see Figure 8.
Figure 8.
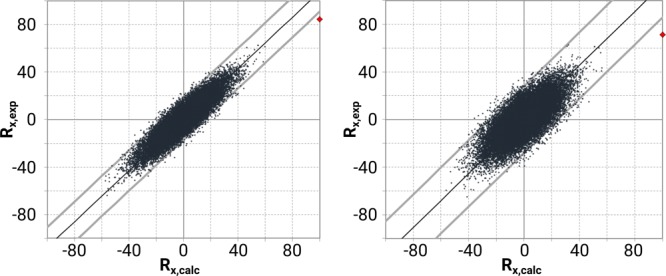
Randomization plots for the VCD spectra of 4aS,6R,8aS (left) and 4aR,6R,8aS (right). Both configurations show a high similarity between the ab initio computed spectrum (red dot = Rexp,calc) and the experiment, and a similar behavior of the random spectra.
The red dots, reflecting the similarity Rexp,calc, show only a modest difference whereas the point clouds show largely similar features. This shows that VCD alone does not allow to establish neither the relative nor absolute configuration. As already indicated from the qualitative analysis, VCD works well in tandem with NMR but it does not answer the fundamental question in the present paper: what sole technique among NMR and VOA techniques allows establishing absolute configurations?
In case of ROA, the distinction is a lot clearer as is shown in Figure 9.
Figure 9.
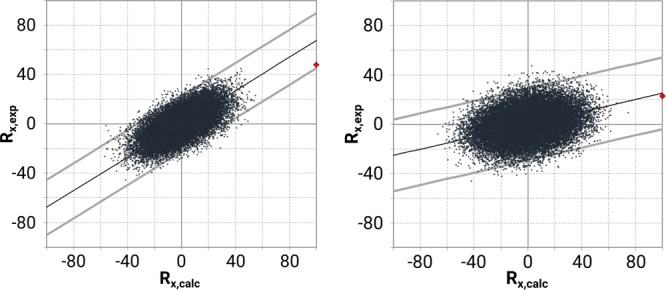
Randomization plots for the ROA spectra of 4aS,6R,8aS (left) and 4aR,6R,8aS (right). The 4aR,6R,8aS configuration shows a rather circular distribution and low correlation, with a large portion of the random spectra showing higher similarity with the experiment than the actual calculation (red dot = Rexp,calc).
Comparing both point clouds in Figure 9, the shape of the left one is much more in line with a good fit than the right cloud. Moreover, in the case of the left point cloud, the red dot—showing the similarity between the computed and true experimental spectrum—reveals the highest similarity of all spectra. This is not the case for the 4aR,6R,8aS configuration. Many randomized spectra perform significantly better and the value indicated by the red point is hardly half of that for the 4aS,6R,8aS configuration.
This means that the statistical validation clearly supports the observations made in the qualitative analysis: In the case of galantamine, VCD cannot distinguish between two configurations varying in one chiral center, while ROA can. Hence, this particular study implies that ROA can work as a stand-alone technique for absolute configuration analysis, while VCD must rely on other techniques, such as NMR, to complete the analysis.
5. Conclusions
In this study, the performances of the NMR, IR/VCD, and Raman/ROA techniques as stand-alone techniques toward absolute configuration analysis of a chiral natural product, galantamine, have been compared. While NMR is responsive to relative absolute configuration and thus supplies a partial solution to the configuration problem, it does not suffice to establish the absolute configuration. Interestingly, VCD alone also does not suffice in this case as it does not sufficiently well distinguish between relative configurations. Only when combining NMR and VCD data can one obtain an unambiguous absolute configuration assignment. Contrarily, when applying ROA as an absolute configuration tool in case of galantamine, this technique delivers on its own, resulting in a clear assignment without any supporting extra experimental methods. Future studies involving, for example, drug molecules based on the galantamine scaffold will shed further light on the direct applicability of ROA in structure elucidation of complex chiral compounds.
Acknowledgments
Financial support through FWO and through IOF funding schemes at the University of Antwerp and Ghent University is acknowledged.
Supporting Information Available
The Supporting Information is available free of charge on the ACS Publications website at DOI: 10.1021/acsomega.9b02108.
NMR spectra (PDF)
Author Contributions
The manuscript was written through contributions of all authors. All authors have given approval to the final version of the manuscript.
The authors declare no competing financial interest.
Supplementary Material
References
- Nafie L. A.Vibrational Optical Activity: Principles and Applications; Wiley, 2011. [Google Scholar]
- Barron L. D.; Buckingham A. D. Vibrational optical activity. Chem. Phys. Lett. 2010, 492, 199–213. 10.1016/j.cplett.2010.03.090. [DOI] [Google Scholar]
- Polavarapu P. L.Chiroptical Spectroscopy: Fundamentals and Applications; CRC Press, 2016. [Google Scholar]
- Stephens P. J.; Devlin F. J.; Cheeseman J. R.. VCD Spectroscopy for Organic Chemists; CRC Press, 2012. [Google Scholar]
- Zhu H.-J.Organic Stereochemistry: Experimental and Computational Methods; Wiley, 2015. [Google Scholar]
- Cid M.-M.; Bravo J.. Structure Elucidation in Organic Chemistry: The Search for the Right Tools; Wiley, 2015. [Google Scholar]
- Wesolowski S. S.; Pivonka D. E. A rapid alternative to X-ray crystallography for chiral determination: Case studies of vibrational circular dichroism (VCD) to advance drug discovery projects. Bioorg. Med. Chem. Lett. 2013, 23, 4019–4025. 10.1016/j.bmcl.2013.05.005. [DOI] [PubMed] [Google Scholar]
- Harada N. Chiral Molecular Science: How were the absolute configurations of chiral molecules determined? ″Experimental results and theories″. Chirality 2017, 29, 774–797. 10.1002/chir.22748. [DOI] [PubMed] [Google Scholar]
- Chhetri B. K.; Lavoie S.; Sweeney-Jones A. M.; Kubanek J. Recent trends in the structural revision of natural products. Nat. Prod. Rep. 2018, 35, 514–531. 10.1039/c8np00011e. [DOI] [PMC free article] [PubMed] [Google Scholar]
- He Y.; Bo W.; Dukor R. K.; Nafie L. A. Determination of Absolute Configuration of Chiral Molecules Using Vibrational Optical Activity: A Review. Appl. Spectrosc. 2011, 65, 699–723. 10.1366/11-06321. [DOI] [PubMed] [Google Scholar]
- He Y.; Wang B.; Dukor R. K.; Nafie L. A.; Salomon C. Recent Applications of Vibrational Circular Dichroism (VCD) in Determination of Absolute Configurations of Chiral Natural Products. Planta Med. 2013, 79, 883. 10.1055/s-0033-1348794. [DOI] [Google Scholar]
- Batista J. M.; Blanch E. W.; Bolzani V. D. Recent advances in the use of vibrational chiroptical spectroscopic methods for stereochemical characterization of natural products. Nat. Prod. Rep. 2015, 32, 1280–1302. 10.1039/c5np00027k. [DOI] [PubMed] [Google Scholar]
- Polavarapu P. L. Structural Analysis Using Chiroptical Spectroscopy: Insights and Cautions. Chirality 2016, 28, 445–452. 10.1002/chir.22601. [DOI] [PubMed] [Google Scholar]
- Taniguchi T.; Monde K. Practical Use of Circular Dichroism and Vibrational Circular Dichroism for Structural Analysis. J. Synth. Org. Chem., Jpn. 2017, 75, 522–529. 10.5059/yukigoseikyokaishi.75.522. [DOI] [Google Scholar]
- Ostovar pour S.; Barron L. D.; Mutter S. T.; Blanch E. W.. Raman Optical Activity. Chiral Analysis; Elsevier, 2018; pp 249–291. [Google Scholar]
- Parchaňský V.; Kapitan J.; Bour P. Inspecting chiral molecules by Raman optical activity spectroscopy. RSC Adv. 2014, 4, 57125–57136. 10.1039/c4ra10416a. [DOI] [Google Scholar]
- Profant V.; Jegorov A.; Bouř P.; Baumruk V. Absolute Configuration Determination of a Taxol Precursor Based on Raman Optical Activity Spectra. J. Phys. Chem. B 2017, 121, 1544–1551. 10.1021/acs.jpcb.6b12318. [DOI] [PubMed] [Google Scholar]
- Berkov S.; Georgieva L.; Kondakova V.; Atanassov A.; Viladomat F.; Bastida J.; Codina C. Plant sources of galanthamine: phytochemical and biotechnological aspects. Biotechnol. Biotechnol. Equip. 2009, 23, 1170–1176. 10.1080/13102818.2009.10817633. [DOI] [Google Scholar]
- Halpin C. M.; Reilly C.; Walsh J. J. Nature’s Anti-Alzheimer’s Drug: Isolation and Structure Elucidation of Galantamine fromLeucojum aestivum. J. Chem. Educ. 2010, 87, 1242–1243. 10.1021/ed100388x. [DOI] [Google Scholar]
- Houghton P. J.; Ren Y.; Howes M.-J. Acetylcholinesterase inhibitors from plants and fungi. Nat. Prod. Rep. 2006, 23, 181–199. 10.1039/b508966m. [DOI] [PubMed] [Google Scholar]
- Atanasova M.; Yordanov N.; Dimitrov I.; Berkov S.; Doytchinova I. Molecular Docking Study on Galantamine Derivatives as Cholinesterase Inhibitors. Mol. Inf. 2015, 34, 394–403. 10.1002/minf.201400145. [DOI] [PubMed] [Google Scholar]
- Gulcan H.; Orhan I. E.; Sener B. Chemical and Molecular Aspects on Interactions of Galanthamine and Its Derivatives with Cholinesterases. Curr. Pharm. Biotechnol. 2015, 16, 252–258. 10.2174/1389201015666141202105105. [DOI] [PubMed] [Google Scholar]
- Keglevich P.; Szántay C.; Hazai L. The Chemistry of Galanthamine. Classical Synthetic Methods and Comprehensive Study on its Analogues. Mini-Rev. Med. Chem. 2016, 16, 1450–1461. 10.2174/1389557516666160321114556. [DOI] [PubMed] [Google Scholar]
- Castillo-Ordóñez W. O.; Tamarozzi E. R.; da Silva G. M.; Aristizabal-Pachón A. F.; Sakamoto-Hojo E. T.; Takahashi C. S.; Giuliatti S. Exploration of the Acetylcholinesterase Inhibitory Activity of Some Alkaloids from Amaryllidaceae Family by Molecular Docking In Silico. Neurochem. Res. 2017, 42, 2826–2830. 10.1007/s11064-017-2295-8. [DOI] [PubMed] [Google Scholar]
- Stavrakov G.; Philipova I.; Zheleva D.; Atanasova M.; Konstantinov S.; Doytchinova I. Docking-based Design of Galantamine Derivatives with Dual-site Binding to Acetylcholinesterase. Mol. Inf. 2016, 35, 278–285. 10.1002/minf.201600041. [DOI] [PubMed] [Google Scholar]
- Fang L.; Gou S.; Fang X.; Cheng L.; Fleck C. Current Progresses of Novel Natural Products and Their Derivatives/ Analogs as Anti-Alzheimer Candidates: an Update. Mini-Rev. Med. Chem. 2013, 13, 870–887. 10.2174/1389557511313060009. [DOI] [PubMed] [Google Scholar]
- Fridlender M.; Kapulnik Y.; Koltai H. Plant derived substances with anti-cancer activity: from folklore to practice. Front. Plant Sci. 2015, 6, 799. 10.3389/fpls.2015.00799. [DOI] [PMC free article] [PubMed] [Google Scholar]
- Hao G.; Zhang Q. Progress of medicinal plant-derived active substances for Alzheimer’s disease. Drugs Future 2015, 40, 443–466. 10.1358/dof.2015.40.7.2374837. [DOI] [Google Scholar]
- Libro R.; Giacoppo S.; Soundara Rajan T.; Bramanti P.; Mazzon E. Natural Phytochemicals in the Treatment and Prevention of Dementia: An Overview. Molecules 2016, 21, 518. 10.3390/molecules21040518. [DOI] [PMC free article] [PubMed] [Google Scholar]
- Agatonovic-Kustrin S.; Kettle C.; Morton D. W. A molecular approach in drug development for Alzheimer’s disease. Biomed. Pharmacother. 2018, 106, 553–565. 10.1016/j.biopha.2018.06.147. [DOI] [PubMed] [Google Scholar]
- CONFLEX 6 Program; Conflex Corporation, Tokyo, 2012.
- Goto H.; Osawa E. Corner flapping: a simple and fast algorithm for exhaustive generation of ring conformations. J. Am. Chem. Soc. 1989, 111, 8950–8951. 10.1021/ja00206a046. [DOI] [Google Scholar]
- Goto̅ H.; Osawa E. An efficient algorithm for searching low-energy conformers of cyclic and acyclic molecules. J. Chem. Soc., Perkin Trans. 2 1993, 187–198. 10.1039/p29930000187. [DOI] [Google Scholar]
- Spartan’16; Wavefunction, Inc., 2016.
- Halgren T. A. Merck molecular force field. I. Basis, form, scope, parameterization, and performance of MMFF94. J. Comput. Chem. 1996, 17, 490–519. . [DOI] [Google Scholar]
- Halgren T. A. MMFF VII. Characterization of MMFF94, MMFF94s, and other widely available force fields for conformational energies and for intermolecular-interaction energies and geometries This article includes Supplementary Material available from the author upon request or via the Internet at ftp.wiley.com/public/journals/jcc/suppmat/20/730 or http://journals.wiley.com/jcc/. J. Comput. Chem. 1999, 20, 730–748. . [DOI] [PubMed] [Google Scholar]
- Clark M.; Cramer R. D.; Van Opdenbosch N. Validation of the general purpose Tripos 5.2 force field. J. Comput. Chem. 1989, 10, 982–1012. 10.1002/jcc.540100804. [DOI] [Google Scholar]
- Frisch M. J.; Trucks G. W.; Schlegel H. B.; Scuseria G. E.; Robb M. A.; Cheeseman J. R.; Scalmani G.; Barone V.; Mennucci B.; Petersson G. A.; Nakatsuji H.; Caricato M.; Li X.; Hratchian H. P.; Izmaylov A. F.; Bloino J.; Zheng G.; Sonnenberg J. L.; Hada M.; Ehara M.; Toyota K.; Fukuda R.; Hasegawa J.; Ishida M.; Nakajima T.; Honda Y.; Kitao O.; Nakai H.; Vreven T.; Montgomery J. A. Jr.; Peralta J. E.; Ogliaro F.; Bearpark M.; Heyd J. J.; Brothers E.; Kudin K. N.; Staroverov V. N.; Kobayashi R.; Normand J.; Raghavachari K.; Rendell A.; Burant J. C.; Iyengar S. S.; Tomasi J.; Cossi M.; Rega N.; Millam N. J.; Klene M.; Knox J. E.; Cross J. B.; Bakken V.; Adamo C.; Jaramillo J.; Gomperts R.; Stratmann R. E.; Yazyev O.; Austin A. J.; Cammi R.; Pomelli C.; Ochterski J. W.; Martin R. L.; Morokuma K.; Zakrzewski V. G.; Voth G. A.; Salvador P.; Dannenberg J. J.; Dapprich S.; Daniels A. D.; Farkas O.; Foresman J. B.; Ortiz J. V.; Cioslowski J.; Fox D. J.. Gaussian 09, Revision D.1; Gaussian, Inc.: Wallingford CT, 2009. [Google Scholar]
- Debie E.; De Gussem E.; Dukor R. K.; Herrebout W.; Nafie L. A.; Bultinck P. A Confidence level algorithm for the determination of absolute configuration using vibrational circular dichroism or Raman optical activity. ChemPhysChem 2011, 12, 1542–1549. 10.1002/cphc.201100050. [DOI] [PubMed] [Google Scholar]
- Smith S. G.; Goodman J. M. Assigning Stereochemistry to Single Diastereoisomers by GIAO NMR Calculation: The DP4 Probability. J. Am. Chem. Soc. 2010, 132, 12946–12959. 10.1021/ja105035r. [DOI] [PubMed] [Google Scholar]
- Ermanis K.; Parkes K. E. B.; Agback T.; Goodman J. M. Expanding DP4: application to drug compounds and automation. Org. Biomol. Chem. 2016, 14, 3943–3949. 10.1039/c6ob00015k. [DOI] [PubMed] [Google Scholar]
- Lodewyk M. W.; Siebert M. R.; Tantillo D. J. Computational Prediction of 1H and 13C Chemical Shifts: A Useful Tool for Natural Product, Mechanistic, and Synthetic Organic Chemistry. Chem. Rev. 2012, 112, 1839–1862. 10.1021/cr200106v. [DOI] [PubMed] [Google Scholar]
- Tantillo D. J. Walking in the woods with quantum chemistry - applications of quantum chemical calculations in natural products research. Nat. Prod. Rep. 2013, 30, 1079–1086. 10.1039/c3np70028c. [DOI] [PubMed] [Google Scholar]
- Vergura S.; Santoro E.; Masi M.; Evidente A.; Scafato P.; Superchi S.; Mazzeo G.; Longhi G.; Abbate S. Absolute configuration assignment to anticancer Amaryllidaceae alkaloid jonquailine. Fitoterapia 2018, 129, 78–84. 10.1016/j.fitote.2018.06.013. [DOI] [PubMed] [Google Scholar]
- Vandenbussche J.; Bultinck P.; Przybył A. K.; Herrebout W. A. Statistical Validation of Absolute Configuration Assignment in Vibrational Optical Activity. J. Chem. Theory Comput. 2013, 9, 5504–5512. 10.1021/ct400843e. [DOI] [PubMed] [Google Scholar]
Associated Data
This section collects any data citations, data availability statements, or supplementary materials included in this article.


