

Abstract
The surgical creation of an artery-vein connection via a Brachicephalic fistula (BCF) in patients with end stage renal disease (ESRD) provides a unique opportunity to study blood vessel response mechanisms to extreme hemodynamic conditions in relatively short timeframes. After BCF creation, the flow rate in the vein increases by an order of magnitude leading to separated flows and corresponding abnormally low, or negative, wall shear stress (WSS) in the curved arch segment of the cephalic vein. Locations of abnormally low WSS are shown to correlate with development of neointimal hyperplasia (NH) and subsequent stenosis. It is found that the stenosis, prior to a surgical intervention, restores the normal physiological WSS in the vein. As a result, this investigation provides evidence that the adaptation principle, known to apply in the arterial system, is also valid in the venous system. A novel graphical method is developed that combines clinical and computational data to assist in interpreting these physiological mechanisms including adaptation that lead to changes in vein geometry over time.
1. Introduction
1.1. Brachiocephalic fistula
The outcomes of patients with end stage renal disease (ESRD) receiving hemodialysis strongly depend on a functioning vascular access. Although a number of techniques have been developed for providing hemodialysis access, there have been no major advances for over thirty years. The most effective means of providing vascular access is through the surgical creation of a fistula, which is a direct artery-to-vein flow path providing high flowrates by bypassing lower arm resistances.
The type of fistula with the most favorable outcomes is the radiocephalic fistula (RCF); however, in elderly patients with underlying vascular disease, particularly in diabetics, this access often fails to mature [1,2]. If the RCF is not viable, a brachiocephalic (BCF) is the recommended alternative. The resulting volumetric flowrates in the BCF far exceed those of the RCF. The RCF and BCF have mean patencies of 5 and 3.6 years, respectively [2].
The BCF, located in the mid-arm region, involves surgical connection of the brachial artery and the cephalic vein. The cephalic vein geometry considered in this investigation consists of an approximately 10 cm segment including the curved arch portion as illustrated in Figure 1. The cephalic arch is the final bend in the cephalic vein prior to its junction with the axillary vein. The domain starts downstream (based on flow direction) of the artery-vein junction in a relatively straight segment of the cephalic vein. In this figure, the cephalic arch is on the left side and flow is from right to left. Figure 1(a) shows an example of a normal vein and arch, whereas part b shows the arch for the same patient at a later time with stenosis present.
Figure 1.

(a) Example venograms illustrating the cephalic vein and arch. The blood flow is from right to left. Note a collateral vein is present in the arch but is observed to degrade over time.
A leading cause of BCF dysfunction and failure is cephalic arch stenosis (CAS) due to neointimal hyperplasia (NH) resulting from high vein inlet flowrates that lead to low wall shear stresses (WSS) in the curved cephalic arch [3-5]. CAS is difficult to treat, often requiring repeated costly interventional procedures, such as angioplasty and stents, to maintain access patency. There are currently no effective therapies to prevent CAS.
1.2. Extreme hemodynamics in the BCF
The surgical creation of the BCF introduces arterial conditions in the vein such as significantly higher blood pressures and velocities. The resulting Reynolds numbers in the cephalic vein can be as large as 3000 based on radius, inlet velocity, and kinematic viscosity. This value is up to two orders of magnitude larger than pre-fistula values and likely exceeds all locations in the cardiovascular system except possibly the aorta and vena cava. There are at least two distinct time periods during which the cephalic vein undergoes dramatic geometric changes in response to the extreme hemodynamics.
1.2.1. Short-term response
The following general trends are observed during the time of fistula maturation (TM), i.e. the time interval starting from BCF creation, taken as t = 0, to when the access is sufficient for hemodialysis, which is typically two to six months. This arterialization period for the vein is marked by: (1) velocities in the vein that increase by more than a factor of 15 (≈ 4 cm/s to on average 65 cm/s); this leads to (i) increases in wall shear stress (WSS) in relatively straight portions of the vein and (ii) low or negative WSS in the curved cephalic arch, (2) vein diameter dilates such that by TM it has increased by a factor of approximately two, and (3) pressures in the vein increase significantly immediately upon BCF creation.
1.2.2. Long-term response
In the months and years following fistula maturation, the cephalic vein continues to adjust to its new hemodynamic environment. During this time the vein experiences: (1) local neointimal hyperplasia (NH) and subsequently stenoses, locally reducing vein diameter, (2) global increases in diameter, e.g. in straight vessel segments, due to increases in WSS, and (3) global thickening of the media layer of the vein wall. These temporal behaviours are indicative of adaptation, dilation, and inward remodeling and are further discussed in Section 2.
1.3. Objectives
Owing to its critical importance in hemodialysis vascular access, an improved understanding of the causes of fistula failure is required [3,6-11]. Several reviews summarize the open questions and current issues in hemodialysis vascular access [12-14]. In particular, several numerical simulations exist on hemodialysis fistulae; however, most primarily focus on the artery-vein connection (anastomosis) region [15-20], whereas the focus of the present study is in the cephalic arch, which is the dominant location of BCF failure due to stenosis [3,21].
The aims of this investigation are to: (1) develop a novel graphical method to assist in characterization of venous response mechanisms, and (2) provide evidence that the adaptation principle, which has been confirmed in the arterial system, also applies to the venous system. Here, the goal is to exploit the extreme hemodynamic environment present in a BCF because it both temporally accelerates and spatially magnifies the occurrence of various blood vessel response mechanisms.
2. Vessel response mechanisms to altered hemodynamics
Blood vessels are known to exhibit various response mechanisms depending on mechanical stimuli, such as WSS level and pressure. A large number of studies exist, primarily on arteries, regarding how these mechanical stimuli lead to biochemical signals, such as vasodilating agents and growth factors, and ultimately changes in the blood vessel diameter and wall thickness [12,14,22,23]. While vessel biology, biochemical signaling pathways, and cellular events play a central role in the processes that lead to changes in vessel geometry, here we consider the geometric response to result directly from the mechanical stresses acting on the vessel walls, i.e. WSS, without concern for the biochemical processes that make this possible. Definitions of these vessel response mechanisms, as used in this study, are given following an identification of critical WSS levels in large arteries and veins.
Several critical threshold levels of WSS have been identified in the literature for large arteries and veins, see Table 1. There are at least two existing studies providing the normal physiological range (NPR) for large veins. For example, Malek et al. gives a range of 0.1 to 0.6 Pa for normal veins assuming Pouiseuille’s Law is valid, i.e. τw = 4μQ/R3 [24]. In addition, Van Tricht et al. [25] citing an earlier textbook, provides an NPR for large-sized veins as 0.076 to 0.76 Pa based upon shear rates of 20 to 200 s−1 and a constant dynamic viscosity of 0.038 Poise (0.0038 Pa-s) [26]. This NPR has recently been confirmed for the cephalic vein in the present patient population [27], and this will be revisited in Section 3.2.
Table 1.
Summary of critical wall shear stress (WSS) levels in large veins and arteries.
2.1. Adaptation
Vessel adaptation is the principle whereby the luminal diameter of a blood vessel increases or decreases locally in order to maintain WSS values within the normal physiological range [8,11,14,28]. For arteries in the presence of low or negative WSS, the intimal layer experiences growth due to the proliferation and migration of smooth muscle cells from the media layer. In addition, extracellular matrix proteins and cytokines (e.g. platelet-derived growth factor, transforming growth factor-β, and endothelin) are activated in endothelial cells by low or negative WSS. This culminates in neointimal hyperplasia (NH) and possibly stenosis [29]. Together NH and stenosis are an effort by the vessel to reduce diameter, increases velocity gradients at the wall, and thus WSS to restore the NPR. Adaptation is a local phenomenon whereby the vessel endothelium is altered at the location of low WSS.
The adaptation principle has been postulated by numerous researchers, but it has not been rigorously established for the venous system [12]. There is an increasing amount of evidence that disturbed flow leads to locally low and/or oscillatory WSS and ultimately NH. For example, it has been proposed that low or oscillatory WSS (< 1 Pa) in the cephalic vein results in NH [15]. Establishing this link between low WSS and NH is the vital first step in establishing the adaptation process for veins. However, studies showing the final outcome in the adaptation process, i.e. restoration of WSS to the NPR, are missing for veins.
2.2. Dilation
In the post-fistula environment, dilation of the cephalic vein occurs over a time period of weeks to months. Overall vessel dilation occurs when a blood vessel diameter increases due to a variety of factors such as pressure, high wall shear stress, temperature, hormones, or the nervous system. In addition, there is local endothelial-mediated release of nitric oxide (NO) and other vasodilators leading to relaxation of smooth muscle cells within the vessel walls and diameter lumen enlargement thereby returning WSS back to the NPR. Some researchers view this type of dilation response as “reverse” or “negative” adaptation because it is driven by WSS, for example, see [28]. Dilation is viewed here as a global phenomenon in which the entire vessel responds to mechanical or chemical stimulus.
2.3. Remodeling
Vessel remodeling is a process in which the vessel wall thickness changes in response to variations in circumferential stresses that result from modifications in blood pressures [8,23,29-32]. Increasing pressures lead to thicker vessel walls. The remodeling can be classified as hypotrophic, eutrophic, or hypertrophic depending on the change in net cross-sectional area. The remodeling principle also has not been formally established in the venous system, particularly in the context of fistulae [12]. Like adaptation, remodeling is a response to the local pressure in the vein.
3. Methods
This paper details a novel method to integrate clinically measured patient-specific geometry (venograms) with Computational Fluid Dynamic (CFD) simulation results (wall shear stresses), cf. [21], obtained on a cohort of patients over a three-year time frame to elucidate vein response mechanisms. The trial was conducted with good clinical practice and according to the Declaration of Helsinki, and was registered at ClinicalTrials.gov () August 8, 2012. The study protocol was approved by the Institutional Review Board from the University of Chicago (Protocol number: 11–0269) on August 10, 2011. In addition, the approved IRB includes written informed consent for all subjects participating in the study.
3.1. Computational model
Recently, Boghosian et al. [21] have developed a methodology to convert patient-specific venography (radiologic images) as in Figure 1 and Doppler velocity and viscosity measurements into CFD models. Details on issues such as study design, patient selection, sample size, follow-up duration, basis for 2D modeling, numerical methods, boundary conditions, meshing, validation, limitations, etc. are provided in this reference (see also [27]). Here, our aim is to use the results from the highly integrated clinical measurements and CFD simulations to identify response mechanisms, in particular adaptation, in the cephalic vein and arch. These CFD results, coupled with the known geometry at various points in time, provide data that allows for characterization of the response of the cephalic vein to the altered hemodynamics.
3.2. Characterization of vein response mechanisms
A novel method for characterizing the response of the vein to the extreme hemodynamics is proposed in this investigation. The approach involves combining the WSS from the CFD simulations at a given time with the patient-specific geometries at two points in time obtained from the venography. In our long-term study, we obtain venogram images at the following time intervals post-fistula creation: TM (2 – 6 months), 12, 24, and 36 months. As a result, the geometry is known at two adjacent time points, ta and tb. From the geometries at these two points, we can define a normalized change in diameter, ∆d*(s), along the length of the vein over the given time interval, ∆t = tb - ta, as
| (1) |
where db(s) and da(s) are the diameter distributions along the length of the vein at tb and ta, respectively, and dcorr is a constant correction for overall global dilation. The variable s is along the length of the vessel. Global dilation is likely the dominant response of the vein during the arterialization process immediately after fistula creation and it could mask other responses, prior to TM, hence the average dilation is subtracted out to better expose the local vein adaptation and remodeling responses. The diameter correction, dcorr, is found by subtracting the average vein diameter at ta from the average vein diameter at tb according to
| (2) |
Thus, Eqn. (1) can be expressed as
| (3) |
Table 2 shows the various primary response mechanisms in the vein classified by zones in which they occur as illustrated in Figure 2. In the table, each zone is identified by a local value for ∆d* over the time interval and the corresponding value of τw at that location at the initial time. The last column shows other possibilities that can occur in each zone. At some locations multiple mechanisms may be present simultaneously, e.g. adaptation and dilation, but data points only appear in a single zone because one mechanism dominates over the other.
Table 2.
Classification of vein response mechanisms by zones as shown in Figure 2.
| Zone No. | ∆d*(ta, tb) | τw(ta), Pa | Primary Response Mechanism | Other Scenario |
|---|---|---|---|---|
| I | < 0 | < 0.076 | Adaptation | I > II |
| II | > 0 | < 0.076 | Aneurysm-type | II > I |
| III | > 0 | > 0.076 | Excess Dilation | III > IV |
| IV | < 0 | > 0.076 | Remodeling (inward) | IV > III |
Figure 2.

The zone scatter plot. Characterization of postulated vein response mechanisms by zones based on τw and ∆d*. NPR for the cephalic vein is the area inside the grey region, corresponding to 0.076 < τw < 0.76 Pa.
In order to better interpret the zone scatter plots at later time points as the cephalic vein undergoes geometric changes in response to the various mechanisms let us first consider the normal WSS behaviour prior to fistula creation. Recall that the normal WSS range, i.e. the NRP, within the cephalic vein is 0.076 to 0.76 Pa.
Figure 2 shows the zone scatter plot where ∆d*, representing the geometrical changes over a time interval ta to tb is plotted on the vertical axis and τw, representing the WSS at a given starting time ta, is plotted on the horizontal axis. Each data point on the zone scatter plot corresponds to the location where a computational grid line intersects the upper or lower wall. Therefore, there are two points on the scatter plot corresponding to locations measured along the vessel, one for the lower wall and one for the upper wall. However, the ∆d* is the same for points on both walls. This is due to the definition of a change in diameter which requires a point on each wall.
The scatter plot separates the vein response mechanisms into zones based on local ∆d* and τw behaviour. The gray shaded region identifies the normal WSS range 0.076 ≤ τw ≤ 0.76 Pa. If adaptation is present, then at ta there will be a location where the WSS will be below 0.076 Pa, and at tb there will be a corresponding local diameter constriction (∆d* < 0 in lower-half plane). Adaptation by definition can only occur via data points appearing in Zone I. Similarly, excess dilation with its net overall increase in vein diameter, and with global WSS remaining positive due to high fistula flowrates, can only be found for data points appearing in Zone III. Inward remodeling results in a negative ∆d*, but again the global WSS remains positive due to high fistula flowrates. Hence, inward remodeling can only be found for data points appearing in Zone IV. Lastly, if there is an existing local recirculation region and corresponding local WSS less than 0.076 Pa at ta, and if the local diameter enlarges by the time tb and the recirculation region is still present, then this appears as an aneurysm-type of structure, that can only appear as data points in Zone II.
As the vein responds to the extreme hemodynamics resulting from fistula creation, it is expected that the majority of data points would be found in Zones III and IV as these processes commonly occur throughout the vein during the arterialization process. Data points appearing in Zones I and II represent local mechanisms and generally have negative consequences that can result in access failure.
4. Results
Sample results from patient-specific CFD simulations are shown in Figure 3 indicating typical cephalic vein geometries and flow patterns for four different patient-specific geometries. Flow is from right to left in all cases. Actual values of the streamfunction are not as important as identifying flow patterns such as recirculation regions, and as such are not reported in any streamfunction plots. Note that the length scales differ in each of the subfigures due to including the full vein length. Contours of streamfunction are provided and regions where the WSS is less than 0.076 Pa are shown by a solid red colour line; recall that such regions may be susceptible to NH and stenosis via the adaptation mechanism. In this figure, postulated response mechanisms are identified based on the definitions in § 2. In part a, representing a case 12 months after fistula creation, there is local adaptation occurring at the start of the arch. However, the remainder of the vein experiences an enlarged diameter at this time due to global dilation resulting from the increased WSS and pressures as compared to the pre-fistula state. In part b, representing a case at TM, two small aneurysm-type structures (local expansion of the lumen) are observed to be present in the arch. At this point in time, only a small amount of overall dilation is observed. Another case at TM is shown in part (c). Here, the arch contains two large recirculation regions extending nearly the whole length of the arch with the associated negative WSS. A constriction is observed immediately upstream of the start of the arch. Note that here the arch angle, defined as the angle obtained from the intersection of straight lines originating at the inlet and outlet, is quite acute. Global dilation is observed in the remainder of the vein. Lastly, in part d, there is a case at TM with recirculation regions and an aneurysm-type of structure forming.
Figure 3.
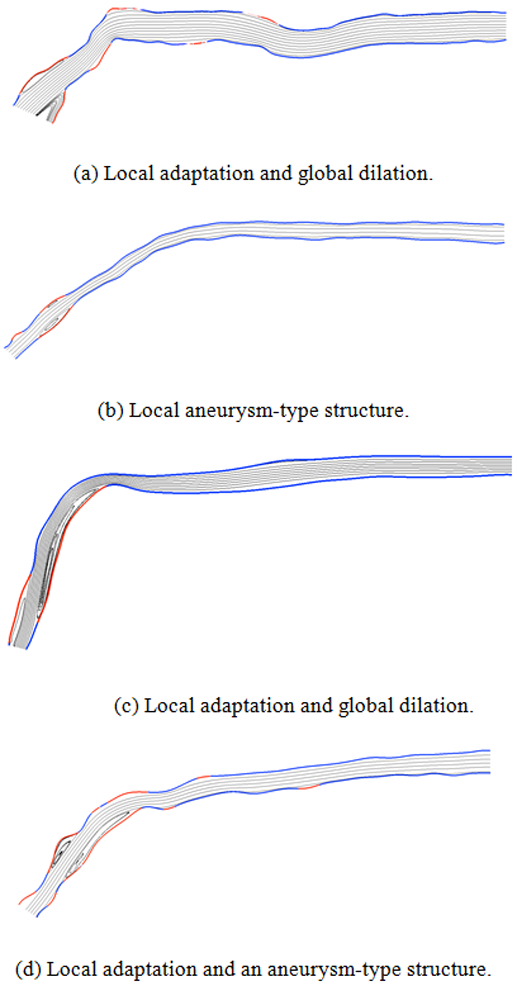
Examples of patient-specific cephalic veins illustrating typical flow patterns, low wall shear stress regions, and postulated response mechanisms. Red colour indicates abnormally low wall shear stresses, i.e. τw < 0.076 Pa, and gray lines are streamlines. Note length scales are not identical due to different vein lengths.
The sample results illustrate a common and important finding for patients with BCFs in this study. Owing to the high inlet velocities resulting from fistula creation coupled with the natural anatomy of the curved cephalic arch, recirculation regions and low and/or negative WSS regions are quite common in the arch. Next, we look at the implications of having low WSS over long time intervals and characterize several vein responses, with the primary focus on identifying vein adaptation.
4.1. Normal WSS for cephalic vein
Figure 4 shows WSS results from 12 patient-specific CFD simulations with patient-specific velocities and viscosities prior to fistula creation (t = 0, this time is termed mapping). The WSS data at mapping is taken from Hammes et al. [27] and is being replotted using the topographical zonal plot methodology. The change in diameter, in this case, from t = 0 to TM, is plotted on the vertical axis, and WSS prior to fistula creation is plotted on the horizontal axis. The red dashed vertical lines indicate the WSS threshold values of 0.076 and 0.76 Pa. It can be seen that for the ESRD patients in this study before fistula creation, the WSS values range from just below 0 Pa to approximately 2.5 Pa; however, the majority of data points are within the NPR and the average WSS is 0.22 Pa (denoted by red *). Note in particular that the pre-fistula cephalic veins have adjusted such that their WSS values are predominantly just above the critical 0.076 Pa threshold. The pre-fistula geometries in this subset of patients do show some irregularities in the vessel wall, possibly due to existing chronic kidney disease or pre-existing NH. As a result, local WSS values below 0.076 Pa and above 0.76 Pa are expected. There is reasonably good agreement between the pre-fistula vein WSS data identified in this investigation and the NPR. As a result, there is a strong basis for using 0.076 to 0.76 Pa as the NPR for the cephalic vein when establishing if the adaptation principle occurs in veins.
Figure 4.

Wall shear stresses plotted on horizontal axis for cephalic vein prior to BCF creation in 12 patients based upon ESRD patient-specific geometries, and measured velocities and viscosities. NPR of 0.076 < τw < 0.76 Pa is area between red dashed lines. Here, the average WSS is 0.22 Pa and is denoted by red *. This is the same data as Figure 3 of Hammes et al. [27] plotted in the present format.
4.2. Restoration of venous WSS
We now show how the zone scatter plots assist in elucidating the underlying mechanisms that lead to geometry change in an effort to restore WSS to the NPR. This section illustrates the utility of the zone scatter plot for characterizing two patient cases at various stages of adaptation. A remarkable case is presented here showing that adaptation occurs in the cephalic vein. For comparison, a typical case is also shown representing the more common scenario where WSS values are not restored to the NPR, i.e. adaptation is interrupted, due to a surgical intervention to correct a stenosis.
4.2.1. Case 1 - successful adaptation demonstrated
The adaptation response can be identified by examining the zone scatter plot over several successive time intervals. At some point in time after fistula creation there is the appearance of data points in Zone I, typically this occurs at 12 months. Data points appear in Zone I when there are local recirculation regions leading to WSS below NPR at the initial time and a subsequent net local diameter reduction over the time interval. When adaptation begins the vein diameter is reduced via NH and stenosis. This increases local velocity gradients, and WSS at the vessel wall and data points move from Zone I to the NPR (gray region in Figure 2). Note that the occurrence of adaptation is highly sensitive to arch curvature and inlet flow velocity.
Figure 5 shows the evolution of a cephalic vein over approximately 24 months since fistula creation. Figure 6 shows the zone scatter plots corresponding to the streamfunction, ψ, and WSS, τw, contour plots of Figure 5. In Figure 5(a) at the TM, two recirculation regions are present, and the WSS is negative in most of the arch. Arrows denote a future adaptation location. Note that the length scales are not identical due to different vein lengths. In Figure 6(a), representing the time interval from TM to 12 months, adaptation is already present and most of the data points are outside the NPR. At this time. dilation and remodeling are observed, i.e. zones III and IV. At 12 months, the adaptation response is completing as there are no data points remaining in Zone I in Figure 6(b). Other responses are still present at this time including a significant number of data points in Zone II, cf. aneurysm-type of structures in Figure 5(b) Interestingly, Figure 5(c) shows that only two small locations near the outlet remain below the NPR by a time of 24 months after fistula creation. Corresponding to this, Figure 6(c) shows, remarkably, that adaptation has essentially restored the WSS to the NPR in the vein and arch.
Figure 5.

Case 1: ψ-τw contour plots illustrating cephalic vein adaptation for patient 26. τw < 0.076 Pa denoted by red lines.
Figure 6.

Case 1: Adaptation in cephalic vein for patient 26, cf. Fig. 5.
Although the adaptation process has been successful in this case, it has done so in a manner that adversely affects hemodialysis. The developing stenosis, identified by the large values of ∆d* in Figure 6(c), dramatically increases the resistance to blood flow, thereby causing a significant decrease in flow rate, i.e. from 370 mL/min at 12 months to 10 mL/min at 24 months. Although this decrease is bringing the WSS back within the NPR, it is inadequate for continued hemodialysis treatment. Having complete restoration of WSS is a rare situation. A typical case is shown next.
4.2.2. Case 2 - adaptation interrupted by an intervention
This example represents a more common zone scatter plot and is shown in Figure 7. In part a, showing the time interval from zero months to TM, there is a small amount of adaptation as only a few points are in zone I, possibly due to irregular wall geometry causing small recirculation regions and WSS slightly less than 0.076 Pa. At TM in part b, adaptation is observed to be in progress and further adaptation is evident in zone I in part c at 12 months. However, at the time when CAS occurs at 24 months, there is no return of the WSS to the NPR. The vein’s response mechanisms have not had sufficient time to restore the WSS to the NPR before an intervention was required to maintain access.
Figure 7.

Case 2: Adaptation interrupted by surgical intervention for patient 14 (typical scenario).
5. Discussion
It is known that the adaptation principle applies in arteries such that the diameter adjusts to maintain a target WSS of approximately 1.5 Pa. This investigation, by taking advantage of the accelerated venous response mechanisms resulting from the extreme flow rates due to fistula creation, provides evidence that the cephalic vein in particular, and potentially the venous system as a whole, is governed by a similar adaptation principle. For the cephalic vein specifically, the data in this study suggests that it adapts to maintain a target WSS of 0.076 to 0.76 Pa.
In hemodialysis vascular access, however, full venous adaptation is found to be quite rare. This situation of complete adaptation was observed in one case out of a total of 35 cases. This is because letting the stenoses (adaptation) progress until the NPR of WSS for the cephalic vein is restored would dramatically reduce flow in the vein to the point where it adversely affects hemodialysis. As a result, there are protocols to treat the stenoses quickly, once it is identified, to maintain vascular access patency. This intervention occurs well before the adaptation can be completed in most veins. Thus, it is rare to find cases that show the full restoration of WSS to NPR.
6. Conclusion
A novel quantitative and graphical method, termed a “zone scatter plot”, that assists in observing the vein’s response mechanisms such as adaptation, dilation, and remodeling resulting from the extreme, non-physiological hemodynamics present in hemodialysis fistulae is developed in this study. The method tightly integrates measured clinical data (geometry, blood velocity, and viscosity) with computed hemodynamics data (velocity, pressure, WSS, etc.) at successive time points as the vessel evolves. This new tool is employed to confirm that adaptation occurs in veins of patients with ESRD after fistula creation in a manner similar to that in arteries.
The adaptation principle provides the connection between low or negative WSS and NH and subsequent stenosis in arteries. This is the first study involving veins that connects low WSS to NH and subsequent stenosis, and confirms that the NPR of WSS is ultimately restored, i.e. adaptation occurs in a manner similar to arteries.
Acknowledgement(s)
The authors acknowledge and sincerely thank J. Hines for assistance with patient enrollment and data acquisition.
Funding
Research reported in this publication was supported by the National Institute of Diabetes And Digestive And Kidney Diseases (NIDDK) of the National Institutes of Health under Award Number R01DK090769. The content is solely the responsibility of the authors and does not necessarily represent the official views of the National Institutes of Health.
Nomenclature
- BCF
Brachiocephalic Fistula
- CAS
Cephalic Arch Stenosis
- ESRD
End State Renal Disease
- NH
Neointimal Hyperplasia
- NPR
Normal Physiological Range
- Q
Volumetric flowrate
- R
Radius of vessel
- TM
Time of Maturation
- WSS
Wall Shear Stress
- d
Diameter of vessel
- da
Local diameter of vessel at time a
- db
Local diameter of vessel at time b
- da
Average of da(s) at time a
- db
Average of db(s) at time b
- dcorr
Diameter correction
- s
Distance along vessel
- ta
Time at a
- tb
Time at b
- μ
Dynamic viscosity
- ψ
Streamfunction
- ∆d*
Normalized change in diameter over time interval, ∆t
- ∆t
Time interval, tb - ta
- τw
Wall shear stress
Footnotes
Disclosure statement
The authors report no conflicts of interest. No benefits in any form have been received from a commercial party related directly or indirectly to the subject of this manuscript.
7. References
- [1].Miller P, Tulwani A, Lusey C, and et al. , 1999. “Predictors of adequacy of arteriovenous fistulas in hemodialysis patients”. Kidney Int, 56, pp. 275–286. [DOI] [PubMed] [Google Scholar]
- [2].Rodriguez J, Armandans L, Ferrer E, Olmos A, Cordina S, Bartolome J, Borrelas J, and Piers L, 2000. “The function of permanent vascular access”. Nephrol Dial Transplant, 15, pp. 402–408. [DOI] [PubMed] [Google Scholar]
- [3].Hammes M, Funaki B, and Coe F, 2008. “Cephalic arch stenosis in patients with fistula access for hemodialysis: relationship to diabetes and thrombosis”. Hemodial Int, 12, pp. 85–89. [DOI] [PubMed] [Google Scholar]
- [4].Jaberi A, Schwartz D, Marticorena R, Dacouris N, Prabhudesai V, McFarlane P, and Donnelly S, 2007. “Risk factors for the development of cephalic arch stenosis”. J Vasc Access, 8, pp. 287–295. [PubMed] [Google Scholar]
- [5].Sivananthan G, Menashe L, and Halin N, 2014. “Cephalic arch stenosis in dialysis patients: review of clinical relevance, anatomy, current theories on etiology and management”. J Vasc Access, 15, pp. 157–162. [DOI] [PubMed] [Google Scholar]
- [6].Albayrak R, Yuksel S, Colbay M, Degirmenci B, Acarturk G, Haktanir A, and Karaman O, 2006. “Hemodynamic changes in the cephalic vein of patients with hemodialysis arteriovenous fistula”. J Clin Ultrasound, 35, pp. 133–137. [DOI] [PubMed] [Google Scholar]
- [7].Hammes M, Boghosian M, Cassel K, Funaki B, and Coe F, 2009. “Characteristic differences in cephalic arch geometry for diabetic and non-diabetic ESRD patients”. Nephrol Dial Transplant, 24(7), pp. 2190–2194. [DOI] [PubMed] [Google Scholar]
- [8].Konner K, Nonnast-Daniel B, and Ritz E, 2003. “The arteriovenous fistula”. J Am Soc Nephrol, 14, pp. 1669–1680. [DOI] [PubMed] [Google Scholar]
- [9].Klan K, and Asif A, 2008. “Cephalic arch stenosis”. Semin Dial, 21, pp. 78–82. [DOI] [PubMed] [Google Scholar]
- [10].Rajan D, Clark T, Patel N, Stavropoulos S, and Simons M, 2003. “Prevalence and treatment of cephalic arch stenosis in dysfunctional autogenous hemodialysis fistulas”. J Vasc Interv Radiol, 14, pp. 567–573. [DOI] [PubMed] [Google Scholar]
- [11].Roy-Chaudhury P, Sukhatme V, and Cheung A, 2006. “Hemodialysis vascular access dysfunction: a cellular and molecular viewpoint”. J Am Soc Nephrol, 17, pp. 1112–1127. [DOI] [PubMed] [Google Scholar]
- [12].Fitts M, Pike D, Anderson K, and Shiu Y-T, 2014. “Hemodynamics shear stress and endothelial dysfunction in hemodialysis access”. Open Urol Nephrol J, 7, pp. 1–25. [DOI] [PMC free article] [PubMed] [Google Scholar]
- [13].Hammes M, 2015. “Hemodynamics and biologic determinants of arteriovenous fistula outcomes in renal failure patients”. Biomed Res Int, 10.1155/2015/171674, pp. 1–7. [DOI] [PMC free article] [PubMed] [Google Scholar]
- [14].Remuzzi A, and Ene-lordache B, 2013. “Novel paradigms for dialysis vascular access: upstream hemodynamics and vascular remodeling in dialysis access stenosis”. Clin J Am Soc Nephrol, p. doi= 10.2215/CJN.03450413. [DOI] [PMC free article] [PubMed] [Google Scholar]
- [15].Ene-lordache B, and Remuzzi A, 2012. “Disturbed flow in radial-cephalic arteriovenous fistulae for haemodialysis: low and oscillating shear stress locates the sites of stenosis”. Nephrol Dial Transplant, 27, pp. 358–368. [DOI] [PubMed] [Google Scholar]
- [16].He Y, Terry C, Nguyen C, Berceli S, and Shiu Y-T, 2013. “Serial analysis of lumen geometry and hemodynamics in human arteriovenous fistula for hemodialysis using magnetic resonance imaging and computational fluid dynamics”. J Biomech, 46, pp. 165–169. [DOI] [PMC free article] [PubMed] [Google Scholar]
- [17].Kharboutly Z, Fenech M, Treutenaere J, Claude I, and Legallais C, 2007. “Investigations into the relationship between hemodynamics and vascular alterations in an established arteriovenous fistula”. Med Eng Phys, 9, pp. 999–1007. [DOI] [PubMed] [Google Scholar]
- [18].McGah P, Leotta D, Beach K, Zierler R, and Aliseda A, 2013. “Incomplete restoration of homeostatic shear stress within arteriovenous fistulae”. J Biomech Eng, 135, p. doi= 10.1115/1.4023133. [DOI] [PMC free article] [PubMed] [Google Scholar]
- [19].Niemann A, Udesen J, Thrysoe S, Nygaard J, Frund E-T, Petersen S, and Hasenkam J, 2010. “Can sites prone to flow induced vascular complications in a-v fistulas be assessed using computational fluid dynamics?”. J Biomech, 43, pp. 2002–2009. [DOI] [PubMed] [Google Scholar]
- [20].Sigovan M, Rayz V, Gasper W, Alley H, Owens C, and Saloner D, 2012. “Vascular remodeling in autogenous arteriovenous fistulas by MRI and CFD”. Ann Biomed Eng, 41, pp. 657–668. [DOI] [PMC free article] [PubMed] [Google Scholar]
- [21].Boghosian M, Cassel K, Hammes M, Funaki B, Kim S, Qian X, Wang X, Dhar P, and Hines J, 2014. “Hemodynamics in the cephalic arch of a brachiocephalic fistula”. Med Eng Phys, 36, pp. 822–830. [DOI] [PMC free article] [PubMed] [Google Scholar]
- [22].Rothuizen T, Wong C, Quax P, Jan van Zonneveld A, Rabelink T, and Rotmans J, 2013. “Arteriovenous access failure: more than just intimal hyperplasia?”. Nephrol Dial Transplant, 28, pp. 1085–1092. [DOI] [PubMed] [Google Scholar]
- [23].Ward M, Pasterkamp G, Yeung A, and Borst C, 2000. “Arterial remodeling: mechanisms and clinical implications”. Circulation, 102, pp. 1186–1191. [DOI] [PubMed] [Google Scholar]
- [24].Malek A, Alper S, and Izumo S, 1999. “Hemodynamic shear stress and its role in atherosclerosis”. J Am Med Assoc, 282, pp. 2035–2042. [DOI] [PubMed] [Google Scholar]
- [25].Van Tricht I, De Wachter D, Tordoir J, and Verdonck P, 2005. “Hemodynamics and complications encountered with arteriovenous fistulas and grafts as vascular access for hemodialysis: a review”. Ann Biomed Eng, 33, pp. 1142–1157. [DOI] [PubMed] [Google Scholar]
- [26].Loscalzo J, and Schafer A, eds., 1994. Hematology: Thrombosis and Hemorrhage. Blackwell Scientific, Boston. [Google Scholar]
- [27].Hammes M, Boghosian M, Cassel K, Watson S, Funaki B, Doshi T, Mahmoudzadeh Akherat S, Hines J, and Coe F, 2016. “Increased inlet blood flow velocity predicts low wall shear stress in the cephalic arch of patients with brachiocephalic fistula access”. PLoS ONE, 10.1371/journal.pone.0152873, pp. 1–18. [DOI] [PMC free article] [PubMed] [Google Scholar]
- [28].Hoi Y, Gao L, Tremmel M, Paluch R, Siddiqui A, Meng H, and Mocco J, 2008. “In vivo assessment of rapid cerebrovascular morphological adaptation following acute blood flow increase”. J Neurosurg, 109, pp. 1141–1147. [DOI] [PMC free article] [PubMed] [Google Scholar]
- [29].Wentzel J, Gijsen F, Stergiopulos N, Serruys P, Slager C, and Krams R, 2003. “Shear stress, vascular remodeling and neointimal formation”. J Biomech, 36, pp. 681–688. [DOI] [PubMed] [Google Scholar]
- [30].Gibbons G, and Dzau V, 1994. “The emerging concept of vascular remodeling”. N Engl J Med, 330, pp. 1431–1438. [DOI] [PubMed] [Google Scholar]
- [31].Glagov S, 1994. “Intimal hyperplasia, vascular modeling, and the restenosis problem”. Circulation, 89, pp. 2888–2891. [DOI] [PubMed] [Google Scholar]
- [32].Mulvany M, 1999. “Vascular remodeling of resistance vessels: can we define this?”. Cardio Res, 41, pp. 9–13. [DOI] [PubMed] [Google Scholar]