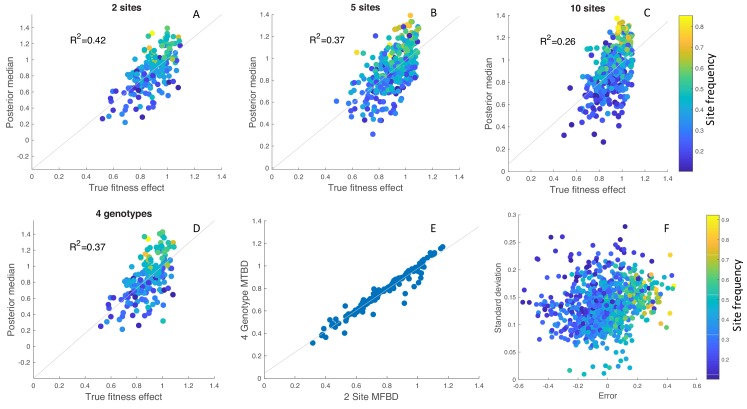
Figure 6. Inference of site-specific fitness effects from simulated phylogenies.
(A–C) Correlation between the true and estimated posterior median fitness effects for phylogenies simulated with 2, 5 or 10 evolving sites. Results are aggregated over 100 simulated phylogenies, with each point representing an estimate for a single site and phylogeny. The points are colored according to the frequency of the mutant allele among sampled individuals in the phylogeny. (D) Fitness effects estimated under the exact MTBD model tracking all four possible genotypes for the same two site simulations as in A. (E) Correlation between the site-specific fitness effects estimated under the approximate MFBD and exact MTBD for the two site simulations. (F) Error and uncertainty in estimated site-specific fitness effects across all 2, 5, and 10 site simulations. Error was calculated as the posterior median estimate minus the true fitness effect. Uncertainty was calculated as the standard deviation of the posterior values sampled via MCMC. In all simulations, sites where the Effective Sample Size of the MCMC samples was below 100 (less than 5% of all sites across simulations) were discarded. The death rate was fixed at but the birth, mutation and sampling rates were randomly drawn for each simulation from a prior distribution: Uniform(0.1,0.2); Exponential(0.01); Uniform(0,1). Only the birth rate was jointly inferred with the site-specific fitness effects.

