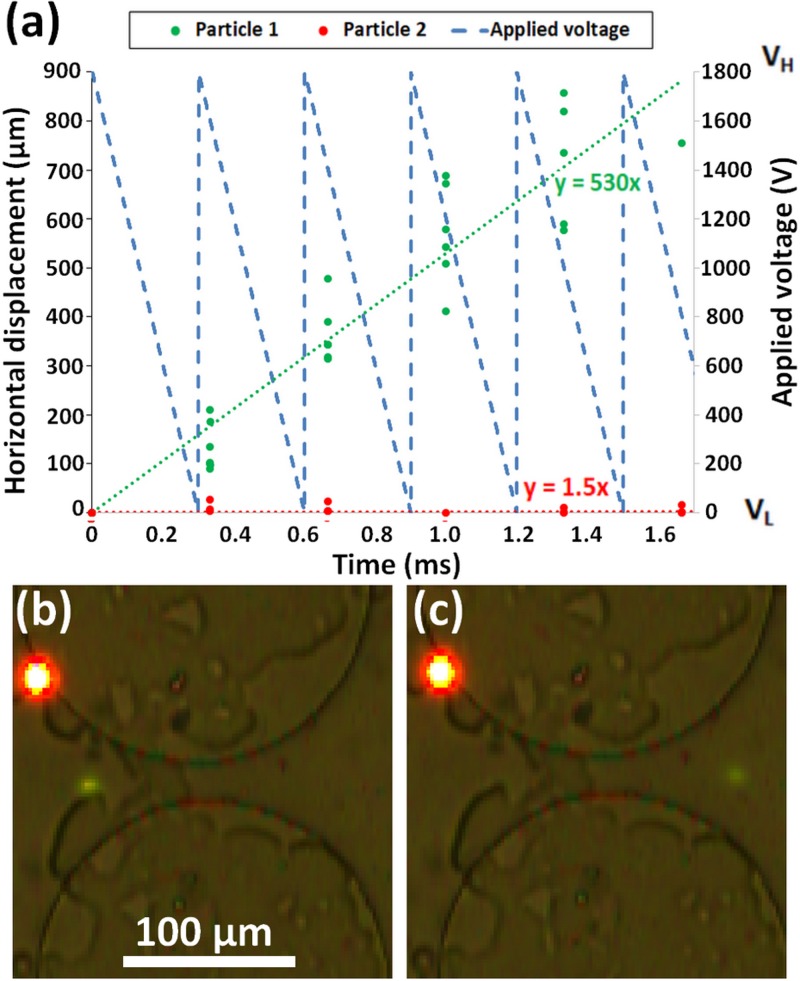
FIG. 4.
Separation of particle 1 (9.7 μm green) and 2 (10 μm red) by applying a sawtooth left signal. (a) Plot of experimental particle displacement of particle 1 shown in green and particle 2 shown in red. Linear curve fit for particle 1 shown with green dotted line and particle 2 shown with red dotted line. Equations for particle 1 and 2 curve fits are shown in green and red, respectively. Applied sawtooth left signal shown with dashed blue line. (b) Image of both particles trapped at a constriction between two posts. (c) Image of particle 1 (9.7 μm green) having migrated to the right side of postconstriction while particle 2 (10 μm red) is still on the left side of the constriction. Both particles are 10 μm in diameter but appear to be different sizes because of fluorescent intensity.

