Abstract
The family of bacterial SidE enzymes catalyzes phosphoribosyl-linked (PR) serine ubiquitination and promotes infectivity of Legionella pneumophilia, a pathogenic bacterium causing Legionnaires’ disease1,2,3. SidEs share the genetic locus with the Legionella effector SidJ that spatiotemporally opposes their toxicity in yeast and mammalian cells, through an unknown mechanism4–6. Deletion of SidJ leads to a significant defect in the growth of Legionella in both its natural host amoeba and in murine macrophages4,5. Here, we demonstrate that SidJ is a glutamylase that modifies the catalytic glutamate in the mono-ADPribosyl transferase (mART) domain of SdeA thus blocking its ubiquitin (Ub) ligase activity. SidJ glutamylation activity requires interaction with Calmodulin (CaM), a eukaryotic specific co-factor, and can be regulated by intracellular changes in Ca2+ concentrations. The cryo-EM structure of SidJ/human apo-CaM complex revealed the architecture of this unique heterodimeric glutamylase. In infected cells, we show that SidJ mediates glutamylation of SidEs on the surface of Legionella-containing vacuoles (LCVs). Using quantitative proteomics, we also uncovered multiple host proteins as putative targets of SidJ-mediated glutamylation. Collectively, this study reveals the mechanism of SidE ligases inhibition by a SidJ/CaM glutamylase and opens new avenues for studying protein glutamylation, an understudied protein modification in higher eukaryotes.
Keywords: ubiquitin, glutamylation, serine ubiquitination, Legionella, ADP-ribosylation
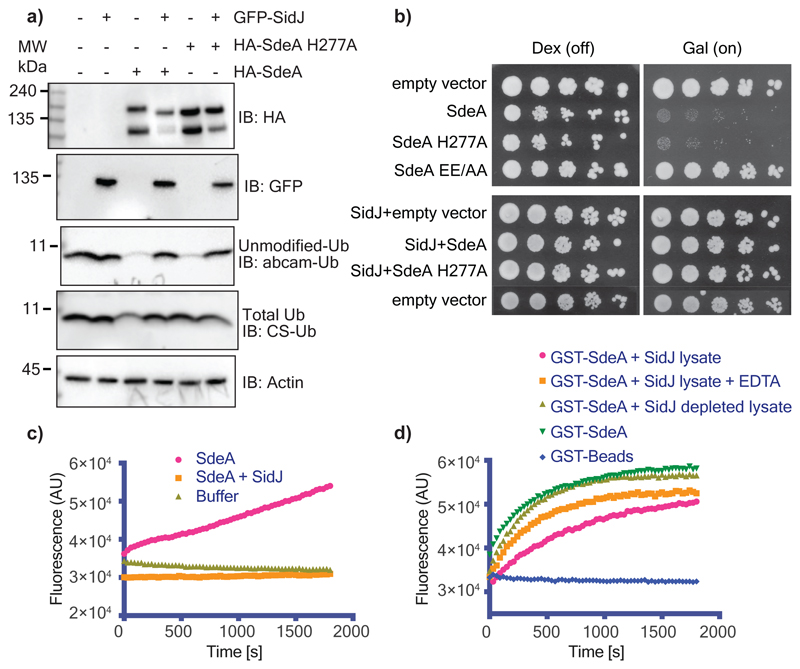
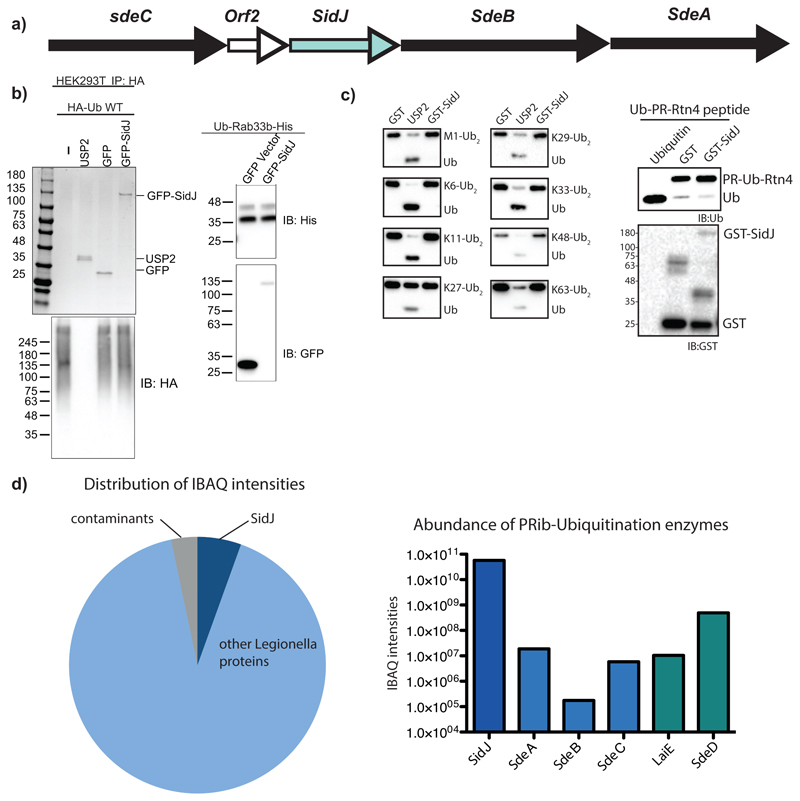
Legionella pneumophila contains ~300 effector proteins that modulate host cellular processes through diverse activities to aid in its infectious growth and survival1. Fourteen of those effectors including SidJ have been shown to directly suppress the activities of other Legionella effectors4,6,7. SidJ opposes the toxicity of the SidE class of ubiquitin ligases (SdeA, SdeB, SdeC and SidE) in yeast and mammalian cells. Deletion of SidJ in Legionella elicits significant growth defects likely due to the unhinged toxicity of SidEs4. In a recent report, SidJ was shown to act as a deubiquitinase (DUB) for canonical ubiquitination as well as SidE-mediated PR-ubiquitination, which might account for its anti-SidE activity of SidJ8. However, we could not detect intrinsic DUB activity of SidJ expressed in E. coli or in mammalian cells (Extended data Fig. 1a, b). Instead, we were able to identify SidJ-associated proteins with DUB activities that co-precipitated with SidJ isolated from Legionella lysate, potentially explaining the previous reported observations (Extended data Fig. 1c, d). SidEs contain an mART domain and a phosphodiesterase (PDE) domain, both of which sequentially perform ADP-ribosylation of ubiquitin (Ub) and substrate PR-ubiquitination, respectively2,3. Intriguingly, expression of SidJ with SdeA, one of the SidE family members, in HEK293T cells, abolished SdeA-mediated phosphoribosylation of Ub and also nullified ADP-ribosylation of Ub catalyzed by the PDE defective mutant SdeA-H277A that still retains mART activity (Fig. 1a)3. Consistently, yeast toxicity exerted by wild-type (WT) SdeA and SdeA H277A mutant, was rescued by co-expressing SidJ (Fig. 1b). Thus, we hypothesized that SidJ inhibits the first step of SdeA-mediated ubiquitination of substrates, which is mono-ADP-ribosylation of Ub. As expected, while SdeA alone showed robust ε-NAD+ hydrolysis, SdeA co-expressed with SidJ (SidJ-treated SdeA) failed to show mART activity (Fig. 1c). SidJ-expressing HEK293T cell lysate, but not untransfected or SidJ-depleted cell lysates, were able to block in vitro GST-SdeA-mediated ε-NAD+ hydrolysis (Fig. 1d). Addition of 10 mM EDTA to SidJ-expressing HEK293T lysate decreased its effect on SdeA activity. Moreover, E. coli purified SidJ was unable to catalyze such activities, indicating that SidJ may be a metal ion-dependent enzyme that requires mammalian co-factor(s) for its activity.
Figure 1. SidJ inhibits the Ub-ADP-ribosylation activity of SdeA.
a) SidJ and SdeA constructs were expressed as indicated in HEK293T cells and ubiquitin modification was probed using the Ub antibodies abcam-Ub and CS-Ub as described previously3. b) Yeast strain W303 was transformed using the indicated combination of constructs. Serial dilutions of transformed yeast were spotted on dextrose (repressing) or galactose (inducing) containing plates. SdeA EE/AA indicates mutation of E860, E862 to alanine. c) Purified SdeA from HEK293T cells expressing SdeA alone or in combination with SidJ was used in ε-NAD+ hydrolysis assays. Increase in the fluorescence indicates Ub-ADP ribosylation20. d) SdeA purified from E.coli was incubated with HEK293T cell lysate containing SidJ or depleted of SidJ. SdeA was subsequently purified using glutathione agarose beads and used in ε-NAD+ hydrolysis assays. Experiments in panels a-d were repeated thrice independently with similar results. For gel source data, see Supplementary Fig. 1.
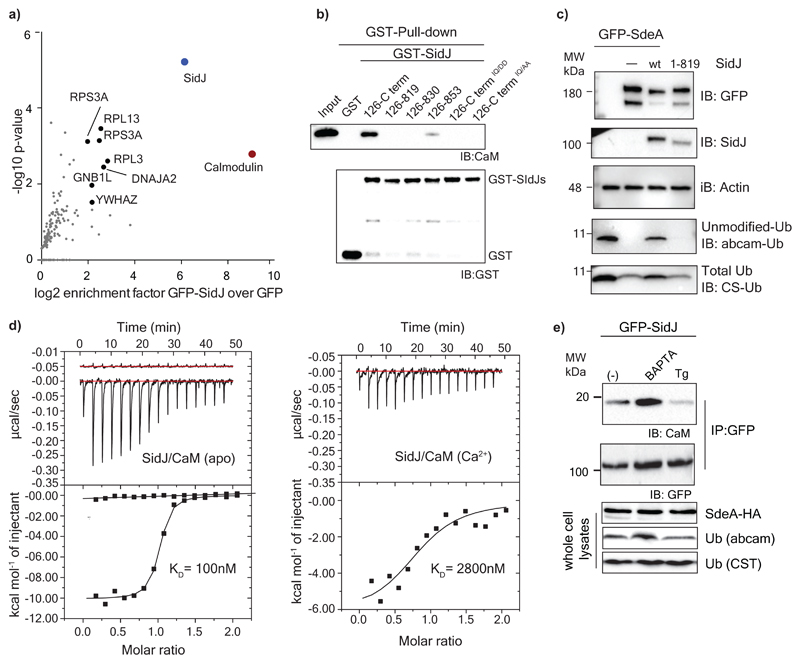
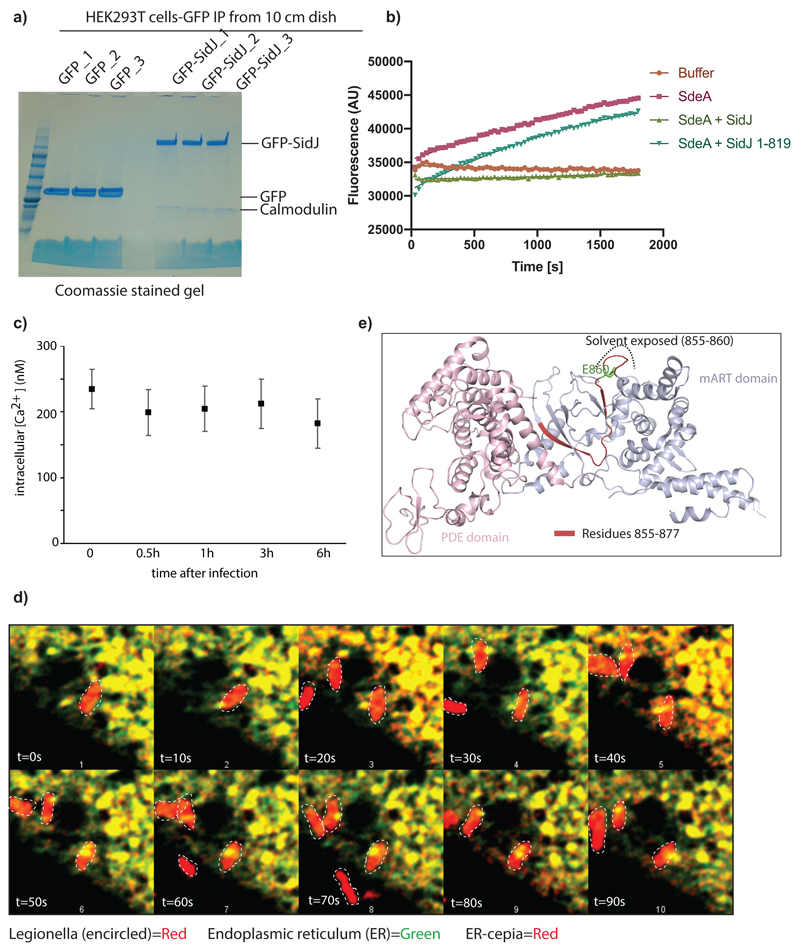
To identify the putative mammalian co-factor(s) necessary for the activity of SidJ, we expressed GFP-SidJ in HEK293T cells and performed immunoprecipitation (IP) followed by mass spectrometry (MS). Calmodulin (CaM) emerged as the strongest interactor of SidJ (Fig. 2a; Extended data Fig. 2a). HHpred analysis of SidJ sequence revealed a C-terminally located IQ motif, a well-known CaM-interacting module9, and its mutation (I841, Q842 to D or A) or deletion (SidJ 1-819 or SidJ-ΔIQ) resulted in the loss of binding to CaM (Fig. 2b). Co-expression of SidJ-ΔIQ with SdeA did not lead to inhibition of SdeA activity in cells (Fig. 2c), nor SdeA-catalyzed ε-NAD+ hydrolysis in vitro (Extended data Fig. 2b). Interestingly, apo-CaM interacted with SidJ with a Kd of ~100 nM, whereas Ca2+-loaded CaM bound to SidJ with a Kd of 2800 nM indicating that Ca2+ binding to CaM reduces the CaM/SidJ interaction strength by nearly 30-fold (Fig. 2d). Treating HEK293T cells with either BAPTA (a Ca2+ chelator) or thapsigargin (a sarco/endoplasmic reticulum (ER) Ca2+-ATPase pump inhibitor) demonstrated that the reduction of cytosolic free Ca2+ in cells increased the binding between SidJ and CaM and correspondingly increased the inhibitory activity of SidJ towards SdeA and vice versa (Fig. 2e). Although global Ca2+ concentrations do not significantly differ during Legionella infection (Extended data Fig. 2c), we observed local dynamics of Ca2+ levels at the ER and the ER-Legionella contact sites (Extended data Fig. 2d, Supplementary video 1) that could play a role in the regulation of SidJ/CaM activity in vivo.
Figure 2. Calmodulin is a host-specific factor activating SidJ.
a) GFP-SidJ was expressed in HEK293T cells. After immunoprecipitation of SidJ, the sample was analyzed using mass spectrometry and enriched proteins were quantified using the MaxQuant label-free algorithm. n= 3 biologically independent experiments. Statistically significant differences between samples were detected by a permutation based False Discovery Rate (FDR) 0.05 corrected one-sided Student's t-test b) Various SidJ constructs were used to pull-down Calmodulin to test the effect of IQ motif mutations and deletions. c) SdeA was expressed in HEK293T cells alone and in combination with WT SidJ or SidJ lacking the IQ motif region. Ubiquitin modification was followed using Ub-abcam and Ub-CS antibodies. d) Isothermal titration calorimetry was performed to measure the affinity between SidJ and apo or Ca2+-bound CaM. e) Interaction between GFP-SidJ and Calmodulin was analyzed using co-IP in low (treatment with BAPTA) or high (treatment with thapsigargin, Tg) cytosolic Ca2+ levels. Experiments in panels b-e were repeated thrice independently with similar results. For gel source data, see Supplementary Fig. 1.
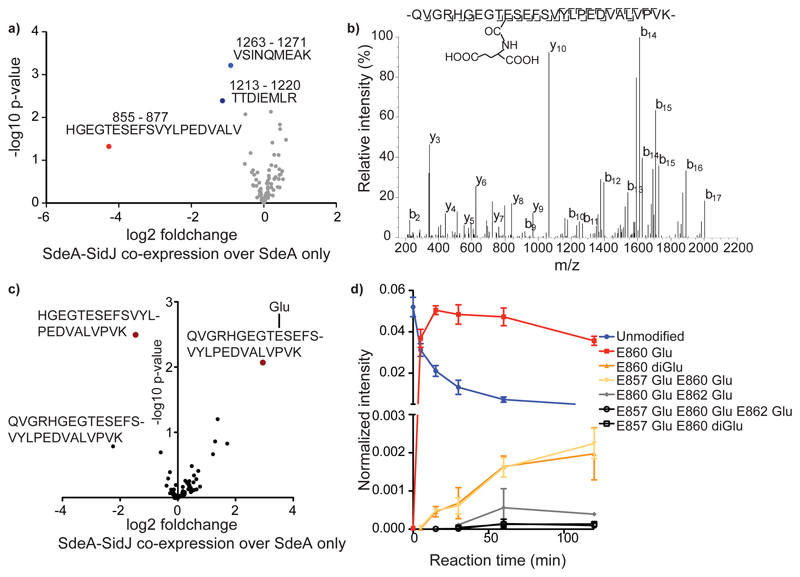
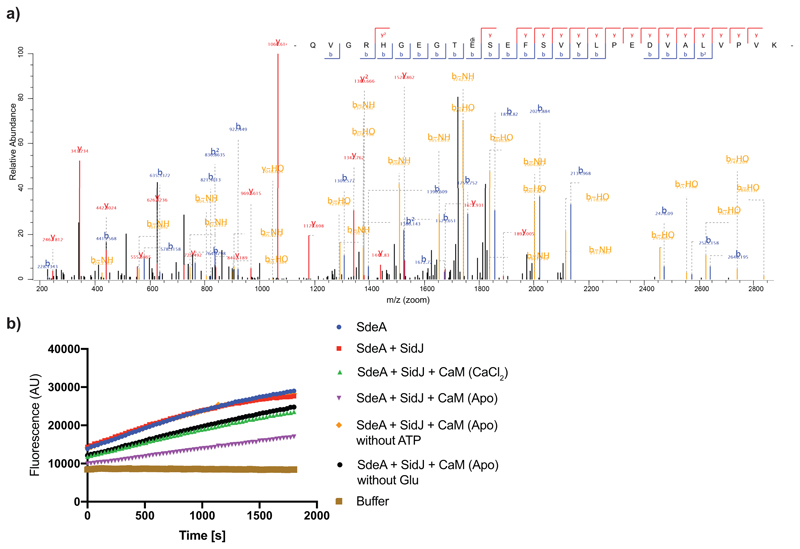
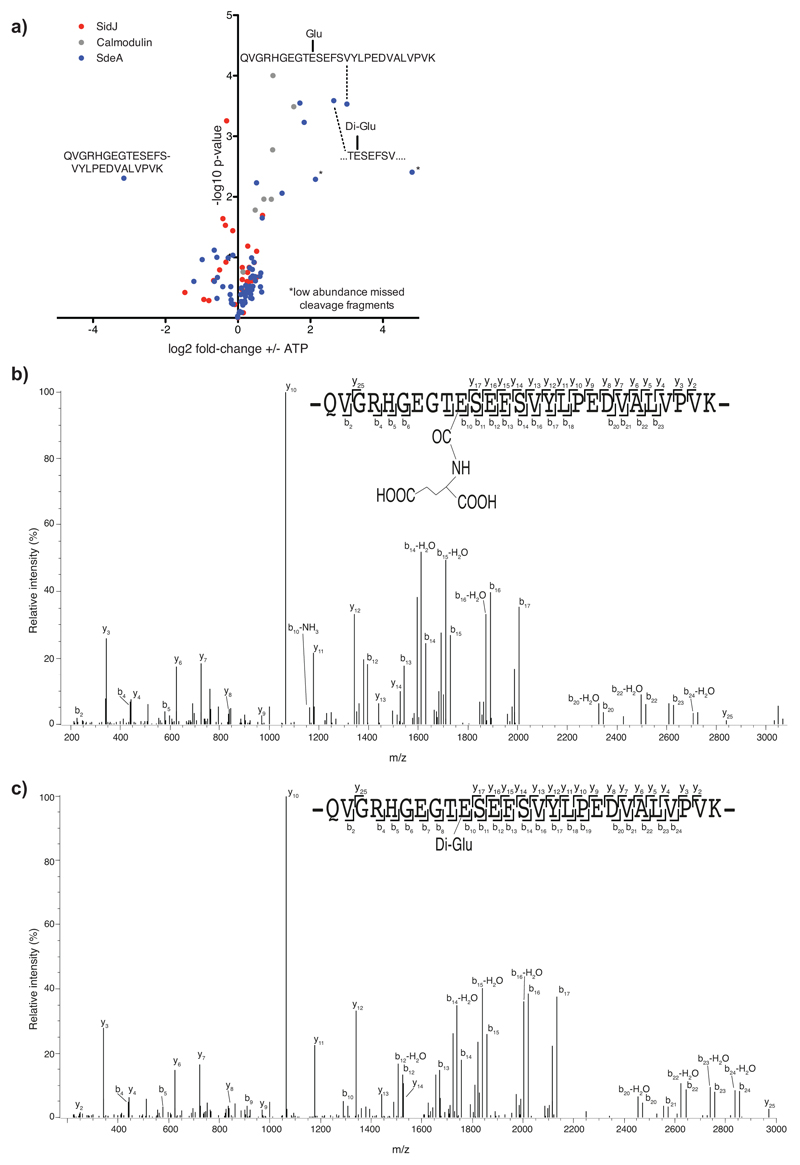
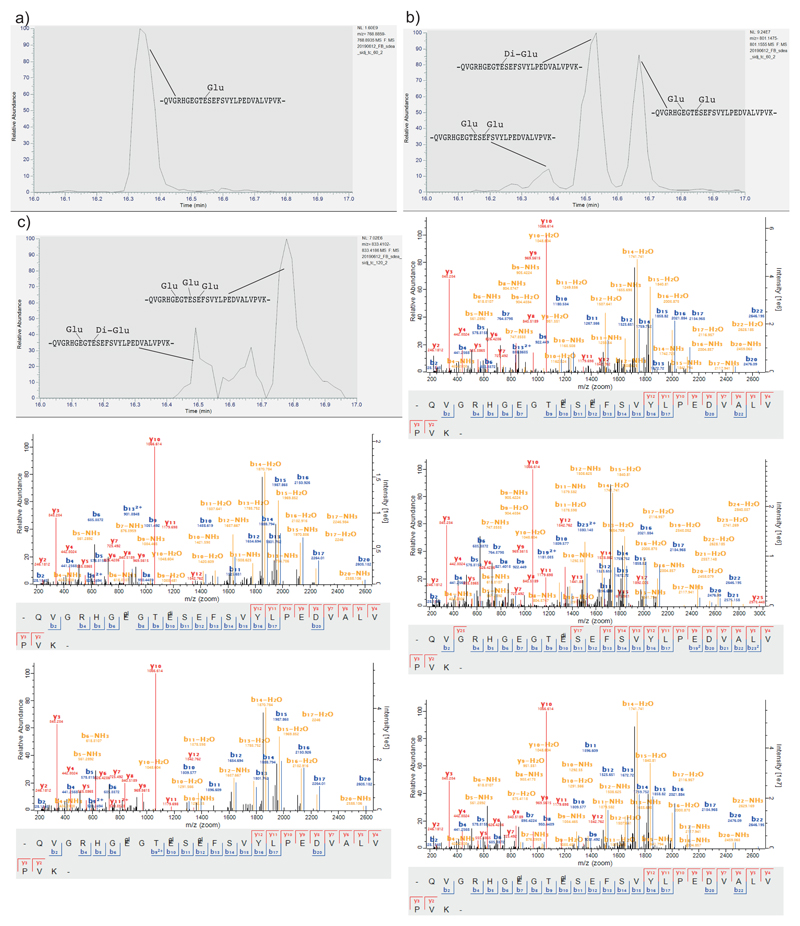
To unravel the mechanism by which SidJ impacts SdeA activity, we tested if SidJ is adding an inactivating post-translational modification on SdeA. To this end, we immuno-precipitated (IPed) SdeA and SidJ-treated SdeA from HEK293T cells followed by quantitative MS analysis. Although data analysis using MaxQuant and PTM discovery did not directly reveal any SdeA modification, we noted that one of the SdeA tryptic peptides (residues 855-877), that lines the active site of mART domain, was severely underrepresented or not identified in SidJ-treated SdeA samples, suggesting that this region of SdeA may be undergoing an uncommon modification by SidJ (Fig. 3A). Most of the region spanning between residues 855 and 877 is not accessible to solvent (Extended data Fig. 2e), except residues 855-860, which form a solvent-accessible loop containing the catalytic E860. To generate a slightly longer, but higher charged peptide of this loop, we used Lys-C to digest SidJ-modified SdeA and performed a PTM discovery analysis on the resulting peptides10. This revealed mono- and to a lesser extent di-glutamate conjugation to E860 of SdeA (Fig. 3b, Extended data Fig. 3a). Moreover, TMT-quantification of SdeA alone and SidJ-treated SdeA showed close to quantitative glutamylation of E860 (Fig. 3c). To recapitulate the glutamylation of SdeA in vitro, SdeA was treated with SidJ purified from E. coli with or without CaM, in the presence of ATP, Mg2+ and L-Glutamate. SidJ attenuated the ε-NAD+ hydrolysis activity of SdeA in an ATP- and CaM-dependent manner (Extended data Fig. 3b). MS analysis of in vitro SidJ reactions confirmed that SdeA E860 undergoes glutamylation by SidJ/CaM in an ATP-dependent manner (Extended data Fig. 4a-c). MS analysis of time-resolved in vitro glutamylation reactions revealed that SidJ/CaM targets SdeA preferentially by mono-glutamylation (Fig. 3d, Extended data Fig. 5a-d). In prolonged reactions, we observed multiple modification states of SdeA including E857 and E862 glutamylation events. We did not detect poly-glutamylation (>3 glutamates) of SdeA by SidJ, neither in vitro nor in cellulo (Fig. 3d and Extended data Fig. 4 and 5), indicating that SidJ/Cam is primarily a mono-glutamylating enzyme.
Figure 3. SidJ is a calmodulin-dependent glutamylase.
a) Co-expression of SdeA with SidJ and of SdeA alone was performed in n=3 biologically independent experiments. Samples were labeled with TMT 6 plex reagent and analyzed in one LC-MS run. Significant differences between samples were detected by a two-sided Student's t-test. Quantitative analysis of SdeA peptides under these conditions is represented in a volcano plot. b) Annotated mass spectra for glutamylation of SdeA E860 c) For quantitative information about the modification, we purified GFP-SdeA expressed alone or co-expressed with SidJ and digested it with LysC. TMT quantification revealed mass close to quantitative conversion of the peptide spanning the catalytic loop to its glutamylated form. n=3 biologically independent experiments. Significant differences between samples were detected by a two-sided Student's t-test. d) Intensities of differentially modified versions of the QVGRHGEGTESEFSVYLPEDVALVPVK peptide (catalytic center of mART domain) are plotted as fraction of total SdeA intensity over the time of an in vitro reaction, proving E860 mono-glutamylation to be the primary reaction of SidJ. In vitro glutamylation and label-free LC-MS analysis was performed in n=3 biologically independent experiments. Data points are mean centered; error bars indicate standard deviation.
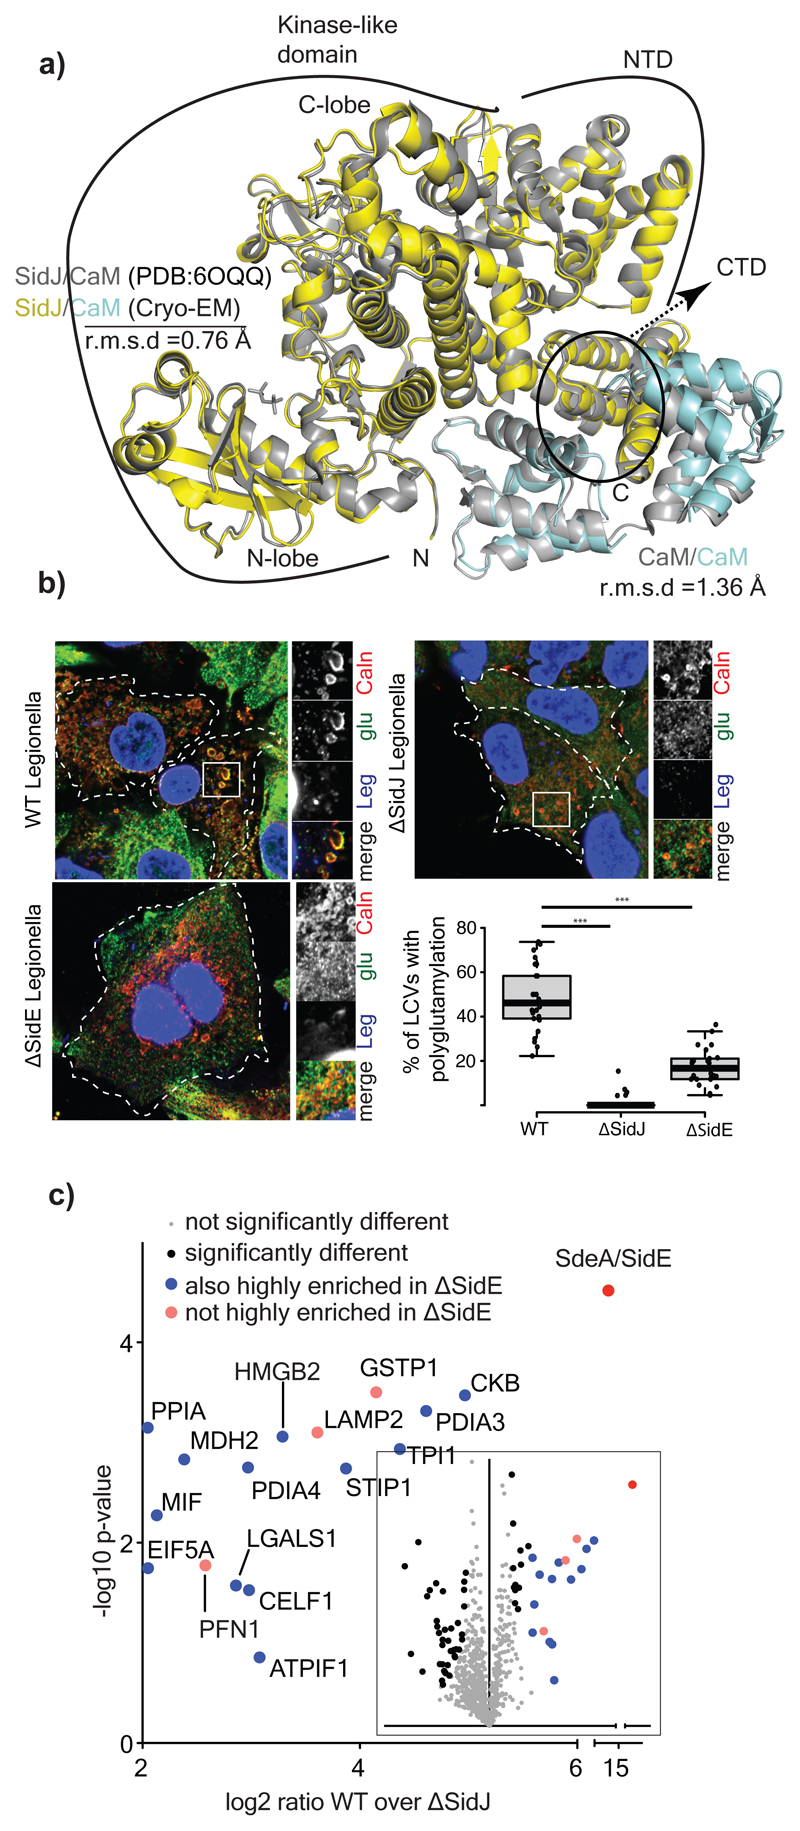
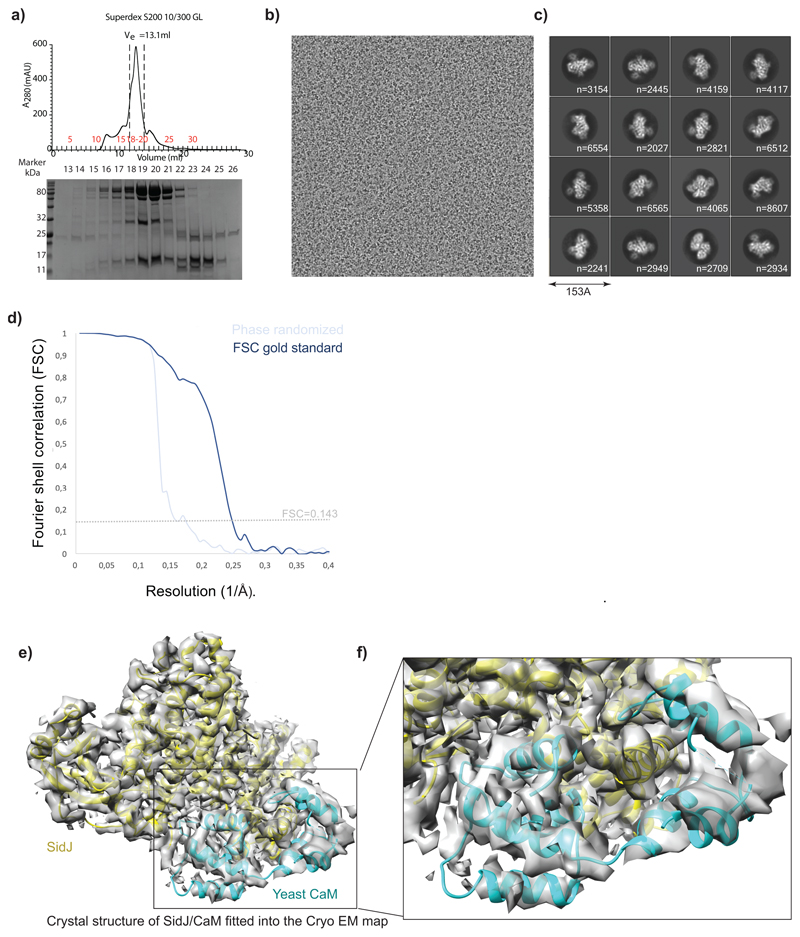
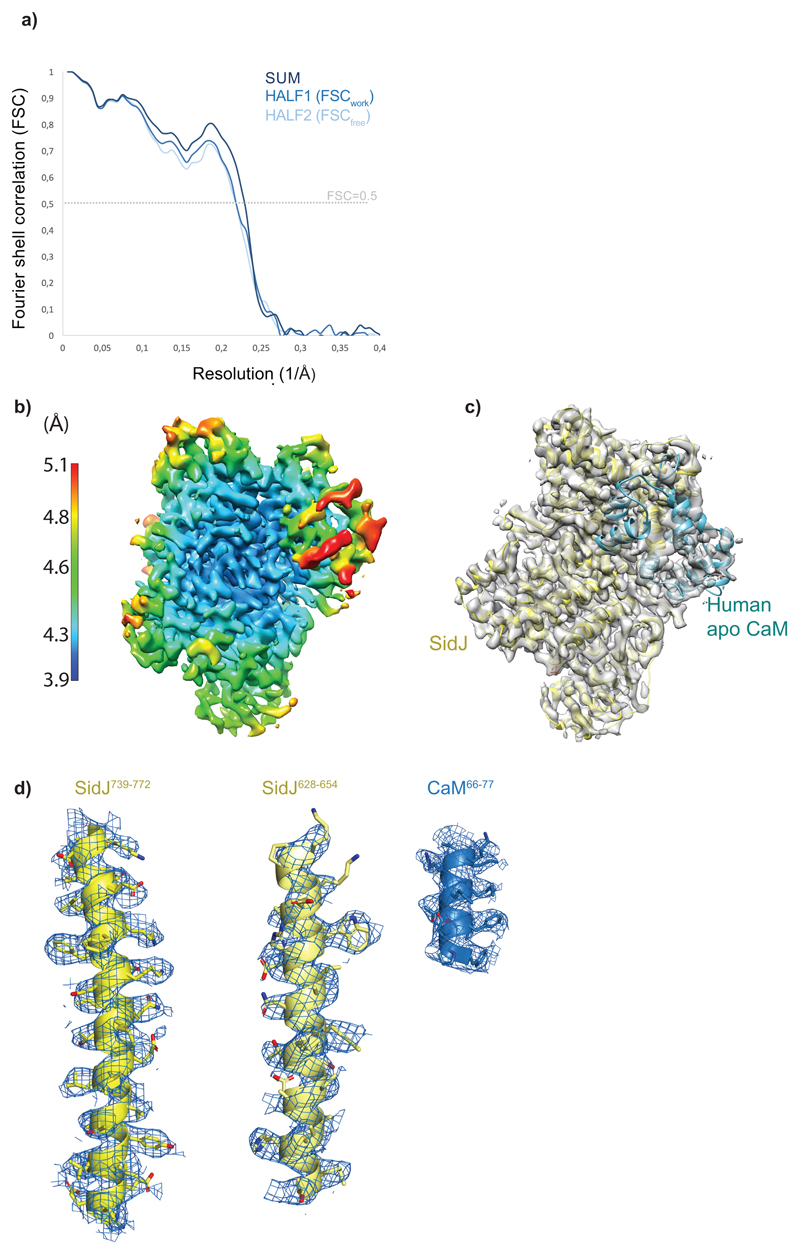
To gain insights into the mechanism of glutamylation by SidJ, we sought to determine the structure of SidJ/human-apo CaM complex (Extended data Fig. 6a). Using single particle cryo-electron microscopy (EM), we obtained a 3D reconstruction of the SidJ/CaM complex at a nominal resolution of 4.1Å (Extended data Fig. 6b-d, Extended data Fig. 7). Although we could build a partial de novo model using the EM map, we resorted to using the high-resolution crystal structure of SidJ/CaM complex as our initial model11, which was deposited while our cryo-EM work was underway. The crystal structure fit readily into the EM map (Extended data Fig. 6e), but there were some noticeable differences between the two, especially in the CaM C-terminal domain (Extended data Fig. 6f). We refined our model against the cryo-EM map, significantly improving its fit into the density (Supplementary table 1, Extended data Fig. 8a-b). Local resolution analysis, together with visual inspection of the map, revealed that most regions of SidJ and the N-terminal domain of CaM are well resolved in our EM map with interpretable side chain density visible for the most amino acids in high resolution regions (Extended data Fig. 8b-d). Density for the C-terminal domain of CaM is less well resolved, but the secondary structure elements could still be positioned (Extended data Fig. 8c). SidJ/Human-CaM structure revealed the kinase-like catalytic domain of SidJ, an N-terminal α–helical domain (NTD) and a distinct four-helix bundle containing the IQ motif at the C-terminus of SidJ (CTD) that mediates most of the interactions with CaM (Fig. 4a). SidJ and CaM buried a surface area of ~1900 Å2, where the C-terminal domain of CaM semi-encircles the C-terminal helix of SidJ, while the N-terminal domain of CaM makes extensive contacts with the N-terminus of SidJ. Structurally, CaM binding to SidJ may stabilize the position of the N-lobe of the kinase-like domain thereby leading to a stable catalytic pocket formation. Our model agrees with the crystal structure, including the overall architecture of SidJ/CaM complex11. Interestingly, there is a noticeable movement of helices in the C-terminal domain of CaM compared to the crystal structure likely because of the inherent differences in yeast and human CaM structures12–14 (Fig. 4a). Notably, all the CaM structures in the PDB that are similar to CaM bound to SidJ are in apo conformation, strongly supporting that apo-CaM is the preferred conformation for SidJ binding. Given that the crystal structure contains SidJ in complex with yeast Ca2+-bound CaM (yeast CaM is ~60% similar to human CaM and only has three Ca2+ binding sites instead of four in human CaM)13,14 and our observation that apo-CaM is a better binder and activator of SidJ (Fig. 2d-e, Extended data Fig. 3b), we propose that the architecture of SidJ/CaM observed in our cryo-EM structure more accurately represents the active SidJ/CaM glutamylase (more info in Supplementary discussion and Extended data Fig. 9a-c).
Figure 4. Glutamylation of SidEs and host proteins during Legionella infection.
a) Comparison of the crystal structure of SidJ/Yeast CaM (PDB:6OQQ) with the Cryo-EM structure showing r.m.s.d values of various regions marked accordingly. b) A549 cells were infected with different strains of Legionella pneumophila for 3h. Cells were fixed and immunostained with antibodies against calnexin (Caln) and polyglutamylation (Glu). DAPI staining marks the nucleus and cytosolic bacteria (Leg). Number of LCVs (marked by calnexin) that are positive for poly-glutamylation are counted in FIJI, % of polyglutamylated LCVs is plotted for cells infected with different strains of Legionella. Data represents 100 LCVs taken from 30 cells over n=3 biologically independent experiments. Error bars indicate standard deviation. *** indicates p<0.001 using 2 tailed, type-3 Student's t-test. p value= 8.45x 10^-15 (WT vs ΔsidJ); p value =5.14X10^-11 (WT vs ΔsidE). c) Glutamylated proteins were isolated from WT and ΔsidJ Legionella infection experiments using GT335 antibody and quantified using mass spectrometry. Data is represented in volcano plot (inset) showing the most enriched proteins in WT. n=3 biologically independent experiments. Significant differences between samples were detected by a permutation based FDR 0.05 corrected two-sided Student's t-test. Proteins with Log2 ratio above 2 (mean) were labelled as highly enriched in WT compared to ΔsidJ infected cells. For gel source data, see Supplementary Fig. 1.
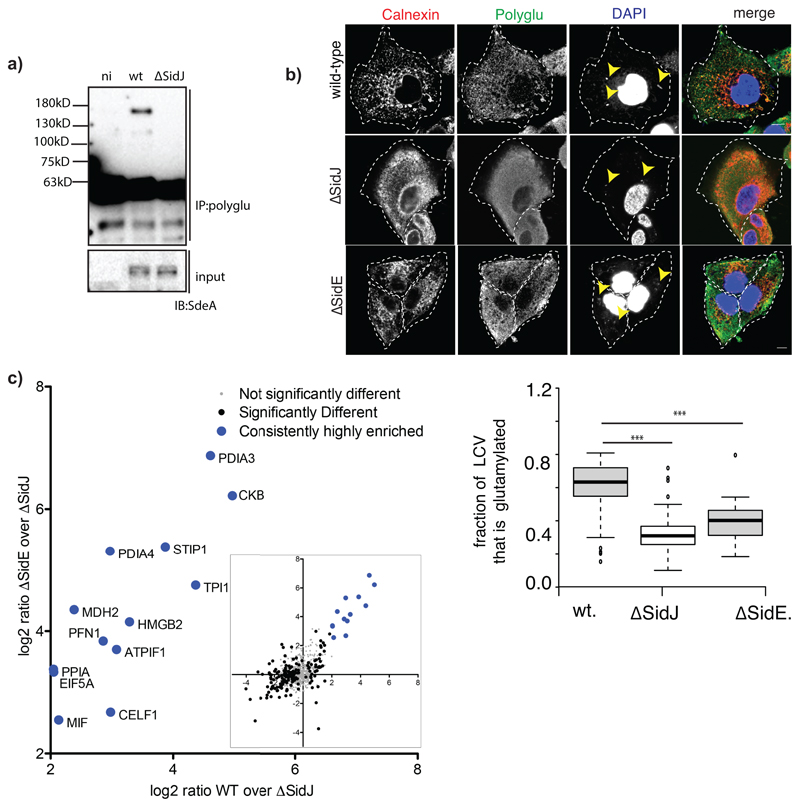
Previous studies have shown that the Ub ligase activity of the SidE family is attenuated 1 hour post WT Legionella infection, whereas the infection with the ΔsidJ strain leads to prolonged activity of these ligases on the LCV4,15. Calnexin-coated LCVs were stained positive for glutamylation in A549 cells infected with WT Legionella for 3 hours, but not in cells infected with the ΔsidJ strain (Fig. 4b). We confirmed biochemically that SdeA is modified by glutamylation during Legionella infection of murine macrophages in a SidJ-dependent manner (Extended data Fig. 10a). SidJ-dependent glutamylation seen on LCVs was significantly lower in ΔsidE strain, which lacks all four SidE ligases, when compared to WT Legionella-infected cells (Extended data Fig. 10b). Curiously, glutamylation on LCVs was not completely abolished in samples infected with ΔsidE strain indicating that SidJ may target additional proteins for glutamylation during Legionella infection. To explore this, we IPed glutamylated proteins from WT or ΔsidJ Legionella-infected cells and performed quantitative MS analysis (Fig. 4c). SdeA/SidE is the most enriched protein group demonstrating that the approach we adopted is suitable for finding bona fide substrates of SidJ glutamylation. Apart from SdeA, we observed several host proteins that are significantly enriched. To rule out the possibility that these proteins could have simply been co-IPed with glutamylated SdeA, we did a similar quantitative analysis between ΔsidE and ΔsidJ and found that, with the exception of three proteins (LAMP2, GSTP1 and LGALS1), all potential SidJ targets are also significantly enriched in ΔsidE vs ΔsidJ quantification (Extended data Fig. 10c). These data show that SidJ has additional glutamylation targets, which may explain why SidJ deletion leads to more severe intracellular growth defect than the deletion of all SidEs5,15,16.
In conclusion, SidJ is CaM-dependent glutamylase that antagonizes the Ub ligase activity of SidEs and their associated cellular toxicity during Legionella infection. Despite the co-existence of SidJ and SidEs in Legionella 4,5,15, SidJ glutamylase activity is spatially regulated and triggered only in the host cells by interacting with CaM, a eukaryote-specific protein. Similarly, the toxins Edema factor (EF) of Bacillus anthracis and CyaA of Bordetella pertussis also utilize CaM as a co-factor to exert their toxic adenylate cyclase activities in the host cells17,18. This identifies CaM as a potentially important player during bacterial infection. The observed effects of intracellular Ca2+ levels on the SidJ-CaM interaction and SidJs glutamylase activity also present an additional level of regulation that might be instrumental in the spatiotemporal modulation of the Ub ligase activity of SidEs. The finding that SidJ can also mediate the glutamylation of several host proteins, in addition to bacterial effectors, offers a molecular explanation for the observed broader role of SidJ, as compared to SidEs, in Legionella proliferation in both hosts amoeba and macrophages4,5,15. Future studies into these targets may shed lights on yet unexplored host-pathogen interactions upon Legionella infection.
Methods
Protein purification
GST tagged protein constructs of SidJ and SdeA were transformed into BL21(DE3) and grown in LB medium until the OD600 reached 0.6. Cultures were induced using 0.5mM IPTG and allowed to grow overnight at 18°C. T7 express E. coli cells were transformed with pGEX-6P-1-SidJ constructs and grown in LB medium containing Ampicillin. Cells were grown until the OD600 reached 0.6 - 0.8 at 37°C, induced with 0.2 mM IPTG (isopropyl D-thiogalactopyranoside) and further grown at 18°C. Harvested cells were resuspended in lysis buffer (50 mM Tris-HCl pH 7.5 and 150 mM NaCl), sonicated and centrifuged at 13,000 rpm. The supernatant was incubated for 2 hours at room temperature with glutathione-S-sepharose pre-equilibrated with washing buffer (50 mM Tris-HCl pH 7.5, 500 mM NaCl). Non-specific proteins were washed with washing buffer and GST-SidJ was eluted with elution buffer (50 mM Tris-HCl pH 8.0, 50 mM NaCl, 15 mM reduced glutathione). Proteins were buffer exchanged back into the lysis buffer and stored. N-terminal His-tagged Calmodulin was purified with Ni-NTA agarose and following buffers. Lysis buffer (50 mM Tris-HCl pH 7.5 and 150 mM NaCl, 10 mM Imidazole), Wash buffer (50 mM Tris-HCl pH 7.5 and 500 mM NaCl, 10 mM Imidazole), and Elution buffer (50 mM Tris-HCl pH 7.5 and 150 mM NaCl, 300 mM Imidazole). Eluted calmodulin was further purified with size exclusion chromatography (Superdex 75 10/300 GL, GE Healthcare) pre-equilibrated with Ca2+ containing storage buffer (50 mM Tris-HCl pH 7.5 and 150 mM NaCl, 2 mM CaCl2). To prepare apo-CaM, purified calmodulin was incubated with 10 mM EGTA for 2 hours and buffer exchanged with size exclusion chromatography (Superdex 75 10/300 GL, GE Healthcare) pre-equilibrated with storage buffer (50 mM Tris-HCl pH 7.5 and 150 mM NaCl). Linkage specific di-ubiquitin chains were purchased from UbiQ.
ε-NAD+ hydrolysis assays
SdeA containing samples are from HEK293T cells transiently expressing either GFP-SdeA alone or in combination with HA-SidJ or HA-SidJ (1-819). SdeA containing samples of in vitro glutamylation assays were also used for ε-NAD+ hydrolysis assays. Reaction mixture contained 1mM ε-NAD+, 50µg of Ubiquitin and SdeA containing samples were diluted to 100µL in a buffer containing 50mM Tris pH 7.5, 50mM NaCl. Reaction was initiated by adding ε-NAD+ and the hydrolysis was followed using a plate reader operating under fluorescence kinetic measurement mode with excitation wavelength: 300 nm and emission wavelength: 410 nm. Measurements were taken of each sample every 30s for the indicated time points.
GST-pulldown assays
GST or GST-SidJ were incubated with 30 µl of glutathione-S-Sepharose beads (GE HealthCare) pre-equilibrated with binding buffer (50 mM Tris-HCl pH 7.5 and 150 mM NaCl) for 30 minutes. Apo-CaM or Ca2+/CaM were added to this and further incubated. Unbound proteins were washed with washing buffer (50 mM Tris-HCl pH 7.5 and 150 mM NaCl, 0.5 % (v/v) NP-40), and samples were analyzed by SDS–PAGE followed by immunoblotting. For the Ca2+/CaM, all the buffers were supplemented with 2 mM CaCl2.
LC-MS analyses
For mass-spectrometric analysis, Legionella-purified SidJ was separated on a 1D gel, the gel was stained with Coomassie and cut into 4 fractions, which were subjected to in-gel digestion as described previously23. eGFP-tagged SdeA was immunopurified with anti-GFP beads (Chromotek), weak binding proteins were removed by four washes with 4 M urea buffer. Purified SdeA was denatured by boiling for 5 minutes in 2% sodium deoxycholate, 5 mM TCEP and 20 mM Chloroacetamide in 50 mM Tris pH 8. Afterwards, SdeA was digested on beads either overnight with 0.5 μg Trypsin after dilution of sodium deoxycholate to 1% or for 30 minutes with LysC. The digests were stopped by addition of 4 volumes 1% TFA in isopropanol and the peptides were desalted and enriched by SDB-RPS Stage-Tips. Proteins from in vitro Glutamylation reactions were digested in solution with LysC as described for the IP samples. To obtain quantitative information, peptides were either labelled with TMT 6plex reagent (ThermoFisher) and further purified with C18 stagetips24 or analyzed label-free. Proteins from glutamylation IPs were prepared in 4-2 M urea buffer as described for in vitro samples, but without boiling the samples and with C18 Stage-Tip enrichment.
Peptides were separated on an in-house made C18 column (20 cm length, 75 μm inner diameter, 1.9 μm particle size) by an easy n-LC 1200 (ThermoFisher) and directly injected in a QExactive-HF or in case of TMT samples into a Fusion Lumos mass-spectrometer (ThermoFisher) and analyzed in data-dependent.
Data-analysis was done with MaxQuant 1.6525. In brief, samples were searched against the uniprot Legionella pneumophila database (Legionella purified SidJ) or Human Swissprot database supplemented with SdeA and SidJ sequence (IP and in vitro samples) and eventually quantified by the TMT 6plex option. Glutamylated peptides were verified by manual spectra interpretation. Quantitative changes were further analyzed by unpaired T-tests in Perseus 1.6526. Global PTM discovery analysis was performed with MetaMorpheus27. For comparison of differentially modified peptide species, the precursor intensities of different charge states were summed up and normalized by the total intensity of the protein.
Deubiquitination assays
For conventional DUB assay, GST, USP2 and GST-SidJ were activated with activation buffer (50 mM Tris-HCl pH 7.5, 150 mM NaCl, 5 mM DTT), and incubated with linkage specific di-ubiquitin chains for 1 hour at 37°C and samples were analyzed by SDS–PAGE followed by immunoblotting. For PR-ubiquitin deubiquitinase assay, PR-ubiquitinated Rtn4 peptide were incubated with GST, GST-SidJ for 1 hour at 37°C.
Immunocytochemistry and confocal imaging
For immunocytochemistry, cells were fixed with 4% paraformaldehyde followed by permeabilization in 10% fetal bovine serum, PBS, and 0.1% saponin for 60 min, followed by overnight staining in primary antibody at 4°C and 60 min incubation in secondary antibody at room temperature. Confocal imaging was done using the Zeiss LSM780 microscope system. Ar-ion laser (Alexa-Fluor 488 with the 488 nm line), a He Ne laser (for Alexa-Fluor 546 with the 543 line) and violet laser (for DAPI) were used with 63× 1.4 NA oil immersion objective. Image analyses were done using FIJI. To count calnexin positive LCVs, which are also positive for glutamylation, 25μm2 ROIs at the perinuclear region of each cell were analyzed. This was done for 30 cells taken from 3 biologically independent experiments. Coloc2 plugin in FIJI was used in 50 μm2 ROIs to calculate Manders coefficient to quantify the colocalisation between calnexin marked LCVs and polyglutamylation. This was done for 80 ROIs from 20 cells. For live-cell imaging, cells were infected with Legionella pneumophilia in carbon dioxide-independent media maintaining the stage thermostat at 37°C, with 5% CO2 supply. Images were recorded for 2 min, at 1 s intervals.
Calcium measurements using Fura2-AM
Cells were loaded with 2.5 μM Fura2AM in Tyrodes buffer (25 mM Hepes (pH 7.4), 5 mM potassium chloride, 140 mM sodium chloride, 2 mM magnesium chloride, 6 g/l glucose) for 30 min at 37°C. The cells were washed and harvested in PBS, followed by the measurement of fluorescence at 510 nm with the Tecan Infinite M200 Pro plate reader after alternate excitation at 340 nm and 380 nm. Calcium levels were calculated using the formula [Ca2+]=Kd[(R-Rmin)/(Rmax-R)]*Sf. R represents the ratio of fluorescence intensity at 340 nm and 380 nm (Grynkiewicz et al., 1985). Rmax and Rmin were calculated from cells treated with 1% digitonin (Ca2+ saturation) and 1% digitonin + 2mM EGTA (absence of Ca2+) respectively. Sf is the scaling factor (fluorescence intensity at 380 nm excitation in the absence of Ca2+ and at Ca2+ saturation).
Legionella pneumophila infection and preparation of lysates from infected cells
L. pneumophila strains (Legionella pneumophila lp02) were grown for 3 days on N-(2-acetamido)-2-amino-ethanesulfonic acid (ACES)-buffered charcoal-yeast (BCYE) extract agar, at 37°C. Bacteria were grown for 20 h in ACES media prior to infection. Bacterial cultures of optical density 3.2 - 3.6 were used to infect RAW 264.7 cells (MOI of 1:10) and A549 cells (MOI of 1:20).
After the infection, the cells were pelleted at 800 g followed by treatment with 0.05% digitonin in KHEM buffer (10 mM Hepes (pH 7.2), 140 mM potassium chloride, protease inhibitor cocktail) for 10 min at room temperature, followed by centrifugation at 13000 g for 10 min. The supernatant contains purely cytosolic proteins (such as tubulin), while the pellet contains all cellular membranes, including LCVs. The pellet was then lysed in buffer containing 1% Triton X-100 and used as an input for immunoprecipitation with GT335 antibody.
Cell lines
HEK293T and A549 cells were cultured in DMEM supplemented with 10% FBS, 100 I.U./mL penicillin and 100 mg/ml streptomycin (Pen/Strep) at 37°C, 5% CO2. Raw264.7 macrophages were cultured in RPMI supplemented with 10% FBS.
Western Blotting and Immunoprecipitation
4-20% Tris glycine gradient gels (Biorad) were used for SDS-PAGE followed by Western blot. For immunoprecipitation, cells were lysed in immunoprecipitation buffer (50 mM Tris-HCl, pH 7.5, 150 mM NaCl, 1% Triton X-100, 1 mM PMSF, protease inhibitor cocktail (Sigma Aldrich)), mixed with 15 μl protein A/G agarose beads (SantaCruz Biotechnology) and 3 µg anti-polyglutamylation (GT335) antibody, and incubated for 4 h at 4°C subjected to end to end rotation. The beads were washed twice in IP buffer containing 400 mM NaCl. Proteins were eluted by boiling with 2X gel loading dye followed by western blot.
In vitro glutamylation assays
1 µg of SdeA, 2 µg of GST-SidJ were included in the reaction mixtures. Where mentioned, 2 µg of apo or calcium bound Calmodulin, as well as 0.5 mM ATP and 0.5 mM Glutamic acid was added to the reactions. All reactions were performed in 50 mM Tris pH 9, 2.5 mM MgCl2, 0.5 mM TCEP in a final volume of 20 µL. The reaction was initiated by the addition of ATP and incubated at 30°C for 1 h. For time-course mass spectrometry experiments checking the specificity of the reaction, the amount of Glutamic acid and ATP was reduced to 0.05 mM and the reaction was carried out for indicated time points.
Expression and purification of SidJ/CaM complex for Cryo EM
Recombinant overexpression of full-length SidJ and Calmodulin were achieved through co-expression using E. coli OneShot BL21 Star (DE3) cells (Invitrogen). The cells were cultivated at 37°C in lysogeny broth supplemented with 100 µg/mL Ampicillin, 25 µg/mL Kanamycin, and 34 µg/mL Chloramphenicol. Expression was induced at OD600=0.6 using a final concentration of 0.5 mM isopropyl-β-D-1-thiogalactopyranoside (IPTG), and the cultures were further left to grow at 18°C. Cells were harvested the next day by centrifugation and lysed by sonication in lysis buffer (50 mM Tris pH 7.5, 300 mM NaCl, 5% (v/v) Glycerol), supplied with an EDTA-free protease inhibitor cocktail tablet (Roche Applied Science) and 20 µg/mL DNAse 1. The lysate was clarified using centrifugation and filtered using a 5 µM filter membrane, before applying the lysate to TALON metal affinity resin beads (ClonTech Laboratories) pre-equilibrated in lysis buffer. The lysate was left to incubate on the beads at 4°C for 1 hour, and the flow-through was removed after gentle centrifugation at 300g for 2 minutes. The beads were washed 3 times with lysis buffer and an incubation time of 10 minutes at 4°C and subsequent gentle centrifugation during each step. The elutions were performed using lysis buffer that were supplied with increasing imidazole concentrations of 10 mM, 50 mM, 100 mM, and 200 mM and an incubation time of 10 minutes and subsequent gentle centrifugation. The purest fraction as determined by SDS-PAGE was placed in Spectra/Por 1 RC Dialysis Membrane Tubing (Spectrum), and His-3C protease in a 1:50 molar ratio was added for tag cleavage. The sample was then dialyzed in Dialysis buffer (50 mM Tris pH 7.5, 150 mM NaCl, 5% Glycerol, 5 mM EDTA) overnight and loaded onto a HiLoad Superdex S200 10/300 GL (GE Healthcare) column equilibrated in gel filtration buffer (10 mM HEPES pH 7.5, 50 mM NaCl, 0.5 mM TCEP) for size exclusion chromatography, and the purest fractions as determined by SDS-PAGE were used for grid preparation.
Expression and purification of SidJ99-C and FL-CaM for ITC
Recombinant overexpression of SidJ99-C and full-length Calmodulin were achieved through expression using E. coli OneShot BL21 Star (DE3) cells (Invitrogen). The cells were cultivated at 37°C in lysogeny broth supplemented with 25 µg/mL Kanamycin and 34 µg/mL Chloramphenicol for SidJ99-C and 100 µg/mL Ampicillin and 34 µg/mL Chloramphenicol for Calmodulin. Both SidJ99-C and Calmodulin were expressed, lysed, and purified using the same protocol as the SidJ/CaM complex described in the previous section, but Calmodulin was incubated in lysis buffer with 4mM EDTA added at 4°C for 2 hours before size exclusion chromatography, and neither protein were cleaved or dialyzed.
ITC Experiments
The SidJ99-C and full-length Calmodulin purified as described in the previous sections were concentrated to 20 µM and 200 µM respectively using Amicon Ultra centrifugal filters (Merck Millipore). The ITC experiments were performed using a MicroCal ITC200 (Malvern), with a sample volume of 350 µL and a ligand volume of 75 µL. All experiments were performed at 20°C using an initial injection volume 1 µL and all subsequent injections with a volume of 2.5 µL, and 5-minute injection intervals. For baseline measurements, the 200 µM Calmodulin was titrated into the gel filtration buffer (10 mM HEPES pH 7.5, 50 mM NaCl, 0.5 mM TCEP). For the ApoCaM measurement, the 200 µM Calmodulin was titrated into the sample chamber containing 20 µM SidJ99-C. For the CaCl2-enriched Calmodulin measurement, 50 mM CaCl2 was added to both Calmodulin and SidJ99-C to reach a final concentration of 3 mM CaCl2 and left to incubate on ice for 2 hours prior to the experiment.
Data baseline subtraction, analysis, and dissociation constant determination were performed using Origin 7.0. The first injection was excluded from analysis in each experiment.
Electron microscopy
Cryo-EM grids were prepared using Vitrobot MK IV (Thermo Fisher) operated at 100% humidity at 4°C. 2 μl of sample was applied to each side of an UltrAufoil 300 mesh, 1.2/1.3 grid, glow discharged using Pelco EasyGlow at 25 mA for 30 s, and blotted for 2 s before immediate plunge freezing into liquid ethane. Samples were imaged using Glacios microscope (Thermo Fisher) operated at 200 kV with Falcon III direct electron detector. 2441 movies were acquired in counting mode (defocus range -0.5 μm to -2.5 μm) with magnified pixel size of 0.96 Å at a dose rate 0.9 e Å-2s-1 and the total dose of 40 e Å-2 fractionated into 60 movie frames.
EM Data processing
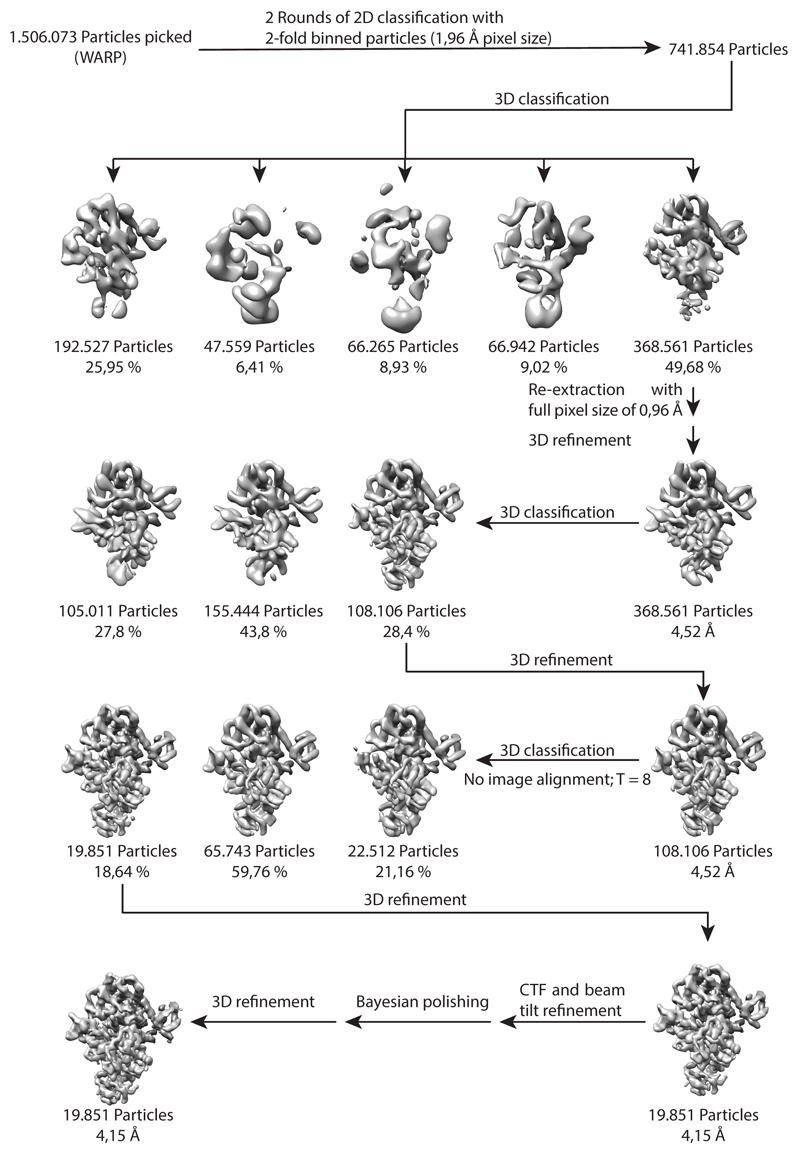
Motion correction and CTF parameters estimation was performed in WARP28 using 5x5 patches followed by particle picking with the BoxNet2Mask_21080918 model. A total of 1.5 million particles' coordinates were imported into Relion329 and extracted with the binning factor 2. After two rounds of reference-free 2D classification, 742K particles were subjected to 3D classification with an initial model generated ab initio within Relion3. A subset of 369K particles from the best 3D class was re-extracted without binning, classified again and a 108K subset was refined to 4.5Å resolution. Further 3D classification without image alignment (with T=8) allowed isolation of a 20K-particle subset, which was refined to 4.1 Å resolution. Finally, the Ctf refinement and beam tilt correction was performed followed by Bayesian particle polishing30, but the quality of the reconstruction did not benefit significantly from these procedures (Extended data Fig. 7).
Model building and refinement
The average resolution of the reconstruction based on gold standard FSC is 4.1 Å, however many areas of the map show clear density for amino acid side chains (Extended data Fig. 7d) indicating that these parts of the map might be suitable for de novo model building. While we were attempting model building, a crystal structure of SidJ bound to yeast Calmodulin was reported at 2.1 Å resolution (PDB 6oqq). This structure was rigid-body fitted into the cryo-EM density in Chimera and the yeast calmodulin was replaced with an apo form of human Calmodulin (PDB 2ix7). The structure was subsequently refined against cryo-EM map with Refmac531 implemented in CCP-EM32 using secondary structure restraints from Prosmart33. Refinement and validation statistics are summarized in Supplementary Table 1.
Extended Data
Extended data Fig. 1. SidJ does not possess intrinsic deubiquitinase activity.
a) sdeC-sdeA genetic locus in Legionella genome. b) left, GFP-SidJ ectopically expressed and purified from HEK293T cells was incubated with canonical HA-ubiquitin chains purified from mammalian cells, canonical DUB USP2 was used as a postive control. right, GFP or GFP-SidJ was incubated with purified SdeA-ubiquitinated Rab33b. Experiment was repeated twice independently with similar results. c) Full length SidJ was incubated with various substrates modified with canonical ubiquitination or PR ubiquitination to probe the cleavage activity. USP2 was used as positive controls for cleaving canonical Ub chains and PR-Ub substrates respectively. Experiment was repeated twice independently with similar results. d) Legionella purified SidJ was analyzed by mass spectrometry and protein quantification was performed using the MaxQuant iBAQ algorithm. Experiment was repeated twice independently with similar results.
Extended data Fig. 2. SidJ binds to Calmodulin.
a) GFP and GFP-SidJ were ectopically expressed in HEK293T cells and immunoprecipitated. The samples were analyzed by SDS-PAGE followed by coomassie staining. Experiment was repeated twice independently with similar results. b) Purified SdeA from HEK293T cells expressing SdeA alone or in combination with SidJ or SidJ (1-819) were used in ε-NAD+ hydrolysis assays. Experiment was repeated twice independently with similar results. c) A549 cells infected with WT Legionella pneumophilia for different time periods was loaded with Fura2AM for 30 min at 37°C followed by ratiometric measurement of intracellular Ca2+ using a plate reader. Infection with bacteria did not change total Ca2+ levels in the cell. n=3 biologically independent experiments, Data points indicate mean and error bars represent standard deviation d) A549 cells expressing ER-GFP and ER-cepia were infected with Legionella pneumophilia (Ds-Red lp02) followed by time-lapse imaging. Fluorescence intensity of ER-cepia at each region is proportional to local Ca2+ levels. ER-GFP fluorescence is independent of Ca2+ concentration. The ER has a heterogenous and dynamic distribution of Ca2+. The bacteria make transient contacts with the ER and may be influenced by local Ca2+ fluxes in the cell. ER-cepia is marked in red, ER-GFP in green and bacteria are marked by white dotted lines. Time-lapse images were taken at 1s intervals for 2min. Images shown in the montage are at 10s intervals. Experiment was repeated thrice independently with similar results. e) Crystal structure of SdeA (PDB: 5YIM) is shown in cartoon representation highlighting the missing peptide of SdeA in SidJ-treated samples (shown in colors red and blue), solvent exposed part of this peptide containing the catalytic glutamate (E860, shown in green) is marked.
Extended data Fig. 3. SdeA E860 glutamylation mass spectra.
a) Annotated mass spectra for di-glutamylation of SdeA E860 from immunoprecipitated GFP-SdeA co-expressed with SidJ samples b) In vitro glutamylation of SdeA was carried in various conditions as indicated followed by ε-NAD+ hydrolysis assays to measure the Ub ADP-ribosylation activity of SdeA. Experiment was repeated thrice independently with similar results.
Extended data Fig. 4. In vitro glutamylation of SdeA.
a) Samples of in vitro glutamylation reactions containing SdeA and SidJ with or without ATP were TMT-labeled and analyzed by quantitative mass spectrometry. Mono- and di-glutamylation of the catalytic E860 of SdeA was enriched in samples containing ATP. In-vitro glutamylation was performed in n=3 biologically independent experiments. Samples were labeled with TMT 6 plex reagent and analyzed in one LC-MS run. Significant differences between samples were detected by a two-sided Student's t-test. b) Annotated mass spectra for mono-glutamylation of SdeA E860 from SidJ glutamylase in vitro reactions. c) Annotated mass spectra for di-glutamylation of SdeA E860 from SidJ glutamylase in vitro reactions.
Extended data Fig. 5. Analysis of isobaric glutamylated peptide species.
a) Extracted Ion Chromatogram (XIC) of +4 charged -QVGRHGEGTESEFSVYLPEDVALVPVK- + 1 Glutamate, showing no other co-existing mono-glutamylated versions of the catalytic peptide besides E860 glutamylation b) XIC of the catalytic peptide plus two glutamates (charge +4) is separated into three different peaks that could be assigned to Di-Glutamylation of E860, as well as two mono-glutamylations on the peptide on E860 plus E857 as well as E862. Annotated spectra are shown below. c) XIC of the catalytic peptide plus three glutamates (charge +4) is separated into three different peaks that could be assigned to di-glutamylation of E860 plus mono-glutamylation of E857 and parallel mono-glutamylation of E857, E860 and E862, a third peak could not be clearly assigned. Annotated spectra of the annotated species are shown below. For panels a-c, In-vitro glutamylation and label-free LC-MS analysis were performed in 3 biologically independent experiments with similar results. Corresponding quantitative information is shown in Figure 3d.
Extended data Fig. 6. Cryo-EM data processing and 3D reconstruction.
a) Size-exclusion profile of SidJ/CaM complex, elution fractions were analysed by SDS PAGE. Marked fractions were used for cryo-EM sample preparation. This experiment was repeated thrice independently with similar results. b) A representative electron micrograph for the cryo-EM dataset collected. c) Reference-free representative 2D class averages of the SidJ/CaM complex. Secondary structure features are already visible in projection images. Used number of particles to obtain a 2D class average is mentioned accordingly in each subpanel.
d) Gold-standard Fourier Shell Correlation21 plot between two independently refined half-maps, FSC0.143=4.15 Å resolution. FSC between phase-randomized half-maps show, as expected, a rapid drop of correlation beyond randomization point. e) Crystal structure of SidJ/CaM (PDB:6OQQ) is fitted into the cryo-EM 3D reconstruction f) A part of panel d is magnified to highlight the difference between the crystal structure and the cryo-EM map.
Extended data Fig. 7. Cryo-EM single particle analysis pipeline.
Data processing strategy for cryo-EM on the SidJ-CaM complex. Particle picking on 2423 micrographs using WARP resulted in the identification of 1.5 million particles. The particle coordinates were imported into Relion and particles were extracted with a 2-fold binning factor. After 2D classification and an initial 3D classification a 3D class with clear secondary structure features and 370 k particles was identified. The particles of this class were re-extracted with full pixel size and 3D refined resulting in a 4.52 Å model. Two additional rounds of 3D classification and 3D refinement improved the resolution of the model to 4.15 Å. Final particle polishing and CTF refinement of the remaining particles did not result in a nominal improvement of the resolution.
Extended data Fig. 8. Cryo-EM model refinement.
a) FSC between model and the map and cross-validation of the model fitting. FSC0.5 = 4.3 Å for the model vs map (sum). Half-map cross validation procedure22 does not show significant overfitting in the refined model. b) Local resolution analysis (Relion) shows variation in the map resolution ranging from 3.9 to 5.1 Å. c) Overview of the model fitting into the map in the same orientation as in b. d) An example of the cryo-EM map quality with the atomic model fitted in, showing clear density for side chains.
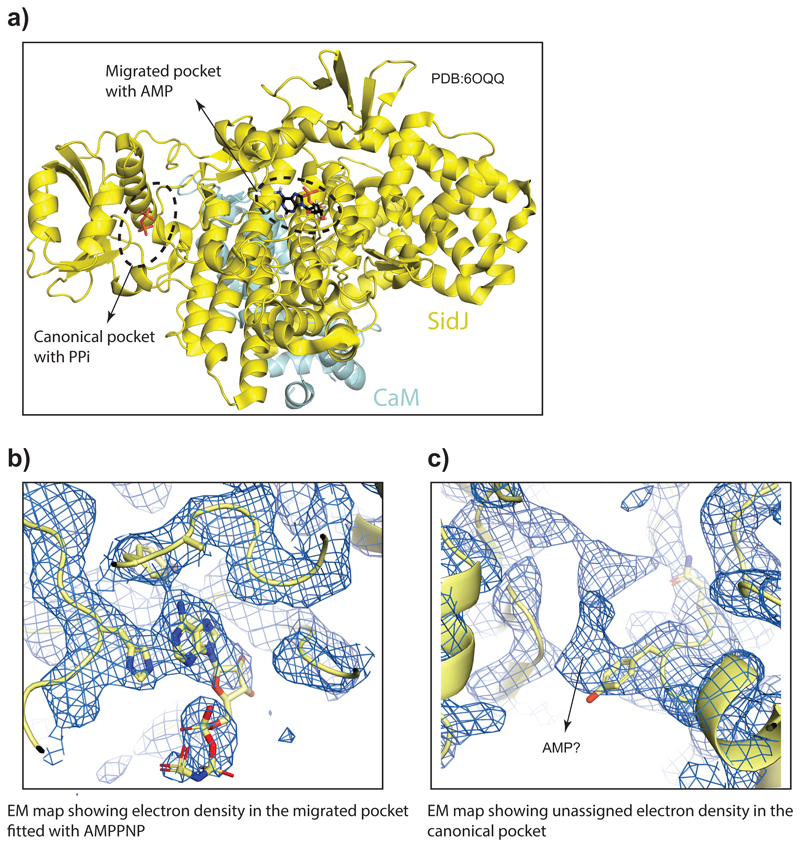
Extended data Fig. 9. Ligand binding sites of SidJ/CaM complex.
a) Crystal structure of SidJ/Yeast CaM (PDB:6OQQ) is shown marking the two proposed catalytic sites and the bound ligands. b) EM map showing cryo-EM density in the migrated pocket fitted with AMPPNP. c) EM map showing unassigned cryo-EM density in the canonical pocket.
Extended data Fig. 10. SidJ-dependent glutamylation during Legionella infection.
a) Raw264.7 macrophages were infected with WT, ΔSidJ or ΔSidE Legionella for 3h. Lysates were used for immunoprecipitation with polyglutamylation antibody followed by immunoblotting with SdeA. n.i indicates samples that were not infected with bacteria. This experiment was repeated twice independently with similar results. b) A549 cells were infected with different strains of Legionella pneumophila for 3h. Cells were fixed and immunostained with antibodies against calnexin and poly-glutamylation (GT335). DAPI staining marks the nucleus and cytosolic bacteria. Yellow arrows indicate bacteria in infected cells. Region of interest (ROI) is defined as Calnexin stained LCV. 80x100 um2 ROIs were chosen in the perinuclear region of cells followed by quantification of Mander’s coefficient (m) using Coloc2 plugin in FIJI. m represents the fraction of calnexin-positive LCVs that are also positive for poly-glutamylation. Center lines show the medians; box limits indicate the 25th and 75th percentiles as determined by R software; whiskers extend 1.5 times the interquartile range from the 25th and 75th percentiles, outliers are represented by dots. Number of ROIs (n) = 80 from 30 cells was used for quantification. *** indicates p<0.001 by 2-tailed type 3, Students t-test. p-value (WT vs ΔsidJ) =6.18x 10⁻²⁹, p value (WT vs ΔsidE) = 1.09x 10⁻⁵. This experiment was repeated twice independently with similar results. c) Glutamylated proteins were isolated from WT, ΔsidE and ΔsidJ Legionella infection experiments using GT335 antibody and quantified using mass spectrometry. Correlation between WT vs ΔsidJ and ΔsidE vs. ΔsidJ quantifications are plotted (inset) showing the most correlated proteins in the abovementioned two quantifications. Legionella infection and label-free LC-MS analysis was performed with n=3 biologically independent experiments. Significant differences between samples were detected by a permutation based FDR 0.05 corrected two-sided Student's t-test. Proteins were labelled as significant, if they were above the FDR 0.05 threshold in at least one comparison (ΔsidE and WT Legionella compared to ΔsidJ infected cells). Proteins with a Log2 ratio above 2 (mean) in WT samples were labelled as highly enriched compared to ΔsidJ infected cells in samples from WT and well as ΔsidE infected cells.
Supplementary Material
Acknowledgements
We thank Joseph Vogel for ΔsidJ Legionella strain and Zhao-Qing Luo for SidJ proteins purified from legionella and for providing ΔsidE and WT Legionella strains. We thank Sofia Rodriguez and Sarah Gharbi for technical assistance, Yaobin Liu for help with deubiquitination assays and Daniela Höller, Hadir Marei and Kerstin Koch for critical comments on the manuscript. This work was supported by the DFG-funded Collaborative Research Centre on Selective Autophagy (SFB 1177), by the European Research Council (ERC) under the European Union’s Horizon 2020 research and innovation programme (grant agreement No 742720), by the DFG-funded Cluster of Excellence “Macromolecular Complexes” (EXC115), by the DFG-funded SPP 1580 program “Intracellular Compartments as Places of Pathogen-Host-Interactions” (I.D.).
Footnotes
Author information statement
Reprints and permissions information is available at www.nature.com/reprints.
The authors declare no competing financial interests.
Authors contribution
SB and ID conceived and supervised the project. SB performed mammalian SidJ/SdeA co-expression and ε-NAD+ hydrolysis assays. FB performed all the mass spectrometry experiments with the help of VM and SB in sample preparation. RM performed Legionella infection experiments and prepared sample for mass spectrometry. MA performed in vitro ε-NAD+ hydrolysis assays, ITC and protein purifications for biochemistry and cryo-EM. MP and WG prepared cryo-EM grids, collected and processed data and performed the model refinement. JLM performed yeast experiments. SK performed protein purifications. DS performed protein purifications and in vitro SidJ/CaM pulldown experiments. SB and ID analyzed the data and wrote the manuscript with input from all the co-authors.
Data availability statement
Mass spectrometry data are available from the Proteomics Identification (PRIDE) database with the dataset identifier PXD01436219. Cryo-EM structure coordinates are available from the Protein Data Bank (PDB) and the Electron Microscopy Data Bank (EMDB) under accession codes 6S5T and EMD-10100. Full gel source data can be found in Supplementary Fig. 1. The data that support the findings of this study are available from the corresponding authors upon request.
References
- 1.Hubber A, Roy CR. Modulation of host cell function by Legionella pneumophila type IV effectors. Annu Rev Cell Dev Biol. 2010;26:261–283. doi: 10.1146/annurev-cellbio-100109-104034. [DOI] [PubMed] [Google Scholar]
- 2.Qiu J et al. Ubiquitination independent of E1 and E2 enzymes by bacterial effectors. Nature. 2016;533:120–124. doi: 10.1038/nature17657. [DOI] [PMC free article] [PubMed] [Google Scholar]
- 3.Bhogaraju S, et al. Phosphoribosylation of Ubiquitin Promotes Serine Ubiquitination and Impairs Conventional Ubiquitination. Cell. 2016;167:1636–1649.e13. doi: 10.1016/j.cell.2016.11.019. [DOI] [PubMed] [Google Scholar]
- 4.Jeong KC, Sexton JA, Vogel JP. Spatiotemporal regulation of a Legionella pneumophila T4SS substrate by the metaeffector SidJ. PLoS Pathog. 2015;11:e1004695. doi: 10.1371/journal.ppat.1004695. [DOI] [PMC free article] [PubMed] [Google Scholar]
- 5.Liu Y, Luo Z-Q. The Legionella pneumophila effector SidJ is required for efficient recruitment of endoplasmic reticulum proteins to the bacterial phagosome. Infect Immun. 2007;75:592–603. doi: 10.1128/IAI.01278-06. [DOI] [PMC free article] [PubMed] [Google Scholar]
- 6.Havey JC, Roy CR. Toxicity and SidJ-Mediated Suppression of Toxicity Require Distinct Regions in the SidE Family of Legionella pneumophila Effectors. Infect Immun. 2015;83:3506–3514. doi: 10.1128/IAI.00497-15. [DOI] [PMC free article] [PubMed] [Google Scholar]
- 7.Urbanus ML, et al. Diverse mechanisms of metaeffector activity in an intracellular bacterial pathogen, Legionella pneumophila. Mol Syst Biol. 2016;12:893. doi: 10.15252/msb.20167381. [DOI] [PMC free article] [PubMed] [Google Scholar]
- 8.Qiu J, et al. A unique deubiquitinase that deconjugates phosphoribosyl-linked protein ubiquitination. Cell Res. 2017;27:865–881. doi: 10.1038/cr.2017.66. [DOI] [PMC free article] [PubMed] [Google Scholar]
- 9.Bähler M, Rhoads A. Calmodulin signaling via the IQ motif. FEBS Lett. 2002;513:107–113. doi: 10.1016/s0014-5793(01)03239-2. [DOI] [PubMed] [Google Scholar]
- 10.Solntsev SK, Shortreed MR, Frey BL, Smith LM. Enhanced Global Post-translational Modification Discovery with MetaMorpheus. J Proteome Res. 2018;17:1844–1851. doi: 10.1021/acs.jproteome.7b00873. [DOI] [PubMed] [Google Scholar]
- 11.Black MH. Bacterial pseudokinase catalyzes protein polyglutamylation to inhibit the SidE-family ubiquitin ligases. Science. 2019;364:787–792. doi: 10.1126/science.aaw7446. [DOI] [PMC free article] [PubMed] [Google Scholar]
- 12.Starovasnik MA, Davis TN, Klevit RE. Similarities and differences between yeast and vertebrate calmodulin: an examination of the calcium-binding and structural properties of calmodulin from the yeast Saccharomyces cerevisiae. Biochemistry. 1993;32(13):3261–3270. doi: 10.1021/bi00064a008. [DOI] [PubMed] [Google Scholar]
- 13.Ishida Hiroaki . Biochemistry. Vol. 41. American Chemical Society; 2002. The Solution Structure of Apocalmodulin from Saccharomyces cerevisiae Implies a Mechanism for Its Unique Ca2+ Binding Property‡; pp. 15536–15542. [DOI] [PubMed] [Google Scholar]
- 14.Starovasnik MA, Davis TN, Klevit RE. Similarities and differences between yeast and vertebrate calmodulin: an examination of the calcium-binding and structural properties of calmodulin from the yeast Saccharomyces cerevisiae. Biochemistry. 1993;32:3261–3270. doi: 10.1021/bi00064a008. [DOI] [PubMed] [Google Scholar]
- 15.Bardill JP, Miller JL, Vogel JP. IcmS-dependent translocation of SdeA into macrophages by the Legionella pneumophila type IV secretion system. Mol Microbiol. 2005;56:90–103. doi: 10.1111/j.1365-2958.2005.04539.x. [DOI] [PubMed] [Google Scholar]
- 16.Jeong KC, Sutherland MC, Vogel JP. Novel export control of a Legionella Dot/Icm substrate is mediated by dual, independent signal sequences. Mol Microbiol. 2015;96:175–188. doi: 10.1111/mmi.12928. [DOI] [PubMed] [Google Scholar]
- 17.Drum CL. Structural basis for the activation of anthrax adenylyl cyclase exotoxin by calmodulin. Nature. 2002;415:396–402. doi: 10.1038/415396a. [DOI] [PubMed] [Google Scholar]
- 18.Wolff J, Cook GH, Goldhammer AR, Berkowitz SA. Calmodulin activates prokaryotic adenylate cyclase. Proc Natl Acad Sci USA. 1980;77:3841–3844. doi: 10.1073/pnas.77.7.3841. [DOI] [PMC free article] [PubMed] [Google Scholar]
- 19.Perez-Riverol Y. The PRIDE database and related tools and resources in 2019: improving support for quantification data. Nucleic Acids Res. 2019;47:D442–D450. doi: 10.1093/nar/gky1106. [DOI] [PMC free article] [PubMed] [Google Scholar]
- 20.Kalayil S. Insights into catalysis and function of phosphoribosyl-linked serine ubiquitination. Nature. 2018;557:734–738. doi: 10.1038/s41586-018-0145-8. [DOI] [PMC free article] [PubMed] [Google Scholar]
- 21.Scheres SHW, Chen S. Prevention of overfitting in cryo-EM structure determination. Nat Methods. 2012;9:853–854. doi: 10.1038/nmeth.2115. [DOI] [PMC free article] [PubMed] [Google Scholar]
- 22.Brown A. Tools for macromolecular model building and refinement into electron cryo-microscopy reconstructions. Acta Crystallogr D Biol Crystallogr. 2015;71:136–153. doi: 10.1107/S1399004714021683. [DOI] [PMC free article] [PubMed] [Google Scholar]
- 23.Grumati P. Full length RTN3 regulates turnover of tubular endoplasmic reticulum via selective autophagy. Elife. 2017;6:911. doi: 10.7554/eLife.25555. [DOI] [PMC free article] [PubMed] [Google Scholar]
- 24.Rappsilber J, Ishihama Y, Mann M. Stop and go extraction tips for matrix-assisted laser desorption/ionization, nanoelectrospray, and LC/MS sample pretreatment in proteomics. Anal Chem. 2003;75:663–670. doi: 10.1021/ac026117i. [DOI] [PubMed] [Google Scholar]
- 25.Cox J, Mann M. MaxQuant enables high peptide identification rates, individualized p.p.b.-range mass accuracies and proteome-wide protein quantification. Nat Biotechnol. 2008;26:1367–1372. doi: 10.1038/nbt.1511. [DOI] [PubMed] [Google Scholar]
- 26.Tyanova S. The Perseus computational platform for comprehensive analysis of (prote)omics data. Nat Methods. 2016;13:731–740. doi: 10.1038/nmeth.3901. [DOI] [PubMed] [Google Scholar]
- 27.Solntsev SK, Shortreed MR, Frey BL, Smith LM. Enhanced Global Post-translational Modification Discovery with MetaMorpheus. J Proteome Res. 2018;17:1844–1851. doi: 10.1021/acs.jproteome.7b00873. [DOI] [PubMed] [Google Scholar]
- 28.Tegunov D, Cramer P. Real-time cryo-EM data pre-processing with Warp. bioRxiv. 2018:338558. doi: 10.1101/338558. [DOI] [Google Scholar]
- 29.Zivanov J. New tools for automated high-resolution cryo-EM structure determination in RELION-3. Elife. 2018;7:163. doi: 10.7554/eLife.42166. [DOI] [PMC free article] [PubMed] [Google Scholar]
- 30.Zivanov J, Nakane T, Scheres SHW. A Bayesian approach to beam-induced motion correction in cryo-EM single-particle analysis. IUCrJ. 2019;6:5–17. doi: 10.1107/S205225251801463X. [DOI] [PMC free article] [PubMed] [Google Scholar]
- 31.Murshudov GN. REFMAC5 for the refinement of macromolecular crystal structures. Acta Crystallogr D Biol Crystallogr. 2011;67:355–367. doi: 10.1107/S0907444911001314. [DOI] [PMC free article] [PubMed] [Google Scholar]
- 32.Burnley T, Palmer CM, Winn M. Recent developments in the CCP-EM software suite. Acta Crystallogr D Struct Biol. 2017;73:469–477. doi: 10.1107/S2059798317007859. [DOI] [PMC free article] [PubMed] [Google Scholar]
- 33.Nicholls RA, Fischer M, McNicholas S, Murshudov GN. Conformation-independent structural comparison of macromolecules with ProSMART. Acta Crystallogr D Biol Crystallogr. 2014;70:2487–2499. doi: 10.1107/S1399004714016241. [DOI] [PMC free article] [PubMed] [Google Scholar]
Associated Data
This section collects any data citations, data availability statements, or supplementary materials included in this article.
Supplementary Materials
Data Availability Statement
Mass spectrometry data are available from the Proteomics Identification (PRIDE) database with the dataset identifier PXD01436219. Cryo-EM structure coordinates are available from the Protein Data Bank (PDB) and the Electron Microscopy Data Bank (EMDB) under accession codes 6S5T and EMD-10100. Full gel source data can be found in Supplementary Fig. 1. The data that support the findings of this study are available from the corresponding authors upon request.


