Abstract
Objective
To evaluate neurofilament light chain (NfL) levels in serum and CSF of patients with aggressive MS pre- and post-treatment with immunoablation followed by autologous hematopoietic stem cell transplantation (IAHSCT) and examine associations with clinical and MRI outcomes.
Methods
Paired serum and CSF in addition to MRI and clinical measures were collected on 23 patients with MS at baseline and 1 and 3 years post-IAHSCT. An additional 33 sera and CSF pairs were taken from noninflammatory neurologic controls. NfL levels were quantitated using the Simoa platform (Quanterix).
Results
Baseline MS NfL levels were significantly elevated relative to controls in serum (p = 0.001) and CSF (p = 0.001). Following IAHSCT, high pretreatment NfL levels significantly reduced in serum (p = 0.0023) and CSF (p = 0.0068) and were not significantly different from controls. Serum and CSF NfL levels highly correlated (r = 0.81, p < 0.0001). Baseline NfL levels were associated with worse pretreatment disease measures (Expanded Disability Status Scale [EDSS], relapses, MRI lesions, and MR spectroscopy (MRS) N-acetylaspartate/creatine). Elevated baseline NfL levels were associated with persistently worse indices of disease burden post-IAHSCT (sustained EDSS progression, cognition, quality of life, T1 and T2 lesion volumes, MRS, and brain atrophy).
Conclusion
These data substantiate that serum and CSF NfL levels reflect disease severity and treatment response in patients with MS and may therefore be a useful biomarker. Baseline serum levels associated with markers of pretreatment disease severity and post-treatment outcomes.
Classification of evidence
This study provides Class II evidence that for patients with aggressive MS, serum NfL levels are associated with disease severity.

MS is known for its diverse clinical presentation, with some patients presenting early with minimal disease and others presenting late with considerable damage from silent disease.1 There are now many therapeutic options with differing mechanisms of action, efficacy, and safety profiles. An annual MRI scan is recommended as a “standard of care” in the assessment of ongoing disease activity,2 but this is a costly, time-consuming test and is impractical in areas where access to MRI is limited. MRI is also semiquantitative, with significant interscan variability on routine scanning. It has limited sensitivity for predicting disease progression3,4 and is not recommended for monitoring treatment response.2 Routine MRI scanning also ignores most of the spinal cord (in many cases, the cervical cord is examined); spinal cord disease more closely correlates with Expanded Disability Status Scale (EDSS) progression, especially as the disease advances.5 As such, there is an unmet need for alternative biomarkers to help clinicians prognosticate, monitor for disease activity, and assess treatment response. Serum neurofilament light chain (NfL), a neuroaxonal intermediate protein, is a promising biomarker candidate. Advances in highly sensitive detection methodologies using single-molecule counting to measure biomarker concentrations down to the femtomolar levels have enabled NfL quantification in plasma or serum.6,7 Serum NfL has been closely correlated with CSF levels. Elevated serum levels in patients with MS drop when MS activity seems controlled by a variety of MS treatments8 and may even be of prognostic value.9–11 Many hope that the precise quantification of this abundant CSF biomarker in the serum could become a convenient, objective mainstay of MS monitoring and prognostication.
Immunoablation followed by autologous hematopoietic stem cell transplantation or IAHSCT (previously referred to as autologous bone marrow transplantation) is an intensive yet efficacious therapy reserved for particularly aggressive cases of MS. The rigorous regimen adopted in Canada involves myeloablative doses of chemotherapy and antithymocyte globulin followed by autologous hematopoietic stem cell transplants. Using this approach, we have reported that patients with MS experience a robust treatment response (stabilization or improvement in most) in the absence of ongoing disease-modifying treatments (DMTs) following IAHSCT.12 These patients had aggressive disease, as defined by frequent disabling relapses and early rapid progression despite reasonable trials of DMT. Following IAHSCT, they had complete suppression of focal white matter inflammatory disease activity, as measured by MRI, and no clinical relapses after more than a decade of follow-up. Despite the lack of ongoing inflammatory disease, some patients continued to show disability progression and MRI atrophy. We considered, therefore, that this unique cohort of patients might be of interest to study the prognostic and therapeutic utility of measuring NfL levels, as a baseline marker of disease severity, as a marker of treatment response, and possibly a predictor of post-treatment outcomes.
Methods
Patients with aggressive MS undergoing IAHSCT
The study has been previously described in detail,12 but briefly was a phase II, nonrandomized control study of IAHSCT (n = 24) vs best available treatment (n = 8) performed at 3 hospitals in Canada in patients with aggressive MS who had a poor predicted 10-year prognosis,13,14 (ClinicalTrials.gov, NCT01099930). Detailed follow-up of the initial study included predefined and scheduled clinical, laboratory, and MRI examinations starting 5 months before the IAHSCT and continuing for at least 3 years. The study was then extended for monitoring alone for an additional 5 years and beyond.
Available data included demographics, HLA risk allele subtype, longitudinal clinical measures (number of clinical relapses, EDSS, MS Quality of Life [MSQOL-54] physical and mental scores, cognitive Paced Auditory Serial Addition Test score, and Fatigue Impact Score [FIS]), longitudinal serologic measures (oligoclonal bands, immunoglobulin G index, and immunoglobulin G-albumin ratio), and longitudinal MRI measures (T1-weighted sequences pre- and post-gadolinium [Gd], T2-weighted sequences, MR spectroscopy [MRS] N-acetylaspartate/creatine [NAA/Cr] ratio, and brain volume metrics). Two pretreatment MRI scans were performed with a minimum interval of 2 months, at 5 months, and 3 months before AHSCT. Post-treatment MRI time points were 1, 2, 4, 6, 9, and 12 months, then every 6 months until 3 years, thereafter every 12 months, maximum duration 10.5 years.
Paired sera and CSF were available for 23 patients at baseline (at the point of enrollment into the study), 20/23 patients at 1 year, and 18/23 at 3 years after treatment. Samples had been stored and aliquoted at −80°C to avoid freeze-thaw cycles. Complete serum-CSF paired samples were available in 23/23 patients at baseline.
Noninflammatory controls
Thirty-three patients were identified with noninflammatory illnesses with available serum and CSF obtained with appropriate consent.
Research questions (level II evidence)
Primary research question: In this cohort of patients with aggressive MS treated with IAHSCT, do levels of serum NfL reduce following treatment?
Secondary research question: Are pre- and post-treatment serum NfL levels associated with clinical and MRI indicators of disease severity and treatment response?
Neurofilament quantification
NfL levels in each serum/CSF were quantified in duplicate in accordance with manufacturers' instructions with appropriate standards and internal controls. Quanterix commercially available NfL immunoassay kits (cat#103186) were run in the fully automated ultrasensitive Simoa HD-1 Analyzer (Quanterix).
MRI analyses
T1 and T2 lesion volumes
MRI lesion-based measurements included number and volume of T1-weighted lesions (precontrast), number and volume of gadolinium-enhancing (Gd) lesions (T1 postcontrast), number of new or enlarging T2-weighted lesions, and volume of T2-weighted lesions.
Atrophy (whole brain, gray matter, and white matter)
Longitudinal brain volume changes (atrophy) were calculated in individual patients using pairs of precontrast T1-weighted images. All measurements were made with respect to the baseline MRI scans. Percentage whole-brain volume changes were calculated using FSL-Structural Image Evaluation using Normalisation of Atrophy.15 Gray and white matter volume changes were separately calculated using Jacobian integration, which is a nonlinear registration-based method.16
MRS NAA/Cr
MRS examinations were obtained using a Philips 1.5T Gyroscan ACS II scanner that was later changed to a Siemens 1.5T Sonata scanner. The spectroscopic volume of interest (VOI) consisted of a 15-mm thick slab centered on the corpus callosum and angulated parallel to the callosal line. The mean NAA/Cr was calculated within the spectroscopic VOIs.
Statistical analyses
Data analysis was performed using Graphpad Prism 5 software. For all analyses, a 95% significance level was used, and p values were 2 tailed. Complete serum-CSF paired samples were available in 23/23 patients at baseline, 20/23 at 1 year, and 18/23 at 3 years. The EDSS data set was complete except for 2 patients, who were lost to follow-up at 24 months and 36 months post-IAHSCT, respectively. Complete MRI data were available on 23/23 patients at baseline, 20/23 by 12 months, and 18/23 by 36 months. The last-observation-carried-forward method was used to impute the missing EDSS and MRI data. To compare NfL levels at baseline, 1, and 3 years, 1-way analysis of variance was used with Bonferroni multiple comparison test. For comparisons between 2 groups, paired and unpaired T tests were used as appropriate. To assess for correlations of baseline serum NfL levels and other variables, Pearson (parametric) and Spearman (nonparametric) correlation were selected as indicated by the D'Agostino-Pearson omnibus K2 test, and linear regression used to generate a best-fit line. To allow binary comparisons of patients with “high” compared with “low” baseline NfL levels and outcomes, the median baseline serum NfL level was selected as a cutoff; patients with an NfL level greater than the median were considered “high” and patients with a baseline serum NfL less than the median were considered “low”. Subsequent comparisons of “high” vs “low” NfL and their interaction with clinical and MRI variables over time were performed using 2-way repeat-measures (mixed model) analysis of variance or survival curves and applying the log-rank (Mantel-Cox) test. All statistics were performed in duplicate for consistency.
Registrations, patient consents, and approvals
Ethics and protocols in this study had been approved by Regional Ethics Boards of participating institutions as part of the original study, ClinicalTrials.gov Identifier: NCT01099930.12 All participants had given informed written consent.
Data availability
Individual deidentified participant data from this study will be shared on written request. Requests to access the data will be considered on request to the corresponding author.
Results
Baseline characteristics of IAHSCT patients and noninflammatory controls
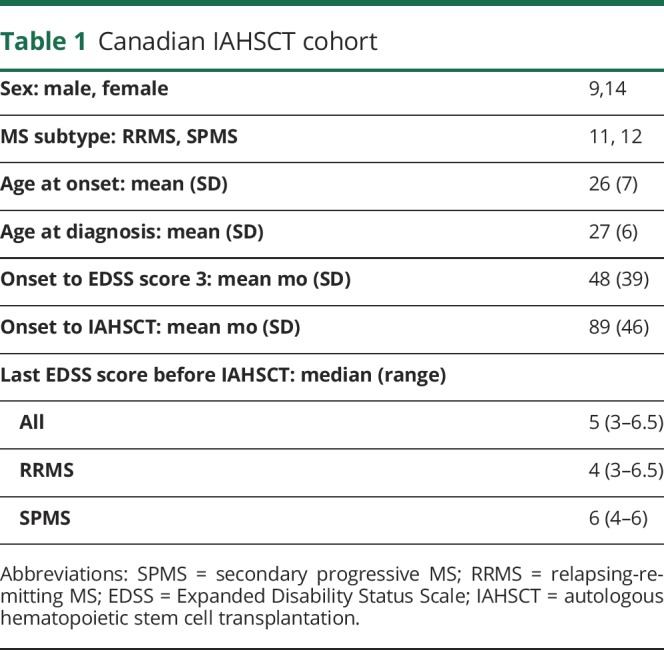
Baseline characteristics of patients with aggressive MS are outlined in table 1.
Table 1.
Canadian IAHSCT cohort
Of the 33 noninflammatory controls, 24 were women and 9 were men. The mean age at the time of sampling was 37.5 years, SD 10.9 years. Following exclusion of inflammatory/degenerative neurologic illnesses by neurologist assessment, MRI and CSF analysis, primary diagnoses were as follows: somatization (9), migraine (7), chronic fatigue syndrome (6), fibromyalgia (5), anxiety (3), labyrinthitis (2), and Bell palsy (commonly known as Bell's palsy) (1).
Serum and CSF NfL levels following IAHSCT
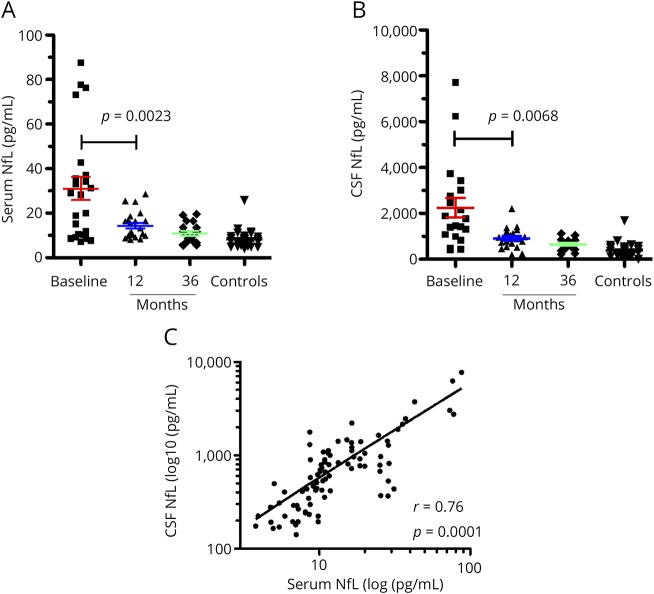
Serum NfL levels (figure 1A) were high in the patients with aggressive MS at baseline (mean 31.06 pg/mL, median 28.24 pg/mL, SD 25.01 pg/mL) relative to noninflammatory controls (mean 8.20 pg/mL SD 3.90 pg/mL). The differences were significant (p = 0.0001, 95% CI for the difference 12.22–33.49 pg/mL). Levels reduced significantly at 12 months (mean 14.39 pg/mL, SD 5.94 pg/mL, p = 0.0023, CI 5.19–28.14 pg/mL) and remained low at 36 months (mean 10.92 pg/mL, SD 4.63 pg/mL) following IAHSCT. Levels at 12 and 36 months did not differ significantly from each other and were not significantly different from noninflammatory controls. These results were similar to those seen in the CSF, albeit the latter showed much higher levels (figure 1B, mean for baseline group 2,248 pg/mL, SD 1897 pg/mL, p value for difference between baseline and controls = 0.0331, p value for difference between baseline and 12 months = 0.0068). Correspondingly, serum and CSF NfL levels correlated (figure 1C, Spearman r = 0.76 [0.56–0.89], p = 0.0001). Despite the significant reduction in serum NfL levels post-IAHSCT, baseline serum levels correlated weakly with post-treatment serum levels at 12 months (r = 0.5, p = 0.015) and 36 months (r = 0.60, p = 0.0083) (data not shown).
Figure 1. Serum and CSF neurofilament levels following Immunoablative Autologous Haematopoietic Stem Cell Transplant.
Baseline NfL levels (n = 23) were significantly elevated relative to controls (n=33) in (A), serum (p = 0.0001, 95% CI 13.33-32.38) and (B), CSF (p = 0.0001, 95% CI 1122-2638 ). Following IAHSCT, levels significantly reduced in both compartments (serum p=0.0023, 95% CI 6.39-26.94; CSF p = 0.0068, 95% CI 522.0-2141). Post-ASCT NfL levels (12 and 36m) in both serum and CSF were not significantly different from controls (p ≥ 0.05). Serum and CSF NfL levels were c, correlated (p = 0.0001, Spearman r = 0.76). 12m: 12 months post IAHSCT. 36m: 36 months post IAHSCT. Error bars represent the standard error of the mean. CI = confidence interval; IAHSCT = immunoablation followed by autologous hematopoietic stem cell transplantation; NfL = neurofilament light chain.
Baseline serum NfL levels compared with pre-IAHSCT clinical and MRI findings
The mean number of days between baseline serum/CSF sampling and the IAHSCT induction was 129 SD 121 days. The mean number of days between baseline serologic sampling and comparator MRI was 4.1, SD 25.5 days.
Although patients were all considered to have aggressive MS at baseline for inclusion in the study, patients with EDSS scores ≥6 had higher levels of NfL (n = 11, mean 43.19, SD 24.98 pg/mL) compared with those with an EDSS of <6 (n = 12, mean 19.94, SD 20.04 pg/mL) (figure 2A, p = 0.022). In addition, patients who had experienced a clinical relapse in the 12 months before baseline sampling also had had higher NfL levels (n = 9, mean 44.62, SD 33.68 pg/mL) compared with those who had not had a clinical relapse (n = 13, mean 23.24, SD 12.3) (figure 2B, p = 0.047).
Figure 2. Baseline clinical status of patients and serum NfL levels.

Patients who had a baseline NfL greater than the median value (>28.24 pgml-1, red line, n = 11) had rapidly reached EDSS score of 6 prior to IAHSCT, (A), median duration 6.91 years, compared to patients with lower levels (≤28.24 pgml-1, blue line, n = 12). Nine of the 23 patients had clinical relapses in the 12 months prior to IAHSCT. On average these patients had higher baseline serum NfL compared to the 13 patients who had not (p = 0.047). Error bars represent the standard error of the mean. EDSS = Expanded Disability Status Scale; IAHSCT = immunoablation followed by autologous hematopoietic stem cell transplantation; NfL = neurofilament light chain.
Spearman correlations between baseline serum NfL and MRI measures are summarized in table 2.
Table 2.
Spearman correlation between baseline serum NfL and baseline MRI findings
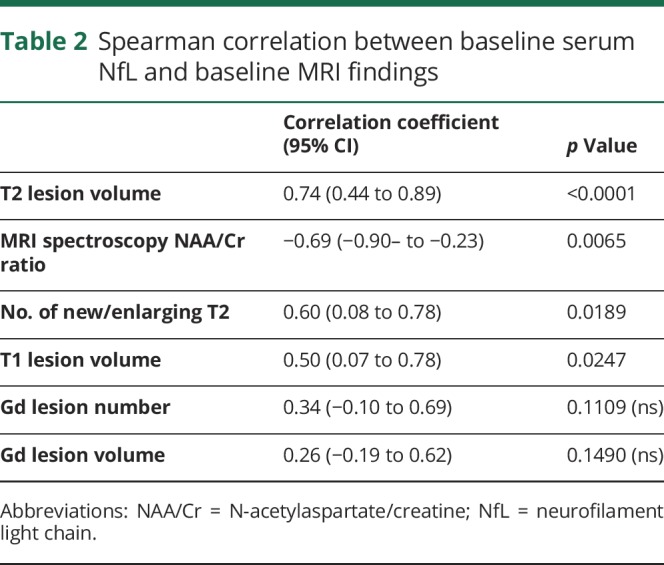
Increased serum NfL levels correlated with increased lesion-based MRI markers including T2 lesion volume (figure e-1A, links.lww.com/CPJ/A114, p = 0.0001, r = 0.74), the number of new/enlarging T2 lesions (p = 0.0189, r = 0.60, figure e-1B, links.lww.com/CPJ/A114), and T1 lesion volumes (p = 0.0247, r = 0.50 figure e-1C, links.lww.com/CPJ/A114). There was a negative correlation between serum NfL and the MRS marker of health tissue, NAA/Cr ratio (figure e-1C, links.lww.com/CPJ/A114, p = 0.0111, r = −0.6614). There was no significant correlation between baseline NfL levels and sex, age at onset of MS, clinical subtype (relapsing-remitting MS [RRMS] vs secondary progressive MS [SPMS]), and baseline number and volume of Gd-enhancing lesions.
Baseline serum NfL levels compared with post-IAHSCT clinical and MRI findings
To enable a binary comparison of NfL levels, the baseline group was divided into “high” and “low” levels using the median to establish a cutoff (28.24 pg/mL). Baseline samples with NfL >28.24 were considered “high” (n = 11) and samples with ≤ 28.24 pg/mL were considered low (n = 12).
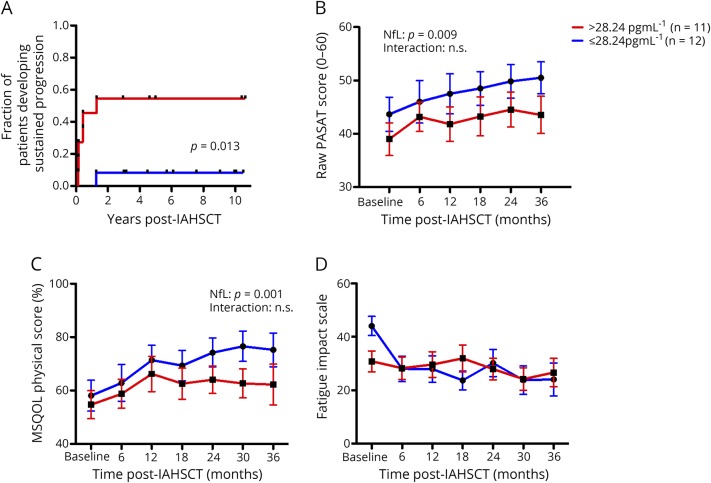
Following IAHSCT, none of the 23 patients with previously aggressive MS had further clinical relapses or new MRI lesions. Although EDSS scores in most patients remained stable or even improved following treatment, 7/23 patients experienced sustained accumulation of additional disability. Sustained progression was defined as an increase in the EDSS score observed on at least 2 occasions more than 6 months apart in the absence of new relapse or new MRI lesions. In these 7 patients, sustained progression occurred in the first 2 years following treatment. Deteriorations were nonspecific and by functional system included visual (n = 1), brainstem (n = 5), pyramidal (n = 4), cerebellar (n = 3), sensory (n = 3), bowel and bladder (n = 4), and mental (n = 2). Six of 7 patients with sustained progression had high baseline serum NfL levels (>28.24 pg/mL, the median baseline value). Conversely, 1/12 patients with low baseline NfL levels experienced EDSS progression (figure 3A, p = 0.013, log-rank Mantel-Cox test).
Figure 3. Baseline NfL levels and post IAHSCT clinical outcomes.
A baseline serum Nf-L greater than the median value (>28.24 pgml-1, red line, n = 11) compared to less than the median (<28.24 pgml-1, blue line, n = 12) was associated with (A) a greater chance of experiencing sustained progression (p = 0.029, Kaplan-Meir Log-rank test), (B) worse cognitive outcomes (p = 0.009), and (C) worse quality of life scores (p = 0.001) after IAHSCT. There were no differences in (D) fatigue scores following AHSCT. All interactions were non-significant, indicating that differences, where seen, were attributable to baseline differences between the high and low NfL groups. Error bars represent the standard error of the mean. IAHSCT = immunoablation followed by autologous hematopoietic stem cell transplantation; NfL = neurofilament light chain; ns = non-significant.
Using the total scores from the Paced Auditory Serial Addition test as a surrogate for cognition, we found that patients with high NfL consistently had worse cognitive scores both at baseline and following treatment (figure 3B, p = 0.0009). The interaction of cognitive scores over time between high and low NfL groups was not significant, indicating that the observed differences post-treatment are attributable to baseline differences; post-treatment cognitive scores between the groups paralleled each other. Similarly, patients with baseline NfL had persistently worse quality of life as indicated by the MSQOL-54 in physical (figure 3C, p = 0.0001) but not mental score (data not shown). Again, the interaction was not significant, indicating that post-treatment differences are likely related to baseline differences. Although patients with high NfL at baseline had significantly more fatigue (measured by the Fatigue Impact Scale) at baseline compared with those with low NfL levels (p = 0.048, data not shown), following IAHSCT, fatigue dropped to similar levels in patients with high and low baseline NfL levels and there were no significant differences seen between the lines (figure 3D).
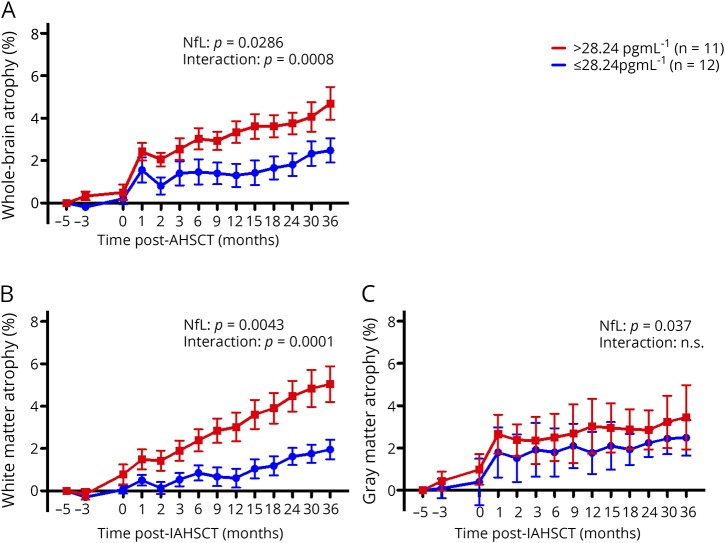
High NfL at baseline was associated with increased T1 lesion volumes (p = 0.0017, figure 4A), T2 lesion volumes (p = 0.0009, figure 4B), and a lower MRS NAA/Cr ratio (p = 0.0038, figure 4C) after IAHSCT. The interaction over time of post-IAHSCT T1 lesion volumes between high and low NfL groups was significant (p = 0.0060, figure 4A), i.e., patients with high NfL at baseline had more ongoing T1 lesion volume accrual post-IAHSCT compared with those who had low NfL levels. Although significant, this interaction was mild, accounting for 0.9% of the variation. Higher baseline NfL was also associated with and increased whole-brain atrophy (p value for high vs low NfL = 0.029, figure 5A), which was sustained at a higher rate after treatment (p value for the interaction 0.0008, accounting for 3.51% of the variation). This atrophy was greatest in white matter (NfL p = 0.0043, interaction p = 0.0001: variation 5.48%, figure 5B) compared with the gray matter atrophy where differences were accounted for baseline differences (NfL p = 0.021, insignificant interaction, figure 5C).
Figure 4. Baseline NfL levels and post IAHSCT MRI outcomes.

A baseline serum Nf-L >28.24 pgml-1 (red lines, n = 11) compared to <28.24 pgml-1 (blue lines, n = 12) was associated with (A) greater T1 lesion volumes (p = 0.017), (B) greater T2 lesion volumes (p = 0.0009) and (C) reduced MRI spectroscopy NAA/Cr ratio (p = 0.0038). The interaction of NfL over time was only significant for T1, accounting for 0.9% of the variability; patients with high baseline NfL had slightly more T1 lesion volume accrual post-treatment. Error bars represent the standard error. NfL = neurofilament light chain.
Figure 5. Baseline NfL levels and post IAHSCT MRI brain atrophy.
High baseline NfL (>28.24 pgml-1, red lines, n = 11) was associated with (A) more brain atrophy following AHSCT (p = 0.029) compared to low baseline NfL (<28.24 pgml-1, blue lines, n = 12). Moreover, the high NfL group continued to endure a greater rate of on-going brain atrophy post IAHSCT signified by the interaction of NfL over time between the groups (p = 0.0008, 3.51% of total variation). This was more attributable to (B) white matter (p = 0.0043) rather than (C) grey matter volume loss (p = 0.037). The greatest differential rate of brain atrophy was seen in the white matter which persisted at 36 months post IAHSCT (p < 0.0001). Error bars represent the standard error. IAHSCT = immunoablation followed by autologous hematopoietic stem cell transplantation; NfL = neurofilament light chain.
Post-IAHSCT serum NfL levels compared with post-IAHSCT clinical and MRI findings
Following IAHSCT, none of the patients experienced any new relapses or evidence of ongoing MRI lesion activity. Nonetheless, we found that 12-month NfL levels were higher in the 7 patients who experienced sustained progression (mean 18.6 pg/mL, SD 6.6) compared with those who remained stable or improved (figure e-2A, links.lww.com/CPJ/A114, mean 12.6 pg/mL SD 4.8, p = 0.029). In addition, there was also a positive correlation of 12-month serum NfL and 12-month white matter atrophy (figure e-2B, links.lww.com/CPJ/A114, p = 0.017, Spearman r = 0.494) and a weaker association with whole-brain and gray matter atrophy, which did not reach significance. There was no correlation with 12-month NfL and T1/T2 lesion volumes, MRI spectroscopy NAA/Cr, or any of the clinical indices including FIS, Paces Auditory Serial Addition Test, or the MSQOL Inventory. There was no association with 36-month serum NfL levels and clinical or MRI outcomes.
Discussion
In this small study of patients with aggressive MS treated with IAHSCT, we show that elevated baseline levels of both serum and CSF NfL reduce quickly following treatment and remain low for at least 3 years of follow-up. Serum and CSF levels correlate closely. Raised baseline serum NfL levels also associated with poorer clinical outcomes following IAHSCT and more extensive MRI disease compared with those with lower levels.
Pre- and post-treatment samples from this IAHSCT cohort represent the extremes of MS disease severity, with aggressive disease at baseline followed by durable suppression of inflammatory activity following treatment. They therefore provided a valuable opportunity to investigate NfL as a biomarker of treatment response.
Before IAHSCT, mean NfL levels in our group of patients (31.1 pg/mL) were much higher than levels recently reported in a large population of patients with RRMS using the same assay platform (16.9 pg/mL, although we note that this was quantified using an in-house rather than commercially available kit as in our study).17 Even so, at baseline, there was significant variability in the observed levels; although 4 patients had levels >70 pg/mL, some patients with clinically aggressive disease had serum NfL levels similar to those of the controls. This likely reflects a spectrum of disease activity even within this group, where we found associations between pretreatment NfL levels and established clinical and MRI measures of MS activity, similar to other studies.5,6,13 Before treatment, high baseline NfL levels were associated with more rapid EDSS progression and higher EDSS scores, more relapses in the preceding year, greater MRI lesion burden, and an unfavorable MRI spectroscopy profile. Further chart review revealed that of the 3 of the 4 patients with the highest levels had clinically relapsed in the 3 months before IAHSCT, and none had received induction therapies. Conversely, 0 of 6 patients with the lowest levels had relapsed in the 6 months before IAHSCT, and 4 had received mitoxantrone therapy in the preceding 2 years to stabilize their condition. These observations substantiate the role of NfL as a potential marker of disease activity.
Following IAHSCT, all of the patients' NfL levels remained suppressed in both serum and CSF and were not significantly different from a non-MS control group. However, there remained a weakly significant correlation of pre- and post-treatment levels at both 12 and 36 months. The mean reduction from 31.06 pg/mL to 14.39 pg/mL by 1 year post-treatment is the most dramatic reduction in serum NfL levels following an MS treatment reported to date.8,10,18,19 For example, using the same assay, in a study of 240 patients starting fingolimod,19 mean serum NfL reduced from 20.4 pg/mL to 13.5 pg/mL after 1 year of treatment (although again, we note that this study used an in-house methodology, perhaps limiting comparability with the commercially available kit we used). Our study is unique in that NfL levels were consistently suppressed in all of the patients following treatment in the absence of other DMT's; in all of the previous studies, although there was a correlation of NfL reduction with treatment response, there were individual patients who experienced significant increases in NfL associated with treatment failure. We have shown previously that IAHSCT produces a long-term suppression of ongoing inflammatory disease activity,12 and here, we show that this is associated with a substantial sustained suppression of NfL levels. Nonetheless, the observation that pretreatment NfL levels still correlated with those post-treatment likely indicates that inflammatory disease activity is not the only driver of NfL release in patients with MS. Secondary neurodegenerative processes may be also be contributory and continue irrespective of ongoing inflammation.
Higher baseline NfL levels were associated with a worse post-treatment clinical prognosis (sustained EDSS progression, cognitive markers, and quality of life indices) and worse MRI outcomes (T1 and T2 lesion burden, MRS, and brain atrophy). Most of these post-treatment associations seem to be attributable to baseline differences between these groups; more severe patients fared the worst post-IAHSCT largely due to more progressed disease to begin with. However, post-IAHSCT, brain atrophy continued to accumulate at a faster rate in patients who had high pretreatment NfL levels. These differences were greatest in the white matter as opposed to the gray matter, and interestingly, even the 12-month post-treatment NfL levels weakly correlated with white matter atrophy. Although others have shown that serum NfL is predictive of future MRI brain atrophy,9,20 we saw this in our study even in the absence of ongoing inflammatory disease activity, a possible confounder. Furthermore, this is the first study to correlate NfL levels with differential measures of white and gray matter atrophy in MS. The finding that NfL is most strongly associated with future white matter atrophy was surprising, as NfL is thought to represent neuroaxonal loss.
The association of serum NfL with the MRS NAA/Cr is novel, but makes sense as both NfL and NAA/Cr are markers of neuroaxonal damage. It is not clear why there was a sustained rate of T1 lesion accrual post-IAHSCT in patients with high NfL (as none of these patients had any new lesions). However, the magnitude of this interaction was mild (accounting for only 0.9% of variation) and may represent natural evolution of existing lesions.
The substrate of post-treatment clinical (EDSS) progression seen in 7/23 of the IAHSCT patients is unclear. Remarkably, the patients who went on to develop sustained progression generally had high pretreatment NfL levels (figure 3A). A similar observation was made by Petzold et al.,21 who observed that high serum neurofilament heavy chain levels (a close relative of NfL) were associated with sustained disability progression on the EDSS following a similar bone marrow transplant.
In our study, these associations remained weakly significant in the 12-month neurofilament levels. Together, the positive associations of pre- and post-treatment NfL levels with sustained EDSS progression and MRI atrophy perhaps indicate ongoing neurodegeneration more evident in some patients, which persists irrespective of inflammatory disease, more evident in patients with more active and advanced pretreatment disease. This is important if we are to understand the use of NfL in progressive MS trials.
We found associations with high NfL and poorer outcomes on well-validated functional indices of cognition (PASAT22) and quality of life (MSQOL-5423 physical composite). There was no association with the mental composite of the MSQOL-54 or fatigue, although there was a 36% reduction following IAHSCT in this cohort as reported elsewhere.24 The observed differences in cognition and quality of life are attributable to baseline differences between the groups.
Although this study was limited by its size, this was dictated by the small number of patients who underwent IAHSCT for aggressive MS as part of the Canadian Bone Marrow Transplant Study. Other limitations include the retrospective study design and the wide intervals between sampling. A separate study to investigate more frequent time points in the first year post-IAHSCT is currently underway. This will help delineate the timeline of the NfL reduction compared MRI observations. As shown in figure 5, there was a particularly large increase in brain volume loss in the first month following IAHSCT. This has also been observed following induction of other treatments.25 Likely contributory explanations include pseudoatrophy related to brain shrinkage as the inflammation subsides,25 or perhaps more concerning in the case of IAHSCT, neuronal loss related to chemotherapy neurotoxicity. This hypothesis is substantiated by increases in neurofilament heavy chain in the CSF in the months following bone marrow transplant for MS.21 Serial quantification of serum NfL and other markers of neuronal injury at early post-treatment time points will be informative.
This study provides group-level data supporting the role of NfL as a quantitative marker of MS disease severity and treatment response. This convenient measure may one day form part of routine MS monitoring. However, further studies are required before clinicians can depend on it to inform treatment choices for their patients; it is not clear how changes in NfL translate to individual patients and treatment decisions. Ongoing prospective studies will help to address this. Further basic research is also necessary to clarify the mechanisms underlying NfL release, CSF-serum clearance, and how these factors might differ between patients independently of neuroaxonal loss.
Acknowledgment
The authors thank Iva Stonebridge for technical and logistical support, Dr. Tim Ramsey for assistance reviewing statistical methods and analyses, and Dr Lisa Walker and Dr Gauruv Bose for sharing data related to fatigue. They acknowledge the grant support from the MS Society of Canada and the contribution of Quanterix.
Glossary
- DMT
disease-modifying treatment
- EDSS
Expanded Disability Status Scale
- FIS
Fatigue Impact Score
- IAHSCT
immunoablation followed by autologous hematopoietic stem cell transplantation
- MRS
MR spectroscopy
- MSQOL
MS Quality of Life
- NAA/Cr
N-acetylaspartate/creatine
- NfL
neurofilament light chain
- RRMS
relapsing-remitting MS
- SPMS
secondary progressive MS
- VOI
volume of interest
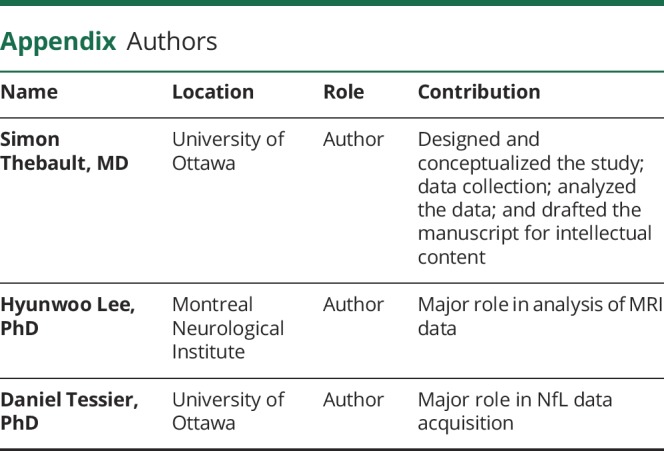
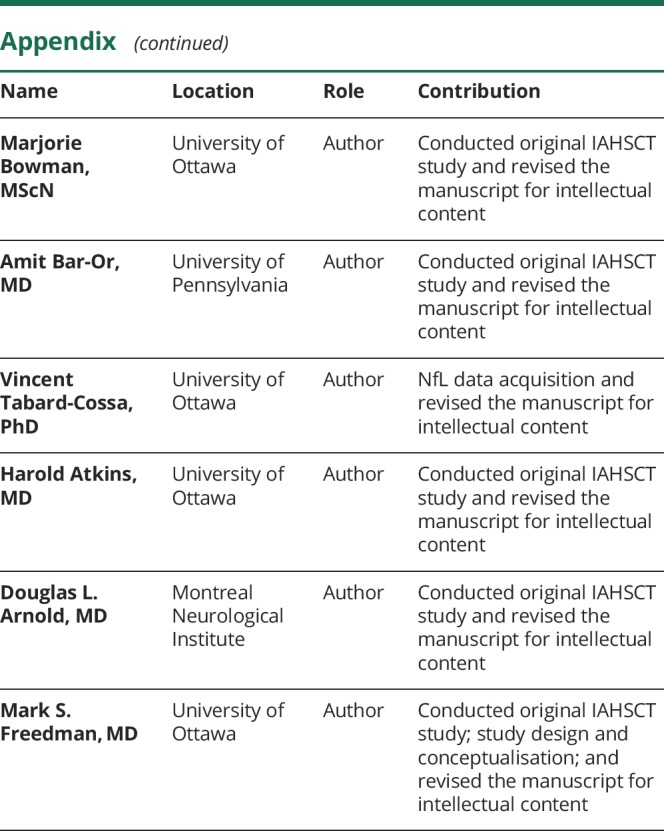
Appendix. Authors
Footnotes
Editorial, page e599
Study funding
This study was funded by the MS Foundation of Canada.
Disclosure
S. Thebault, D.R. Tessier, H. Lee, and M. Bowman report no disclosures. A. Bar-Or has participated as a speaker in meetings sponsored by and received consulting fees and/or grant support from Actelion; Atara Biotherapeutics, Biogen Idec, Celgene/Receptos, Genentech/Roche, MAPI, MedImmune, Merck/EMD Serono, Novartis, and Sanofi Genzyme and receives research funding from the Canadian Institutes of Health Research, Multiple Sclerosis Society of Canada, Multiple Sclerosis Scientific Foundation, National Multiple Sclerosis Society, NIH, Melissa and Paul Anderson Chair in Neuroinflammation. D. Arnold reports consultant fees and/or grants from Acorda, Adelphi, Alkermes, Biogen, Celgene, Frequency Therapeutics, Genentech, Genzyme, Hoffmann-La Roche, Immune Tolerance Network, Immunotec, MedDay Merck Serono, Novartis, Pfizer, Receptos, Roche, Sanofi-Aventis, Canadian Institutes of Health Research, MS Society of Canada, International Progressive MS Alliance, and an equity interest in NeuroRx Research. H.L. Atkins reports no disclosures. V. Tabard-Cossa is funded by NIH#1R21EB024120-01, Genome Canada, the Province of Ontario, and the Natural Sciences and Engineering Research Council of Canada. He also received research support from Abbott and royalty payments from Abbott and Multerra Bio. M.S. Freedman received a research grant from Genzyme Canada; honoraria from Actelion, Bayer Healthcare, Biogen Idec, Celgene Canada, Chugai, EMD Canada, Genzyme, Merck Serono, Novartis, Hoffmann-La Roche, Sanofi-Aventis, and Teva Canada Innovation. He serves on the advisory boards of Actelion (now Johnson and Johnson), Bayer Healthcare, Biogen Idec, Celgene, Clene Nanomedicine, Hoffmann-La Roche, Merck Serono, MedDay, Novartis, and Sanofi-Aventis. He participates in a company sponsored speaker's bureau for Sanofi Genzyme. Go to Neurology.org/NN for full disclosures.
References
- 1.Freedman MS. Induction vs. escalation of therapy for relapsing multiple sclerosis: the evidence. Neurol Sci 2008;29:250–252. [DOI] [PubMed] [Google Scholar]
- 2.Wattjes MP, Steenwijk MD, Stangel M. MRI in the diagnosis and monitoring of multiple sclerosis: an update. Clin Neuroradiol 2015;25:157–165. [DOI] [PubMed] [Google Scholar]
- 3.Rovira Á, Wattjes MP, Tintoré M, et al. Evidence-based guidelines: MAGNIMS consensus guidelines on the use of MRI in multiple sclerosis—clinical implementation in the diagnostic process. Nat Rev Neurol 2015;11:471–482. [DOI] [PubMed] [Google Scholar]
- 4.Nielsen S, Nagelhus EA, Amiry-Moghaddam M. Specialized membrane domains for water transport in glial cells: high-resolution immunogold cytochemistry of aquaporin-4 in rat brain. J Neurosci 1997;17:171–180. [DOI] [PMC free article] [PubMed] [Google Scholar]
- 5.Kearney H, Miller DH, Ciccarelli O. Spinal cord MRI in multiple sclerosis-diagnostic, prognostic and clinical value. Nat Rev Neurol 2015;11:327–338. [DOI] [PubMed] [Google Scholar]
- 6.Rissin DM, Kan CW, Campbell TG, et al. Single-molecule enzyme-linked immunosorbent assay detects serum proteins at subfemtomolar concentrations. Nat Biotechnol 2010;28:595–599. [DOI] [PMC free article] [PubMed] [Google Scholar]
- 7.Kuhle J, Barro C, Andreasson U, et al. Comparison of three analytical platforms for quantification of the neurofilament light chain in blood samples: ELISA, electrochemiluminescence immunoassay and Simoa. Clin Chem Lab Med 2016;54:1655–1661. [DOI] [PubMed] [Google Scholar]
- 8.Disanto G, Barro C, Benkert P, et al. Serum neurofilament light: A biomarker of neuronal damage in multiple sclerosis. Ann Neurol 2017;81:857–870. [DOI] [PMC free article] [PubMed] [Google Scholar]
- 9.Chitnis T, Gonzalez C, Healy BC, et al. Neurofilament light chain serum levels correlate with 10-year MRI outcomes in multiple sclerosis. Ann Clin Transl Neurol 2018:1478–1491. [DOI] [PMC free article] [PubMed] [Google Scholar]
- 10.Varhaug KN, Barro C, Bjørnevik K, et al. Neurofilament light chain predicts disease activity in relapsing-remitting MS. Neurol Neuroimmunol NeuroInflamm 2018;5:e422 doi:10.1212/NXI.0000000000000422. [DOI] [PMC free article] [PubMed] [Google Scholar]
- 11.Barro C, Benkert P, Disanto G, et al. Serum neurofilament as a predictor of disease worsening and brain and spinal cord atrophy in multiple sclerosis. Brain 2018;141:2382–2391. [DOI] [PubMed] [Google Scholar]
- 12.Atkins HL, Bowman M, Allan D, et al. Immunoablation and autologous haemopoietic stem-cell transplantation for aggressive multiple sclerosis: a multicentre single-group phase 2 trial. Lancet 2016;388:576–585. [DOI] [PubMed] [Google Scholar]
- 13.Weinshenker BG, Rice GPA, Noseworthy JH, Carriere W, Baskerville J, Ebers GC. The natural history of multiple sclerosis: a geographically based study. Brain 1991;114:1045–1056. [DOI] [PubMed] [Google Scholar]
- 14.Menon S, Shirani A, Zhao Y, et al. Characterising aggressive multiple sclerosis. J Neurol Neurosurg Psychiatry 2013;84:1192–8. [DOI] [PubMed] [Google Scholar]
- 15.Smith SM, Zhang Y, Jenkinson M, et al. Accurate, robust, and automated longitudinal and cross-sectional brain change analysis. Neuroimage 2002;17:479–489. [DOI] [PubMed] [Google Scholar]
- 16.Nakamura K, Guizard N, Fonov VS, Narayanan S, Collins DL, Arnold DL. Jacobian integration method increases the statistical power to measure gray matter atrophy in multiple sclerosis. NeuroImage Clin 2014;4:10–7. [DOI] [PMC free article] [PubMed] [Google Scholar]
- 17.Novakova L, Zetterberg H, Sundström P, et al. Monitoring disease activity in multiple sclerosis using serum neurofilament light protein. Neurology 2017;89:2230–2237. [DOI] [PMC free article] [PubMed] [Google Scholar]
- 18.Novakova L, Axelsson M, Khademi M, et al. Cerebrospinal fluid biomarkers as a measure of disease activity and treatment efficacy in relapsing-remitting multiple sclerosis. J Neurochem 2017;141:296–304. [DOI] [PubMed] [Google Scholar]
- 19.Piehl F, Kockum I, Khademi M, et al. Plasma neurofilament light chain levels in patients with MS switching from injectable therapies to fingolimod. Mult Scler J 2018;24:1046–1054. [DOI] [PubMed] [Google Scholar]
- 20.Kuhle J, Nourbakhsh B, Grant D, et al. Serum neurofilament is associated with progression of brain atrophy and disability in early MS. Neurology 2017;88:826–831. [DOI] [PMC free article] [PubMed] [Google Scholar]
- 21.Petzold A, Mondria T, Kuhle J, et al. Evidence for acute neurotoxicity after chemotherapy. Ann Neurol 2010;68:806–815. [DOI] [PubMed] [Google Scholar]
- 22.Tombaugh TN. A comprehensive review of the Paced Auditory Serial Addition Test (PASAT). Arch Clin Neuropsychol 2006;21:53–76. [DOI] [PubMed] [Google Scholar]
- 23.Vickrey BG, Hays RD, Harooni R, Myers LW, Ellison GW. A health-related quality of life measure for multiple sclerosis. Qual Life Res 1995;4:187–206. [DOI] [PubMed] [Google Scholar]
- 24.Bose G, Atkins HL, Bowman M, Freedman MS. Autologous hematopoietic stem cell transplantation improves fatigue in multiple sclerosis. Mult Scler J Epub 2018 Sep 25. [DOI] [PubMed]
- 25.Stefano N De, Arnold DL. Towards a better understanding of pseudoatrophy in the brain of multiple sclerosis patients. Mult Scler 2015;21;675–676. [DOI] [PubMed] [Google Scholar]
Associated Data
This section collects any data citations, data availability statements, or supplementary materials included in this article.
Data Availability Statement
Individual deidentified participant data from this study will be shared on written request. Requests to access the data will be considered on request to the corresponding author.


