

Abstract
During infection, hepatocytes must undergo a reprioritization of metabolism, termed metabolic reprogramming. Hepatic metabolic reprogramming in response to infection begins within hours of infection, suggesting a mechanism closely linked to pathogen recognition. Following injection with polyinosinic:polycytidylic acid, a mimic of viral infection, a robust hepatic innate immune response could be seen involving the TNFα pathway at 2 hours. Repeated doses led to the adoption of Warburg-like metabolism in the liver as determined by in vivo metabolic imaging, expression analyses and metabolomics. Hepatic macrophages, Kupffer cells, were able to induce Warburg-like metabolism in hepatocytes in vitro via TNFα. Eliminating macrophages in vivo or blocking TNFα in vitro or in vivo resulted in abrogation of the metabolic phenotype, establishing an immune-metabolic axis in hepatic metabolic reprogramming. Overall, we suggest that macrophages, as early sensors of pathogens, instruct hepatocytes via TNFα to undergo metabolic reprogramming to cope with challenges to homeostasis initiated by infection. This work not only addresses a key component of end-organ physiology, but also raises questions about the side effects of biologies in the treatment of inflammatory diseases.
Keywords: Immunometabolism, metabolic reprogramming, macrophages, tumor necrosis factor alpha, cytokines, hepatocytes, Warburg-like metabolism
INTRODUCTION
During infection, the body’s reserves of protein, carbohydrate, and fat are rapidly broken down to provide energy. Unlike starvation, the normal conservation of metabolic fuels and energy is not observed, placing the organism in negative energetic balance, making the physiology of infection unique [1–3]. Catabolic responses are mediated in large part by an integrated system of CNS signals, circulating hormones, peptides and cytokines [1]. The liver relies on the systemic flood of metabolites for biosynthesis and energy extraction, and therefore, must be primed via metabolic reprogramming to utilize these precursors.
The liver is the metabolic hub of the body in mammals. The anabolic and catabolic activities of the liver are critical for providing fuel to the brain, muscle, and other peripheral organs. In response to infection, the liver undergoes a reprioritization of metabolism (i.e. metabolic reprogramming) to cope with this perturbation in homeostasis. Metabolic reprogramming has been observed in infections which directly involve hepatocytes. The liver parasite, Toxoplasma gondii, leads to a hepatic downregulation of proteins involved in oxidative phosphorylation (OXPHOS), fatty acid and lipid metabolism, and xenobiotic metabolism [4]. Hepatic viral infections, such as hepatitis B, induce upregulation of glutamate dehydrogenase 1, isocitrate dehydrogenase, and genes involved in lipid biosynthesis [5, 6]. However, hepatic metabolic reprogramming may also be independent of the tropism of the infection, but rather, dependent upon extrahepatic signals. Previous work by our group on non-hepatic viral infections (i.e. influenza) demonstrated a depression of hepatic mitochondrial urea cycle activity and fatty acid oxidation [7–9]. The signals promoting metabolic reprogramming in response to infection are complex and may involve an integration of numerous messages from the nervous, endocrine and immune systems [10].
The systemic metabolic response to infection may begin within hours of infection, before the onset of clinical signs or symptoms of illness, suggesting a rapid response mechanism temporally linked to pathogen recognition. Based on this, we hypothesized that metabolic reprogramming in the liver develops due to signals conveyed by the innate immune system. In order to address this fundamental question and identify the mechanism promoting this quick response, we employed a method of inducing a sterile inflammatory response in mice, characteristic of a viral infection and without the extreme physiologic state of sepsis, using a toll-like receptor 3 (TLR3) ligand polyinosinic:polycytidylic acid (pI:C). Repeated doses of pI:C led to an enhancement of glycolysis and a suppression of mitochondrial metabolism, i.e. an adoption of Warburg-like metabolism in the liver. The adoption of Warburg-like metabolism was dependent upon macrophage derived TNFα. Targeting the innate immune response by eliminating macrophages or blocking TNFα resulted in abrogation of the Warburg-like phenotype and helped establish an immune-metabolic axis that mediates metabolic reprogramming. Our results suggest that macrophage derived TNFα is an important mediator of metabolic reprogramming, highlighting the beneficial relationship between innate immune cells and end-organ metabolism.
MATERIALS AND METHODS
Animals
Mice (C57BL/6) were housed in a pathogen-free facility, caged individually, had access to a 24% protein mush-based feed, Nutragel (Bio-Serv, Frenchtown, NJ), and autoclaved reverse osmosis water. Mice were kept in a temperature (22 ± 2°C) and humidity (30-70%) controlled environment with a 12-hour light cycle. B6.129S4-Mtortml.2Koz/J were crossed with albumin-Cre transgenic mice (Tg(Alb-cre)21Mgn (The Jackson Laboratory, Bar Harbor, ME) to produce a liver-specific mTOR knockout mouse line. Eight-week-old mice received an intraperitoneal injection of 100 μg of polyinosinic:polycytidylic acid (pI:C) once a day for 3 days. For Kupffer cell depletion experiments, mice were injected i.p. with 200 μL of Clodrosome (liposomal clodronate, Encapsula NanoSciences, Brentwood, TN). To block TNFα in vivo, etanercept (Immunex, Thousand Oaks, CA) was administered at 100 μg/mouse i.p 24 hrs prior to and concurrent with the initial pI:C dose. For harvesting tissue, mice were euthanized on Day 3, 2 hrs following final pI:C dose, by carbon dioxide inhalation followed by cervical dislocation. All tissues were isolated and stored at −80°C until use. For liver perfusion studies, mice were anesthetized with Avertin (1.25%, 0.04 ml/gm BW i.p.) and perfused with 0.02% EGTA-containing Mg2+/Ca2+-free PBS. All animal care and procedures were carried out according to the criteria outlined in the “Guide for the Care and Use of Laboratory Animals” prepared by the National Academy of Sciences and published by the National Institutes of Health (NIH publication 86-23 revised 1985) and were authorized by the Animal Care and Use Committees of the National Human Genome Research Institute.
Cell culture
Hep3B cells were maintained in DMEM with 10% FBS. The Hep3B cells were incubated for 72 hours with increasing amounts of TNFα as indicated. Hepatocytes and KCs were maintained in DMEM/F-12 + GlutaMAX (ThermoFisher) with 10% FBS unless indicated otherwise. Primary mouse hepatocytes were obtained using a two-step collagenase perfusion method described previously (http://mouselivercells.com/Documents/Hepatocyte%20Isolation%20Protocol.pdf). Kupffer cells were isolated using selective adherence as previously described [11]. Freshly isolated hepatocytes were seeded in Matrigel-coated (Corning) 24-well plate at 1 × 10⁵ cells/well in cell culture media and incubated overnight at 37°C, 5% CO2. To 24-well transwells, 4 × 10⁴ Kupffer cells after selective adherence. Stimulation was performed with 100 μg/mL pI:C for 24 hrs with or without Etanercept at 4 μg/mL.
Mouse physiology
Body temperature was determined using G2 E-Mitter transponders (Starr Life Sciences, Oakmont, PA) implanted intraperitoneally under isoflurane anesthesia with flunixin analgesia (2.2 mg/kg sc at operation). Mice were studied at least one week after surgery. Signals were acquired using ER4000 Energizer/Receivers and the manufacturer’s software. Tb and activity was recorded for 9 days. Poly 1C (100 ug/mouse ip) or saline were administered on Day 4, 5 and 6 at 10 am. Body composition was measured in conscious mice daily for 5 days by time domain Echo MRI 3-in-1 (Echo Medical Systems, Houston, TX). The indirect calorimetry system (CLAMS, Columbus Instruments, Columbus, OH) was used to measure O2 consumption, CO2 production, activity (infrared beam break; one beam break is one count), and food intake from 12 chambers (2.5 L volume, constant flow rate of 0.5 L/min, sampling flow of 0.4 L/min, without bedding or nesting), each sampled every 13 min. Experiments were performed at 22oC. Mice were acclimated to the chambers for 3 days, followed by three days of poly IC or vehicle injection (100 ug/mouse ip once a day) and three days of recovery period. Food and water were provided ad libitum at all times. Core body temperature and activity were measured continuously by telemetry (Starr Life Sciences, Oakmont, PA) using ER4000 energizer/receivers, G2 E-mitters implanted intraperitoneally, and VitalView software, with data collected each minute [12].
Metabolomics
Liver metabolomics were performed by Metabolon (Research Park Triangle, NC). Snap frozen liver tissue for analysis was provided. The sample preparation process was carried out using the automated MicroLab STAR® system (Hamilton Company, Reno, NV). Recovery standards were added prior to the first step in the extraction process for QC purposes. Sample preparation was conducted using a proprietary series of organic and aqueous extractions to remove the protein fraction while allowing maximum recovery of small molecules. The resulting extract was divided into two fractions; one for analysis by LC and one for analysis by GC. Samples were placed briefly on a TurboVap® (Zymark, Hopkinton, MA) to remove the organic solvent. Each sample was then frozen and dried under vacuum. Samples were then prepared for the appropriate instrument, either LC/MS or GC/MS. The LC/MS portion of the platform was based on a Waters ACQUITY UPLC (Waters, Milford, MA) and a Thermo-Finnigan LTQ (Thermo Finnigan, Somerset, NJ) mass spectrometer, which consisted of an electrospray ionization (ESI) source and linear ion-trap (LIT) mass analyzer. The sample extract was split into two aliquots, dried, then reconstituted in acidic or basic LC-compatible solvents, each of which contained 11 or more injection standards at fixed concentrations. One aliquot was analyzed using acidic positive ion optimized conditions and the other using basic negative ion optimized conditions in two independent injections using separate dedicated columns. Extracts reconstituted in acidic conditions were gradient eluted using water and methanol both containing 0.1% Formic acid, while the basic extracts, which also used water/methanol, contained 6.5mM Ammonium Bicarbonate. The MS analysis alternated between MS and data-dependent MS2 scans using dynamic exclusion. The samples destined for GC/MS analysis were re-dried under vacuum desiccation for a minimum of 24 hours prior to being derivatized under dried nitrogen using bistrimethyl-silyl-triflouroacetamide (BSTFA). The GC column was 5% phenyl and the temperature ramp is from 40° to 300° C in a 16 minute period. Samples were analyzed on a Thermo-Finnigan Trace DSQ fast scanning single-quadrupole mass spectrometer using electron impact ionization. The instrument was tuned and calibrated for mass resolution and mass accuracy on a daily basis.
13C MRI of hyperpolarized 13C-labeled pyruvate metabolism
Hyperpolarized 13C MRI studies were performed on a 4.7T scanner (Bruker Bio-Spin MRI GmbH) using a set of saddle coils for 1H and 13C. Axial and coronal T2-weighted anatomic images were obtained using a fast spin echo sequence (RARE) with an echo time of 13 milliseconds, repetition time of 2,500 milliseconds, RARE factor 8, slice thickness of 2 mm, field of view of 32 mm, and resolution of 0.125 × 0.125 mm2. Samples of [1-13C] pyruvic acid (30 μL) containing 15 mM of TAM and 2.5 mM of the gadolinium chelate ProHance (Bracco Diagnostics, Milano, Italy) were polarized at 3.35 T and 1.4 K in the Hypersense DNP polarizer (Oxford Instruments). After 40-60 min, the hyperpolarized sample was rapidly dissolved in 4.5 mL of a superheated alkaline buffer comprising 40 mM 4-(2-hydroxyethyl)-1-piperazineethanesulfonic acid (HEPES), 30 mM of NaCl and 100 mg/L ethylendiaminetetraacetic acid (EDTA). NaOH was added to the dissolution buffer to be pH 7.4 after mixture with [1-13C] pyruvic acid. Hyperpolarized [1-13C] pyruvate solution (12 μL/g body weight) was intravenously injected through a catheter placed in the tail vein of mouse. The 13C two-dimensional spectroscopic images were acquired 30 seconds after the start of pyruvate injection from a 32 mm field of view in an 8 mm coronal slice through the liver, with matrix size of 16 × 16, spectral width of 6010 Hz, TR 75 ms, 250 μs Gaussian excitation pulse with a flip angle of 10°. The total time required to acquire an image was 19.2 seconds.
Pyruvate oxidation breath testing
Mice were injected via intraperitoneal route with 10 mg/kg of 13C-pyruvate (Cambridge Isotopes, Tewksbury, MA) diluted in sterile saline. Upon injection mice were placed into a respiratory chamber with CO2 monitoring. Breath samples were collected at 5, 10, 20, 30, 40, and 50 minutes after injection. Measurement of the isotope ratio (13C/12C) of the expired gas was performed with a gas isotope ratio mass spectrometer (Metabolic Solutions, Nashua, NH).
Mitochondrial respiratory chain complex activity
To measure the mitochondrial chain respiratory chain complex activities, 40 mg tissue was homogenized in 0.15M KCl, 50 mM Tris-HCl, pH 7.4, sonicated for 10s and centrifuged at 2500g for 20 min at 4°C. The supernatant was used for protein determination by the Bradford assay and mitochondrial respiratory chain enzymes analysis using a previously published protocol [13]. Extracellular flux analyses of Hep3B cells (80,000 cells/well) were performed using the MitoStress Kit and Seahorse Bioanalyzer according to the manufacturer’s instructions (Agilent Technologies, Santa Clara, CA).
qPCR
RNA was extracted from homogenized liver tissue using a kit (Qiagen, Germantown, MD). For RT-PCR, 1 μg of RNA was reverse transcribed to cDNA using a modified MMLV-reverse transcriptase (iScript, Bio-Rad, Hercules, CA). Real-time quantitative PCR reactions were carried out using the following TaqMan commercial primers: TLR3, MDA5, RIG-1, TNFα, Gck, and Pfk (Applied Biosciences, Carlsbad, CA). All results were normalized to β-actin (Applied Biosciences, Carlsbad, CA). Reactions were cycled and quantitated with an ABI 7500 Fast Real Time PCR System (Applied Biosystems, Foster City, CA).
Immunoblot
For western blot analysis, 30 μg of protein was loaded on 4-20% Tris-glycine polyacrylamide gels. The gels were transferred to polyvinylidene difluoride membrane using the iBIot Dry Blotting System (Life Technologies, Grand Island, NY). The membranes were blocked and probed with primary antibodies (1:1000): OXPHOS cocktail, tubulin (Abcam, Cambridge, MA). Incubation was done with appropriate secondary antibodies (1:10,000). Image analyses were performed using an Odyssey Imager (LiCor, Lincoln, NE).
Serum cytokines
Serum cytokines were determined using a cytometric bead array (IL-6, IL-10, MCP-1, IFNγ, TNFα, IL-12p70) using 25uL of serum (BD Biosciences, San Jose, CA) according to the manufacturer’s protocol without modification (http://www.bdbiosciences.com/external_files/pm/doc/manuals/live/web_enabled/23-12720-01.pdf).
Data analysis and statistics
Experiments were performed with 3 or more biologic replicates and technical replicates with representative data shown. Summary statistics were calculated for all data. Student’s t-test was used when appropriate. Metabolomics were analyzed using a volcano plot to identify significant targets. P-values less than 0.05 were considered to indicate statistical significance. Analyses were performed using Prism 5 (GraphPad Software, Ja Jolla, CA) software package and MetaboAnalyst 4.0 [14, 15]. Additional analyses of mRNA expression data is described in the Supplement.
RESULTS
Hepatic innate immune response can be seen 2 hours after injection of pI:C
The liver contains a substantial population of resident and circulating immune cells, marking it not only as a metabolic organ, but also an immune organ [16]. Previous work by our group demonstrated that the liver displays innate and antiviral immune responses upon infection with the respiratory virus, influenza A [7, 9] likely due to transient viremia [17, 18]. In order to promote this hepatic response in the absence of lung pathology and weight loss (Figure S1), mice were injected the TLR3 agonist, pI:C, or saline for 3 days. As expected, pI:C treatment not only boosted hepatic expression of its cognate receptor, TLR3 (625% increase, P < 0.05), but also antiviral genes MDA5 (51% increase, P < 0.05), and RIG-I (44% increase, P < 0.01) as determined by qPCR (Figure 1A). To profile the global hepatic response to pI:C, we analyzed mRNA using expression arrays. Two hours after the first injection, the liver displayed an mRNA signature consistent with an innate immune response including upregulation of pattern recognition receptors, interferon responses, toll-like receptor signaling and death receptor signaling (Figure 1B). Rather than relying solely on fold change and P-value to select genes of biological interest, we created a score that incorporates the fold change and P-value in addition to the characteristics of the biological network of the differentially expressed gene list. According to this score, which we refer to as the Euclidean distance (see Supplementary Methods), the top 24 genes showed that TNFα and isoforms of its downstream mediator NFkB represented 6 or the 24 targets (Table S1, Figure 1C, black arrows). Consistent with an mRNA signature suggesting hepatic TNFα production and sensing, we also observed a surge in serum TNFα (P < 0.001) (Figure 1D). Overall, our data suggest that pI:C treatment induces innate immune activation, with the production of TNFα locally and systematically with a concomitant immune response in the liver.
Figure 1: pI:C treatment leads to systemic and hepatic innate immune responses.
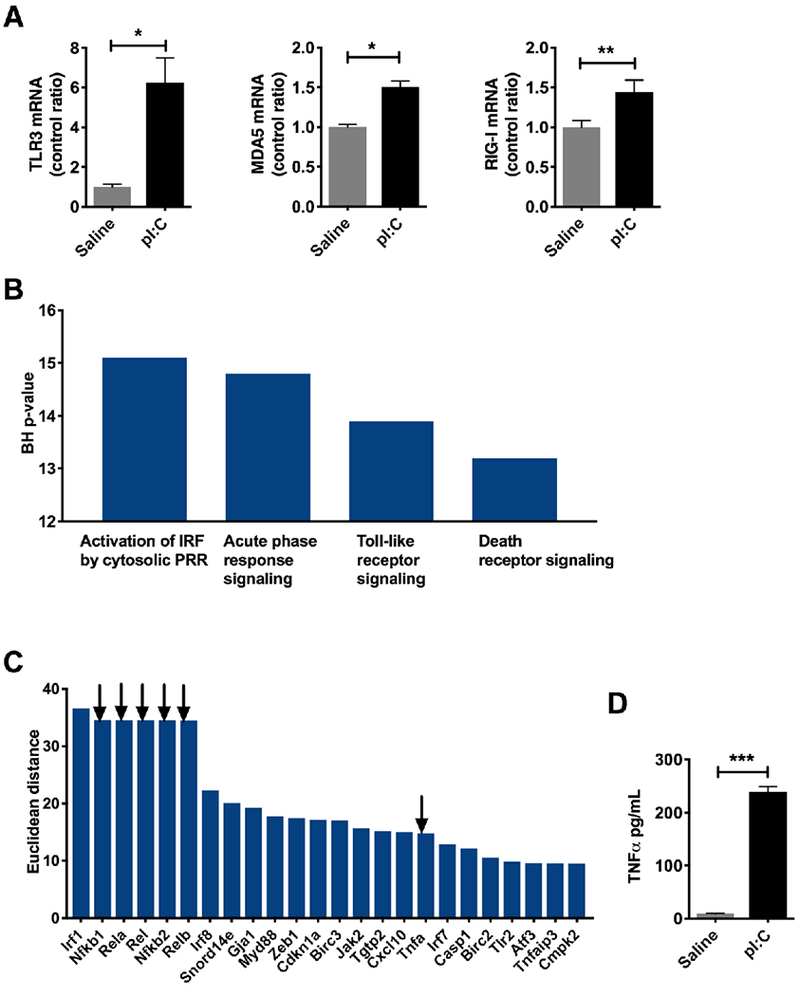
Mice were injected intraperitoneally with pI:C (100 μg) or saline once a day for three days. Liver were harvested 2 hours after the third injection and snap frozen until analysis. RNA was isolated and the hepatic transcriptional response was evaluated. A) qPCR for antiviral response TLR3, MDA5 and RIG-I (N = 3/group). B) Gene ontology terms for the hepatic transcriptional signature obtained from a mouse mRNA expression arrays (N = 5/group). C) Top 24 genes identified in mouse livers from mRNA expression arrays. Arrows indicate gene targets involved in TNFα signaling. D) Serum TNFα in mice injected with pI:C (N = 3/group). * P < 0.05, ** P < 0.01, *** P < 0.001. Error bars = standard error of the mean.
Enhanced hepatic glycolysis during injection with pI:C
Increases in body temperature reflect increased basal metabolic rate (BMR). For example, for every 1°C increase in body temperature in humans, BMR may increase 10-15% [3]. Although mice have been reported develop hypothermia during severe infection [19], pI:C treated mice had elevated body temperature approximately 2 hours after injection, which persisted for several hours during a period coinciding with low physical activity (Figure S2). This elevated body temperature which began shortly after injection with pI:C is consistent with an increase in systemic BMR suggesting that our immune stimulus promoted a change in whole body metabolism.
Up to 70% of a human’s total energy expenditure is due to organ metabolism, with the liver being one of the highest consumers [20, 21]. Given the increase in body temperature suggesting increased BMR, we hypothesized that the liver was undergoing metabolic reprogramming. In order to simulate the natural course of influenza viral infection in mice that leads to changes in liver metabolism [7, 9], mice were injected with pI:C once a day for three days. Metabolomic investigation of livers displayed an elevation in 28 metabolites and a depression in 35 metabolites by volcano plot (Figure S3). Amongst the most significantly elevated metabolites, glycogen fragments maltopentaose (FC = 2.5, P < 0.008) and maltohexaose (FC = 3.0, P < 0.003) were detected, suggesting increased glycogenolysis. Due to this mobilization of glucose stores in the liver, we decided to characterize hepatic glycolysis using 13C MR spectroscopic imaging (MRSI) [22–25]. Mice were anesthetized by isoflurane inhalation and a tail vein catheter was placed. Profiling of glycolysis by MRSI was performed following injection of hyperpolarized 1-13C-pyruvate and measurement of 1-13C lactate (via lactate dehydrogenase) and 1-13C alanine (via alanine aminotransferase). Following pI:C administration, 1-13C lactate and 1-13C alanine signals were markedly increased and principally confined to the liver rather than other abdominal organs (Figure 2A). A trend in these isotopic signals could be seen 2 hours following the first pI:C injection, however, they were fully established after 3 days of treatment (P < 0.0001) (Figure 2B). Since alanine aminotransferase is primarily expressed in hepatocytes in the liver and not non-parenchymal cells such as Kupffer cells ([26] and Figure S4), the 13C-alanine signature observed is hepatocyte-specific. Glucokinase (Gck), the key enzyme responsible for the phosphorylation of glucose in the liver, was transcriptionally upregulated at 2 hours (P < 0.05) and 3 days (P < 0.05), signifying early signals for the promotion of hepatic glycolysis following immune activation (Figure 2C, left). Phosphofructokinase (Pfk), a key regulatory enzyme in glycolysis, followed a different temporal sequence, being upregulated only at 3 days (P < 0.0001) (Figure 2C, right). Additionally, the product of GCK, glucose-6-phosphate (G-6-P), showed an upward trend, and fructose-1,6-bisphosphate, the product of PFK, was approximately 1.7× higher at 3 days (P < 0.05) (Figure 2D). Pyruvate oxidation, as measured by isotopic breath testing following the administration of 13-C pyruvate, was increased after 3 days of pI:C treatment (P < 0.01), consistent with the entry of pyruvate into the TCA cycle due to enhanced glycolysis (Figure 2E).
Figure 2: The liver develops enhanced glycolysis during simulated viral infection with pI:C.
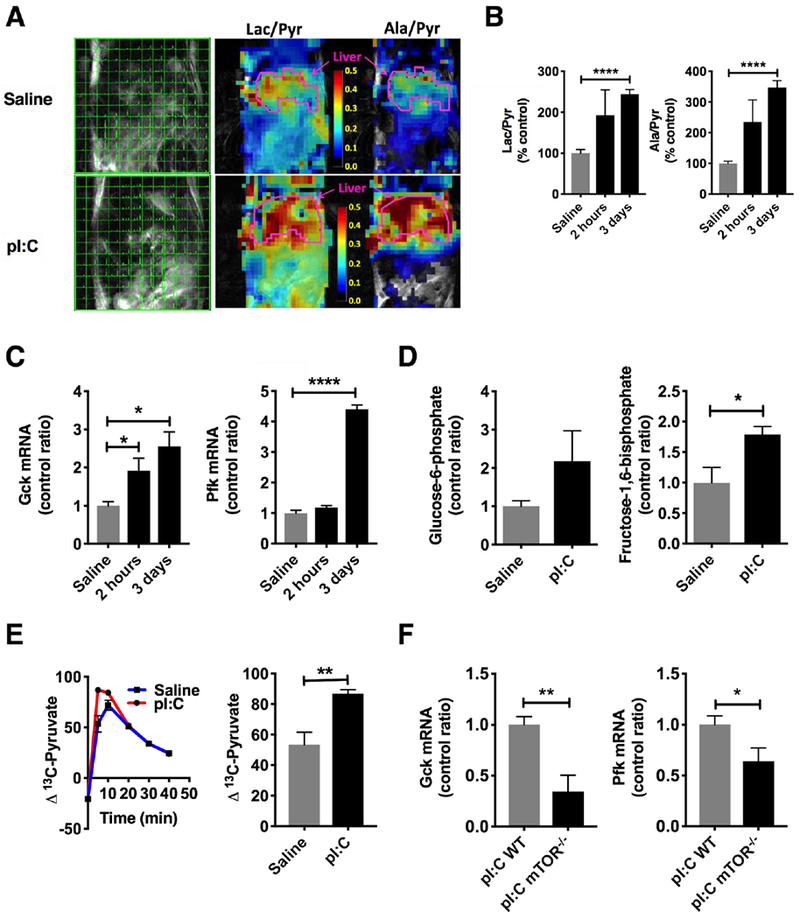
Mice were injected with pI:C or saline once a day for three days as described. A) MR spectroscopic imaging was performed shortly after administration of hyperpolarized 13C-pyruvate (left). Representative heat map of lactate/pyruvate ratios and alanine/pyruvate ratios in pI:C injected mice (right). B) Summary data of lactate/pyruvate and alanine/pyruvate ratios at 2 hours post-injection and 3 days post-injection (N = 4-6/group). C) qPCR for glycolytic targets glucokinase (Gck) and phosphofructokinase (Pfk) in the liver (N = 3-6/group). D) Hepatic glucose-6-phosphate and fructose-1,6-bisphosphate measured in liver homogenates by LC-MS/MS (N = 8/group). E) Pyruvate oxidation by isotopic breath testing (N = 8/group) following intraperitoneal injection with 13C-pyruvate. F) qPCR for glucokinase (Gck, above) and phosphofructokinase (Pfk, below) in liver mTOR−/− mice (N = 5/group). * P < 0.05, ** P < 0.01, *** P < 0.001, **** P < 0.0001. Error bars = standard error of the mean.
To confirm the contributions of the hepatic glycolytic signature, we generated a liver-specific mTOR knock out mouse using the a cre-recombinase under the control of the albumin promoter. mTOR is a major metabolic regulator that promotes the switch to glycolysis [27]. In mice deficient in hepatic mTOR, expression of Gck and Pfk was suppressed by 66% (P < 0.05) and 36% (P < 0.01), respectively, after 3 days of pI:C treatment, indicating that a significant portion of the glycolytic signature observed was arising from hepatocytes (Figure 2F), consistent with our 13C-alanine MRSI data.
Depression of mitochondrial function during pI:C treatment
To further characterize the metabotype of the hepatocytes, we next profiled mitochondrial morphology and function. Electron microscopy of the liver did not reveal any major morphologic abnormalities or inclusions in the mitochondria (Figure 3A, arrows). mtDNA content remained stable (P = 0.26) (Figure 3B). Metabolomic profiling of the tricarboxylic acid cycle (TCA) was similar between pI:C treated and control, with the exception of α-ketoglutarate (α-KG) which trended upward (97% increase, P = 0.08) (Figure S5). Based on these data, we hypothesized that the TCA cycle was undergoing anaplerosis to maintain intermediates. Indeed, we witnessed ~30% increase in hepatic glutamine (P < 0.05) and glutamate (P < 0.05), precursors to α-KG (Figure S5). Regarding OXPHOS, complex I+III enzyme activity was significantly depressed by 85% in pI:C treated mice (P < 0.05)(Figure 3C). Complex II+III and complex IV (COX) enzyme activities were normal. The suppression of complex I+III activity was accompanied by an 80% decrease in NDUFB8, a component of complex I that is sensitive to perturbations in metabolism [28] (P < 0.05) (Figure 3D). Indeed, downregulation of complex I plays an important role in metabolic reprogramming by serving as a glycolytic switch [29]. ATP content remained unchanged in liver tissue during pI:C treatment (Figure 3E). Taken as a whole, the upregulation of glycolysis, anaplerotic TCA and suppression of complex I are consistent with the adoption of Warburg-like metabolism in hepatocytes [30].
Figure 3: Depression of hepatic mitochondrial activity during simulated viral infection with pI:C.
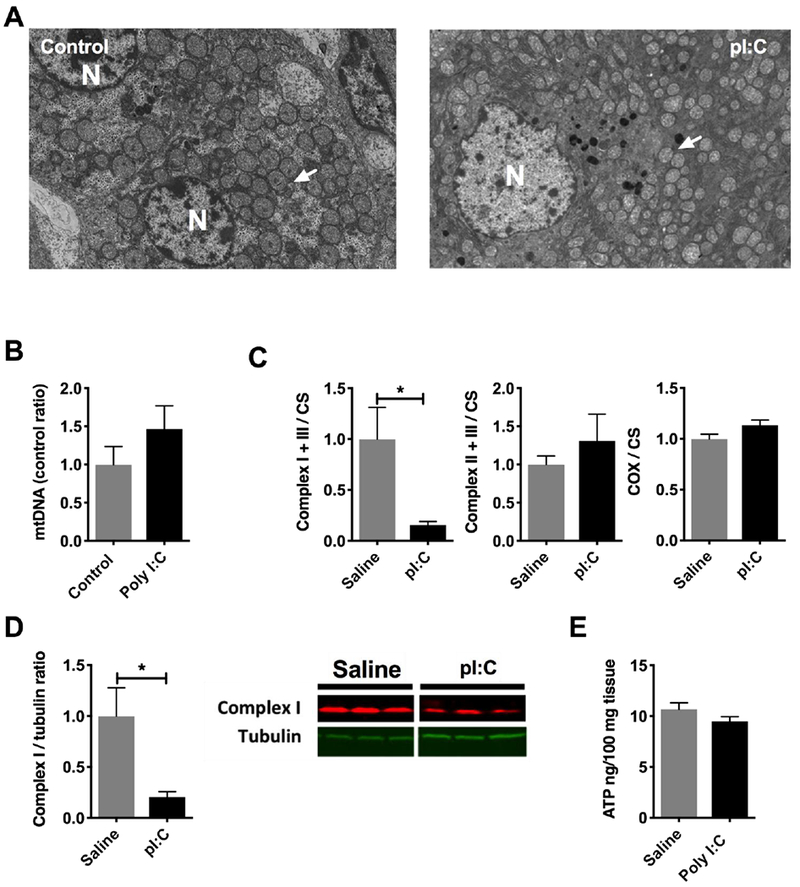
Mice were injected with pI:C or saline once a day for three days as described. Livers were harvested and analyzed by the assays indicated in each figure legend. A) Transmission electron microscopy of livers from pI:C injected animals (representative images). N = nucleus, arrows = mitochondria. B) mtDNA content in livers from pI:C injected animals by qPCR. C) Mitochondrial enzyme activity (N = 4/group) in liver homogenates from mice injected with pI:C. D) Immunoblot of hepatic complex I subunit, NDUFS8 (N=3/group), from mice injected with pI:C. E) Tissue ATP content (N = 5 / group) in livers isolated from mice injected with pI:C. * P < 0.05, ** P < 0.01, *** P < 0.001, **** P < 0.0001. Error bars = standard error of the mean.
Kupffer cells can locally promote Warburg-like metabolism in hepatocytes
Non-parenchymal liver cells may account for 20-40% of hepatic cell mass, the main components of which are immune cells [31]. As resident macrophages that play a role in the hepatic innate immune response, Kupffer cells may account for up to 20% of the non-parenchymal liver cell population. Due to our previous work on the role of Kupffer cells in suppressing FAO [9], we hypothesized that this resident macrophage population could locally promote hepatic metabolic reprogramming to Warburg-like metabolism via expression of glycolytic enzymes during pI:C treatment. To answer this question, we began by performing co-culture experiments, in which primary mouse Kupffer cells and hepatocytes were individually compartmentalized using trans-wells. While primary hepatocytes alone fail to react to pI:C for 24 hours, primary hepatocytes in co-culture with Kupffer cells and pI:C had increased expression Gck (FC = 2.9, P < 0.05), and an upward trend in Pfk (FC = 2.9, P = 0.05) (Figure 4A). Since metabolic reprogramming of hepatocytes in co-culture occurred in the absence of physical contact between Kupffer cells and hepatocytes, we explored whether changes in expression of glycolytic enzymes were due to a soluble mediator. To test this, we exposed primary hepatocytes to conditioned media from pI:C-stimulated Kupffer cells. Indeed, increasing amounts of conditioned media promoted hepatocyte upregulation of Gck (FC = 2.5, P < 0.05, at 100%) and Pfk (FC = 3.9, P < 0.01, at 100%) demonstrating the metabolic shift is due to a soluble mediator (Figure 4B). In examining the cytokine profile of the conditioned media from co-culture experiments by cytometric bead array (data not shown), we found that TNFα was significantly elevated (P < 0.01) (Figure 4C). Furthermore, we observed increased expression of TNFα mRNA in Kupffer cells ex vivo from pI:C treated mice (FC = 8.2, P < 0.05) (Figure 4D) consistent with our expression data in the liver regarding TNFα signaling (Figure 1).
Figure 4: Kupffer cells can locally promote metabolic reprogramming in hepatocytes via TNFα.
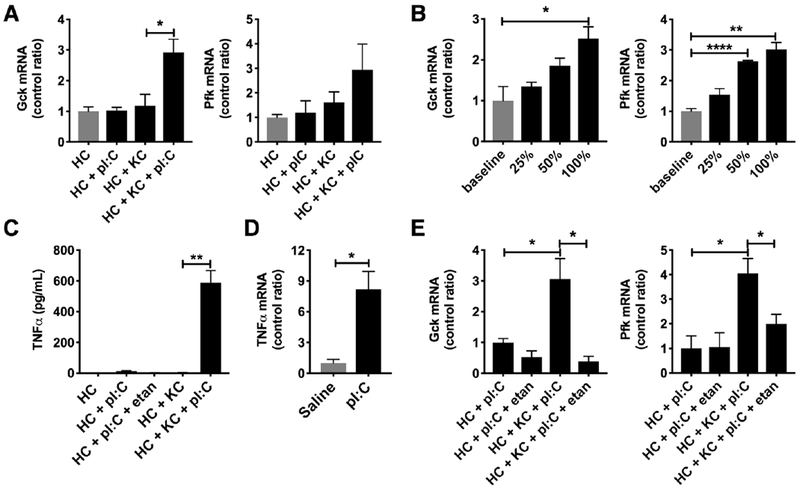
Kupffer cells and hepatocytes were isolated from mice. Kupffer cell-hepatocyte co-culture experiments with pI:C (24 hours) were performed using transwells. A) qPCR for glucokinase (Gck, left) and phosphofructokinase (Pfk, right) (N = 3/group) in primary hepatocytes following co-culture. B) qPCR for glucokinase (Gck, left) and phosphofructokinase (Pfk, right) in primary hepatocytes using conditioned media from Kupffer cells stimulated with pI:C (N = 3/group). C) TNFα production by Kupffer cells (KC) and primary hepatocytes (HC) following exposure to pI:C (N = 3/group). D) TNFα mRNA expression in ex vivo Kupffer cells isolated from pI:C treated mice (N = 3/group). E) qPCR for glucokinase (Gck, left) and phosphofructokinase (Pfk, right) in co-culture experiments during treatment with etanercept (N = 3/group). etan = etanercept. * P < 0.05, ** P < 0.01, *** P < 0.001, **** P < 0.0001. Error bars = standard error of the mean.
To examine the effects of TNFα on hepatocyte glycolysis and OXPHOS, we exposed Hep3B cells, a human hepatoma cell line, to increasing amounts of TNFα for 3 days. Glycolysis, measured by the extracellular acidification rate (ECAR), showed a dose dependent increase with TNFα treatment (P < 0.01) (Figure S6A). OXPHOS, measured by oxygen consumption rate (OCR), (P < 0.01) and ATP production via OXPHOS (P < 0.05) showed dose dependent reductions (Figures S6B and S6C). Cell viability was unaffected by TNFα treatment (data not shown). Given these data, we tested whether blocking TNFα alone in our co-culture experiments using etanercept, a TNFα antagonist, would abrogate the glycolytic mRNA signature observed in hepatocytes in response to the pI:C-stimulated condition. Blocking TNFα in the presence of pI:C resulted in a depression of Gck (88% reduction, P < 0.05) and Pfk (50% reduction, P < 0.05) mRNA expression (Figure 4E). In summary, our in vitro data suggest that Kupffer cell derived TNFα can locally promote metabolic reprogramming of hepatocytes toward a Warburg-like metabotype via modulation of expression of glycolytic enzymes Gck and Pfk.
In vivo targeting of the immune-metabolic axis disrupts metabolic reprogramming
Our in vitro studies suggested that targeting of macrophages or TNFα may be helpful in further defining the immune-metabolic axis in vivo. To answer this question, we depleted macrophages in vivo by injecting mice with liposomal clodronate prior to pI:C treatment (Figure S7). As a result of macrophage depletion, serum TNFα was reduced by 87% (P < 0.001) (Figure 5A). By MRI spectroscopic imaging, macrophage depleted mice also showed a >50% decrease in lactate/pyruvate (P < 0.01) and alanine/pyruvate (P < 0.05) signals suggesting a suppression of glycolysis (Figure 5B and 5C). This was supported by transcriptional profiling of the liver which displayed an 82% and 42% reduction in Gck (P < 0.05) and Pfk (P < 0.05) expression, respectively (Figure 5D). To target TNFα specifically, we treated mice with etanercept in vivo, a commonly used biologic for the treatment of inflammatory disease in humans and has shown efficacy in mouse models of inflammation [32]. Treatment with etanercept reduced serum TNFα by 40% (P< 0.01)(Figure 5E). Following treatment with etanercept, livers from mice injected with pI:C showed a 48% reduction in Gck mRNA (P < 0.05) and a 43% reduction in Pfk mRNA (P < 0.01) (Figure 5F). Blood glucose also trended 23% higher (P = 0.06) in etanercept treated mice, consistent with a suppression of signals promoting Warburg-like metabolism (Figure 5G).
Figure 5: In vivo targeting of the immune metabolic axis results in depressed glycolysis.
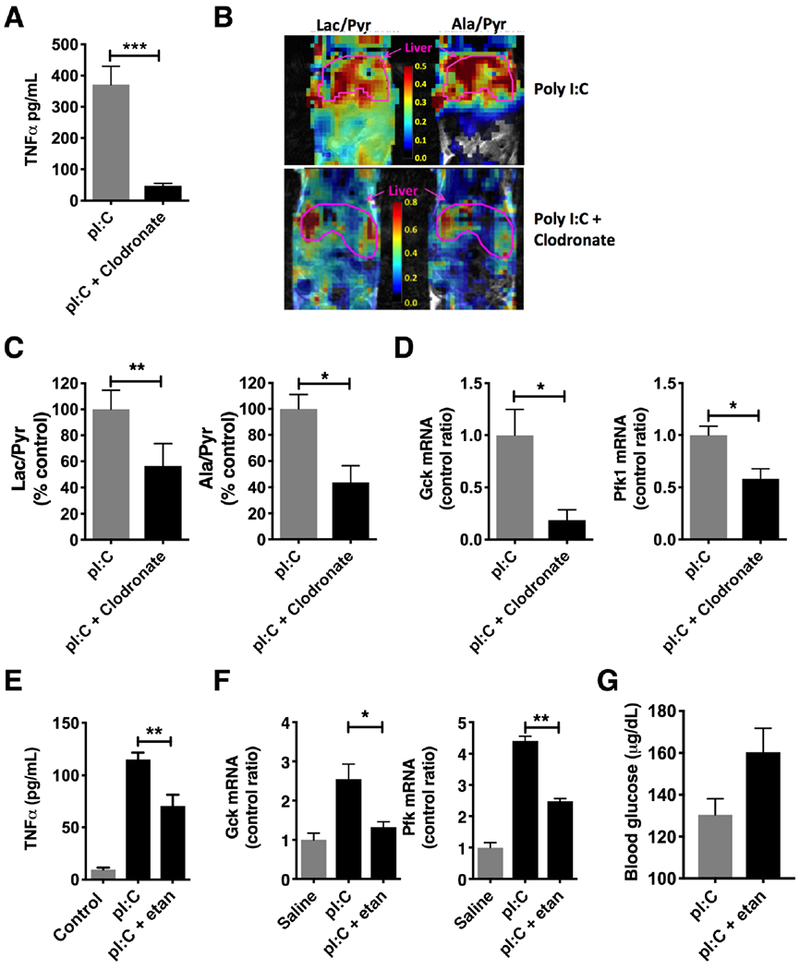
Mice injected with pI:C for 3 days were pretreated by intraperitoneal injection with liposomal clodronate or etanercept, a TNFα antagonist. A) Serum TNFα in clodronate treated mice (N = 5/group). B) MR spectroscopic map of lactate/pyruvate ratios and alanine/pyruvate ratios following injection with hyperpolarized 13C-pyruvate in clodronate treated mice. C) Summary data of lactate/pyruvate (left) and alanine/pyruvate (right) ratios following clodronate treatment in mice (N = 3-4/group). D) qPCR for glucokinase (Gck, left) and phosphofructokinase (Pfk, right) in livers from clodronate-treated mice (N = 3-4/group). E) Serum TNFα during treatment with etanercept (N = 5/group). F) qPCR for glucokinase (Gck, left) and phosphofructokinase (Pfk, right) in livers from etanercept-treated mice (N = 3/group). G) Blood glucose during etanercept treatment (N = 5 / group), etan = etanercept. * P < 0.05, ** P < 0.01, *** P < 0.001. Error bars = standard error of the mean.
Discussion
During infection, the liver is flooded with metabolic precursors mobilized from body tissues. As such, the liver must be metabolically tuned to utilize these precursors. The present study demonstrates that hepatic metabolic reprogramming is linked to pathogen recognition via the innate immune response and TNFα. This immune metabolic-axis that forms a rapid response mechanism which allows the liver to rapidly meet challenges to homeostasis imposed by infectious illnesses.
The rapid response by the innate immune system is predicated on how antigens are recognized. In contrast to the adaptive immune system, the innate immune system recognizes invading organisms by pathogen associated molecular patterns (PAMPs) rather than by a specific antigenic sequence [33]. Pattern recognition receptors (PRRs) allow innate immune cells such as macrophages to recognize PAMPs via extracellular systems such as toll-like and c-lectin type receptors, as well as intracellular systems such as NOD-like and RIG-I like receptors [34]. From an evolutionary standpoint, pathogen recognition by PRRs constitutes a simple method by which a limited number of cellular receptors can recognize a wide array of PAMPs. Consequently, unlike adaptive immune cells, innate immune cells respond within hours of pathogen exposure, rapidly providing an assortment of defenses such as the production of inflammatory cytokines [35]. As the timing of the immune response coincides with metabolic reprogramming in end-organs, circulating immune mediators are likely candidates as primary agents in this process. As reported here, treatment with pI:C results in activation of macrophages which secrete inflammatory cytokines such as TNFα. As such, TNFα not only heralds pathogen invasion, but also signals hepatocytes, as shown by mRNA expression profiling, to begin metabolic reprogramming as part of an immune-metabolic axis. In vivo disruption of that axis results in an abrogation of metabolic reprogramming, highlighting their interdependence.
Metabolic reprogramming in response to an environmental stress such as infection is termed allostasis [20]. This process involves the breakdown of macromolecular stores (e.g. glycogen), transport of circulating precursors, and changes in flux through metabolic pathways. In our model, we found an upregulation of hepatic glycolysis along with a concomitant downregulation of mitochondrial function, indicating Warburg-like metabolism. Although Warburg-like metabolism may be viewed as an inefficient energetic process, the rate of glycolysis is 10-100× faster than the complete oxidation of glucose by the mitochondria, yielding comparable amounts of ATP [36]. We witnessed this phenomena during pI:C treatment, as tissue ATP levels were unchanged. With ATP being essentially equal, the main payoff of Warburg-like metabolism lies in biosynthesis. Via the diversion of glycolytic flux to ancillary pathways, excess carbon from glucose may be used for the de novo generation of nucleotides, lipids, and proteins [37]. For example, increased glucose uptake results in production of reducing equivalents via the pentose phosphate pathway, which are then used in reductive biosynthesis, notably in de novo lipid synthesis [38]. This pathway can then lead to the production of arachidonic acid and prostaglandins, key autocrine and paracrine metabolites of the acute phase response. Based on this, one may adopt a more global view of the acute phase response beyond protein synthesis to include metabolic reprogramming.
Metabolic reprogramming in the liver can occur due to systemic or local immune signaling. Tissue-resident macrophages are a heterogeneous group of immune cells that may arise from hematopoietic or self-renewing embryo-derived populations. These embedded cell populations may be involved in homeostatic functions such as the clearance of cellular debris and immune surveillance, as well as physiologic perturbations such as responding to infection or resolving inflammation [39]. Kupffer cells, liver resident macrophages that arise from the bone marrow, play a critical role in the innate immune response. Localized in the hepatic sinusoids, these macrophages are poised to efficiently phagocytize pathogens entering from the portal or arterial circulation serving as a first line of defense against pathogens from the gastrointestinal tract [40]. While Kupffer cells are essential in the hepatic response to infection, they have also been implicated in mediating hepatic injury and repair. Although we have witnessed hepatic innate immune responses and Kupffer cell activation following immune stimulation [7, 9, 18], the influence of Kupffer cells upon hepatocyte allostasis remained underexplored. Utilizing co-culture experiments, we showed that Kupffer cells can locally promote metabolic reprogramming of hepatocytes via soluble mediators. Accordingly, our data highlights the duality of the liver as a major metabolic regulator and lymphoid organ responsible for immunosurveillance [8]. From our data it is clear that these are not independent functions.
Significant hepatotoxicity and metabolic perturbations have been described in experimental systems and clinical states where the pathophysiology is mediated by systemic cytokines [9, 41–47]. As a master regulator of inflammatory cytokine production, TNFα orchestrates the cytokine cascade in many inflammatory diseases. Because of this role, it has been proposed as a therapeutic target. While TNFα is a pleiotropic cytokine that is well recognized for its role in pathogenic states, less is known about the promotion of allostasis. Furthermore, little data exists regarding hepatic metabolic reprogramming during infection in vivo and the mechanisms involved. Previous work by our group demonstrated that TNFα promoted the downregulation of hepatic mitochondrial fatty acid oxidation during influenza infection, consistent with the adoption of the Warburg-like phenotype [9, 30]. As an extension of this work, we demonstrated herein that incubation of hepatocytes with TNFα promotes an upregulation of glycolysis, TCA anaplerosis and downregulation of OXPHOS, i.e. the Warburg-like metabotype. On the cellular level, the promotion of Warburg-like metabolism by TNFα occurs via NFkB and HIF1α signaling [48–51]. We propose that TNFα is a critical intermediary in this immune-metabolic axis involving macrophages and hepatocytes as evidenced by an abrogation of the phenotype in vivo following immunotherapy.
In addition to understanding the basic physiology of the hepatic response to infection, our work also raises concerns regarding the application of anti-cytokine biologics for the treatment of inflammatory diseases. Anti-TNFα drugs such as etanercept are used for treating select inflammatory diseases such as rheumatoid arthritis, psoriasis and inflammatory bowel disease. Not only is there an increased risk of infection associated with these treatments, but also potential perturbations in metabolic homeostasis that remain to be studied. As with many physiologic states, TNFα signaling displays varying thresholds for beneficial and deleterious effects. Outside of infection, TNFα antagonists have been associated with a spectrum of liver injury suggesting an important role for TNFα in hepatic homeostasis [52, 53]. While the mechanism regarding this hepatotoxicity is likely multifactorial, a disruption of metabolic homeostasis due to perturbations in TNFα signaling is an interesting avenue to explore.
During infection, systemic cytokines and the innate immune system facilitate hepatic metabolic reprogramming. The work presented herein emphasizes the beneficial effects of TNFα as the intermediary in this early-warning system linked to pathogen recognition. Further work regarding the role of cytokines in the modulation of end-organ metabolism will not only lead to a greater understanding of hepatic intermediary metabolism, but also perturbations in hepatic metabolic homeostasis and allostasis due to therapies employing biologics for the treatment of inflammatory disease.
Supplementary Material
Key messages.
Hepatocytes develop Warburg-like metabolism in vivo during viral infection.
Macrophage TNFα promotes expression of glycolytic enzymes in hepatocytes.
Blocking this immune-metabolic axis abrogates Warburg-like metabolism in the liver.
Implications for patients being treated for inflammatory diseases with biologics.
ACKNOWLEDGMENTS AND DISCLOSURE STATEMENT
This work was supported by the intramural research program of the National Institutes of Health (HG200381-03). The authors would like to recognize the Animal facility of the NHGRI for its help in executing this work. The authors have no conflicts of interest to declare.
Footnotes
Publisher's Disclaimer: This Author Accepted Manuscript is a PDF file of a an unedited peer-reviewed manuscript that has been accepted for publication but has not been copyedited or corrected. The official version of record that is published in the journal is kept up to date and so may therefore differ from this version.
REFERENCES
- 1.Beisel WR (1975) Metabolic response to infection. Annu Rev Med 26:9–20. DOI 10.1146/annurev.me.26.020175.000301 [DOI] [PubMed] [Google Scholar]
- 2.Bratovanov D (1970) [A new method of determining and analyzing seasonality of acute infectious diseases]. Zhurnal mikrobiologii, epidemiologii, i immunobiologii 47: 62–67 [PubMed] [Google Scholar]
- 3.Dubois EF (1937) The Mechanism of Heat Loss and Temperature Regulation Stanford University Press, Stanford, CA [Google Scholar]
- 4.He JJ, Ma J, Elsheikha HM, Song HQ, Zhou DH, Zhu XQ (2016) Proteomic Profiling of Mouse Liver following Acute Toxoplasma gondii Infection. PloS one 11: e0152022 DOI 10.1371/journal.pone.0152022 [DOI] [PMC free article] [PubMed] [Google Scholar]
- 5.Hajjou M, Norel R, Carver R, Marion P, Cullen J, Rogler LE, Rogler CE (2005) cDNA microarray analysis of HBV transgenic mouse liver identifies genes in lipid biosynthetic and growth control pathways affected by HBV. J Med Virol 77: 57–65. DOI 10.1002/jmv.20427 [DOI] [PubMed] [Google Scholar]
- 6.Tong AP, Wu LH, Lin QS, Lau QC, Zhao X, Li J, Chen P, Chen LJ, Tang H, Huang CH, et al. (2008) Proteomic analysis of cellular protein alterations using a hepatitis B virus-producing cellular model. Proteomics 8: 2012–2023. DOI 10.1002/pmic.200700849 [DOI] [PubMed] [Google Scholar]
- 7.McGuire PJ, Tarasenko TN, Wang T, Levy E, Zerfas PM, Moran T, Lee HS, Bequette BJ, Diaz GA (2014) Acute metabolic decompensation due to influenza in a mouse model of ornithine transcarbamylase deficiency. Dis Model Mech 7: 205–213. DOI 10.1242/dmm.013003 [DOI] [PMC free article] [PubMed] [Google Scholar]
- 8.Tarasenko TN, McGuire PJ (2017) The liver is a metabolic and immunologic organ: A reconsideration of metabolic decompensation due to infection in inborn errors of metabolism (IEM). Mol Genet Metab 121: 283–288. DOI 10.1016/j.ymgme.2017.06.010 [DOI] [PMC free article] [PubMed] [Google Scholar]
- 9.Tarasenko TN, Singh LN, Chatterji-Len M, Zerfas PM, Cusmano-Ozog K, McGuire PJ (2015) Kupffer cells modulate hepatic fatty acid oxidation during infection with PR8 influenza. Biochim Biophys Acta 1852: 2391–2401. DOI 10.1016/j.bbadis.2015.08.021 [DOI] [PMC free article] [PubMed] [Google Scholar]
- 10.Jensen KJ, Alpini G, Glaser S (2013) Hepatic nervous system and neurobiology of the liver. Comprehensive Physiology 3: 655–665. DOI 10.1002/cphy.c120018 [DOI] [PMC free article] [PubMed] [Google Scholar]
- 11.Smedsrod B, Pertoft H (1985) Preparation of pure hepatocytes and reticuloendothelial cells in high yield from a single rat liver by means of Percoll centrifugation and selective adherence. Journal of leukocyte biology 38: 213–230 [DOI] [PubMed] [Google Scholar]
- 12.Lute B, Jou W, Lateef DM, Goldgof M, Xiao C, Pinol RA, Kravitz AV, Miller NR, Huang YG, Girardet C, et al. (2014) Biphasic effect of melanocortin agonists on metabolic rate and body temperature. Cell Metab 20: 333–345. DOI 10.1016/j.cmet.2014.05.021 [DOI] [PMC free article] [PubMed] [Google Scholar]
- 13.Spinazzi M, Casarin A, Pertegato V, Salviati L, Angelini C (2012) Assessment of mitochondrial respiratory chain enzymatic activities on tissues and cultured cells. Nat Protoc 7: 1235–1246. DOI 10.1038/nprot.2012.058 [DOI] [PubMed] [Google Scholar]
- 14.Xia J, Wishart DS (2016) Using MetaboAnalyst 3.0 for Comprehensive Metabolomics Data Analysis. Curr Protoc Bioinformatics 55: 14 10 11–14 10 91. DOI 10.1002/cpbi.11 [DOI] [PubMed] [Google Scholar]
- 15.Chong J, Soufan O, Li C, Caraus I, Li S, Bourque G, Wishart DS, Xia J (2018) MetaboAnalyst 4.0: towards more transparent and integrative metabolomics analysis. Nucleic Acids Res. DOI 10.1093/nar/gky310 [DOI] [PMC free article] [PubMed] [Google Scholar]
- 16.Crispe IN (2009) The liver as a lymphoid organ. Annual review of immunology 27: 147–163. DOI 10.1146/annurev.immunol.021908.132629 [doi] [DOI] [PubMed] [Google Scholar]
- 17.Likos AM, Kelvin DJ, Cameron CM, Rowe T, Kuehnert MJ, Norris PJ, National Heart LBIREDS, II (2007) Influenza viremia and the potential for blood-borne transmission. Transfusion 47: 1080–1088. DOI 10.1111/j.1537-2995.2007.01264.x [DOI] [PubMed] [Google Scholar]
- 18.Tarasenko TN, Cusmano-Ozog K, McGuire PJ (2018) Tissue acylcarnitine status in a mouse model of mitochondrial beta-oxidation deficiency during metabolic decompensation due to influenza virus infection. Mol Genet Metab. DOI 10.1016/j.ymgme.2018.06.012 [DOI] [PMC free article] [PubMed] [Google Scholar]
- 19.Yang YT, Evans CA (1961) Hypothermia in Mice Due to Influenza Virus Infection. P Soc Exp Biol Med 108:776-& [DOI] [PubMed] [Google Scholar]
- 20.Ramsay DS, Woods SC (2016) Physiological Regulation: How It Really Works. Cell Metab 24: 361–364. DOI 10.1016/j.cmet.2016.08.004 [DOI] [PMC free article] [PubMed] [Google Scholar]
- 21.Durnin J (1981) Basal metabolic rate in manReport to FAO/WHO/UNU, Rome, Italy. [Google Scholar]
- 22.Scroggins BT, Matsuo M, White AO, Saito K, Munasinghe JP, Sourbier C, Yamamoto K, Diaz V, Takakusagi Y, Ichikawa K, et al. (2018) Hyperpolarized [1-(13)C]-Pyruvate Magnetic Resonance Spectroscopic Imaging of Prostate Cancer In Vivo Predicts Efficacy of Targeting the Warburg Effect. Clin Cancer Res 24: 3137–3148. DOI 10.1158/1078-0432.CCR-17-1957 [DOI] [PMC free article] [PubMed] [Google Scholar]
- 23.Gutte H, Hansen AE, Henriksen ST, Johannesen HH, Ardenkjaer-Larsen J, Vignaud A, Hansen AE, Borresen B, Klausen TL, Wittekind AM, et al. (2015) Simultaneous hyperpolarized (13)C-pyruvate MRI and (18)F-FDG-PET in cancer (hyperPET): feasibility of a new imaging concept using a clinical PET/MRI scanner. Am J Nucl Med Mol Imaging 5: 38–45 [PMC free article] [PubMed] [Google Scholar]
- 24.Gutte H, Hansen AE, Johannesen HH, Clemmensen AE, Ardenkjaer-Larsen JH, Nielsen CH, Kjaer A (2015) The use of dynamic nuclear polarization (13)C-pyruvate MRS in cancer. Am J Nucl Med Mol Imaging 5: 548–560 [PMC free article] [PubMed] [Google Scholar]
- 25.Chen Y, Kim H, Bok R, Sukumar S, Mu X, Sheldon RA, Barkovich AJ, Ferriero DM, Xu D (2016) Pyruvate to Lactate Metabolic Changes during Neurodevelopment Measured Dynamically Using Hyperpolarized 13C Imaging in Juvenile Murine Brain. Dev Neurosci 38: 34–40. DOI 10.1159/000439271 [DOI] [PMC free article] [PubMed] [Google Scholar]
- 26.Ding C, Li Y, Guo F, Jiang Y, Ying W, Li D, Yang D, Xia X, Liu W, Zhao Y, et al. (2016) A Cell-type-resolved Liver Proteome. Mol Cell Proteomics 15: 3190–3202. DOI 10.1074/mcp.M116.060145 [DOI] [PMC free article] [PubMed] [Google Scholar]
- 27.Rui L (2014) Energy metabolism in the liver. Comprehensive Physiology 4: 177–197. DOI 10.1002/cphy.c130024 [DOI] [PMC free article] [PubMed] [Google Scholar]
- 28.Francis BM, Yang J, Song BJ, Gupta S, Maj M, Bazinet RP, Robinson B, Mount HT (2014) Reduced levels of mitochondrial complex I subunit NDUFB8 and linked complex I + III oxidoreductase activity in the TgCRND8 mouse model of Alzheimer’s disease. J Alzheimers Dis 39: 347–355. DOI 10.3233/JAD-131499 [DOI] [PubMed] [Google Scholar]
- 29.Rafikov R, Sun X, Rafikova O, Meadows ML, Desai AA, Khalpey Z, Yuan JX, Fineman JR, Black SM (2015) Complex I dysfunction underlies the glycolytic switch in pulmonary hypertensive smooth muscle cells. Redox Biol 6: 278–286. DOI 10.1016/j.redox.2015.07.016 [DOI] [PMC free article] [PubMed] [Google Scholar]
- 30.Escoll P, Buchrieser C (2018) Metabolic reprogramming of host cells upon bacterial infection: Why shift to a Warburg-like metabolism? Febs Journal 285: 2146–2160. DOI 10.1111/febs.14446 [DOI] [PubMed] [Google Scholar]
- 31.Racanelli V, Rehermann B (2006) The liver as an immunological organ. Hepatology 43: S54–62. DOI 10.1002/hep.21060 [DOI] [PubMed] [Google Scholar]
- 32.Ye J, Jiang R, Cui M, Zhu B, Sun L, Wang Y, Zohaib A, Dong Q, Ruan X, Song Y, et al. (2014) Etanercept reduces neuroinflammation and lethality in mouse model of Japanese encephalitis. J Infect Dis 210: 875–889. DOI 10.1093/infdis/jiu179 [DOI] [PubMed] [Google Scholar]
- 33.Medzhitov R, Janeway C Jr, (2000) Innate immunity. N Engl J Med 343: 338–344. DOI 10.1056/NEJM200008033430506 [DOI] [PubMed] [Google Scholar]
- 34.Takeuchi O, Akira S (2010) Pattern recognition receptors and inflammation. Cell 140: 805–820. DOI 10.1016/j.cell.2010.01.022 [DOI] [PubMed] [Google Scholar]
- 35.Medzhitov R, Janeway CA Jr, (1997) Innate immunity: the virtues of a nonclonal system of recognition. Cell 91: 295–298 [DOI] [PubMed] [Google Scholar]
- 36.Shestov AA, Liu XJ, Ser Z, Cluntun AA, Hung YP, Huang L, Kim D, Le A, Yellen G, Albeck JG, et al. (2014) Quantitative determinants of aerobic glycolysis identify flux through the enzyme GAPDH as a limiting step. Elife 3 10.7554/eLife.03342 [DOI] [PMC free article] [PubMed] [Google Scholar]
- 37.Liberti MV, Locasale JW (2016) The Warburg Effect: How Does it Benefit Cancer Cells? Trends Biochem Sci 41: 211–218. DOI 10.1016/j.tibs.2015.12.001 [DOI] [PMC free article] [PubMed] [Google Scholar]
- 38.Vander Heiden MG, Cantley LC, Thompson CB (2009) Understanding the Warburg effect: the metabolic requirements of cell proliferation. Science 324: 1029–1033. DOI 10.1126/science.1160809 [DOI] [PMC free article] [PubMed] [Google Scholar]
- 39.Davies LC, Jenkins SJ, Allen JE, Taylor PR (2013) Tissue-resident macrophages. Nature immunology 14: 986–995. DOI 10.1038/ni.2705 [DOI] [PMC free article] [PubMed] [Google Scholar]
- 40.Dixon LJ, Barnes M, Tang H, Pritchard MT, Nagy LE (2013) Kupffer cells in the liver. Comprehensive Physiology 3: 785–797. DOI 10.1002/cphy.c120026 [DOI] [PMC free article] [PubMed] [Google Scholar]
- 41.Prommer E (2007) Prostate cancer and liver dysfunction: a case of cytokine dysregulation. J Pain Symptom Manage 34: 225–226. 10.1016/j.jpainsymman.2007.05.003 [DOI] [PubMed] [Google Scholar]
- 42.Lawlor DK, Brock RW, Harris KA, Potter RF (1999) Cytokines contribute to early hepatic parenchymal injury and microvascular dysfunction after bilateral hindlimb ischemia. J Vasc Surg 30: 533–541. DOI S0741521499002931 [pii] [DOI] [PubMed] [Google Scholar]
- 43.Dhainaut JF, Marin N, Mignon A, Vinsonneau C (2001) Hepatic response to sepsis: interaction between coagulation and inflammatory processes. Critical care medicine 29: S42–47 [DOI] [PubMed] [Google Scholar]
- 44.Possamai LA, Antoniades CG, Anstee QM, Quaglia A, Vergani D, Thursz M, Wendon J (2010) Role of monocytes and macrophages in experimental and human acute liver failure. World J Gastroenterol 16: 1811–1819 [DOI] [PMC free article] [PubMed] [Google Scholar]
- 45.Jayaraman A, Yarmush ML, Roth CM (2005) Evaluation of an in vitro model of hepatic inflammatory response by gene expression profiling. Tissue Eng 11: 50–63. DOI 10.1089/ten.2005.11.50 [DOI] [PubMed] [Google Scholar]
- 46.Kang YH, Berthiaume F, Yarmush ML (2002) Long-term stable cultures of rat hepatocytes: an in vitro model to study acute and chronic hepatic inflammation. Tissue Eng 8:681–693. DOI 10.1089/107632702760240599 [DOI] [PubMed] [Google Scholar]
- 47.Kalliolias GD, Ivashkiv LB (2016) TNF biology, pathogenic mechanisms and emerging therapeutic strategies. Nat Rev Rheumatol 12: 49–62. DOI 10.1038/nrrheum.2015.169 [DOI] [PMC free article] [PubMed] [Google Scholar]
- 48.Vaughan RA, Garcia-Smith R, Trujillo KA, Bisoffi M (2013) Tumor necrosis factor alpha increases aerobic glycolysis and reduces oxidative metabolism in prostate epithelial cells. Prostate 73: 1538–1546. DOI 10.1002/pros.22703 [DOI] [PubMed] [Google Scholar]
- 49.Remels AHV, Gosker HR, Verhees KJP, Langen RCJ, Schols AMWJ (2015) TNF-alpha-Induced NF-kappa B Activation Stimulates Skeletal Muscle Glycolytic Metabolism Through Activation of HIF-1 alpha. Endocrinology 156: 1770–1781. DOI 10.1210/en.2014-1591 [DOI] [PubMed] [Google Scholar]
- 50.Vaughan RA, Garcia-Smith R, Dorsey J, Griffith JK, Bisoffi M, Trujillo KA (2013) Tumor necrosis factor alpha induces Warburg-like metabolism and is reversed by anti-inflammatory curcumin in breast epithelial cells. Int J Cancer 133: 2504–2510. DOI 10.1002/ijc.28264 [DOI] [PubMed] [Google Scholar]
- 51.Regueira T, Lepper PM, Brandt S, Ochs M, Vuda M, Takala J, Jakob SM, Djafarzadeh S (2009) Hypoxia inducible factor-1 alpha induction by tumour necrosis factor-alpha, but not by toll-like receptor agonists, modulates cellular respiration in cultured human hepatocytes. Liver International 29: 1582–1592. DOI 10.1111/j.1478-3231.2009.02109.x [DOI] [PubMed] [Google Scholar]
- 52.Ghabril M, Bonkovsky HL, Kum C, Davern T, Hayashi PH, Kleiner DE, Serrano J, Rochon J, Fontana RJ, Bonacini M, et al. (2013) Liver injury from tumor necrosis factor-alpha antagonists: analysis of thirty-four cases. Clin Gastroenterol Hepatol 11: 558–564 e553 DOI 10.1016/j.cgh.2012.12.025 [DOI] [PMC free article] [PubMed] [Google Scholar]
- 53.Bjornsson ES, Gunnarsson BI, Grondal G, Jonasson JG, Einarsdottir R, Ludviksson BR, Gudbjomsson B, Olafsson S (2015) Risk of drug-induced liver injury from tumor necrosis factor antagonists. Clin Gastroenterol Hepatol 13: 602–608. DOI 10.1016/j.cgh.2014.07.062 [DOI] [PubMed] [Google Scholar]
Associated Data
This section collects any data citations, data availability statements, or supplementary materials included in this article.