Abstract
Branched-chain amino acid (BCAA; valine, leucine, and isoleucine) supplementation is often beneficial to energy expenditure; however, paradoxically increased circulating BCAA levels are linked to obesity and diabetes. The mechanisms of the paradox remain elusive. Here we report that, upon cold exposure, brown adipose tissue (BAT) actively utilizes BCAA in the mitochondria for thermogenesis and promotes systemic BCAA clearance in mice and humans. In turn, a BAT-specific defect in BCAA catabolism attenuates systemic BCAA clearance, BAT fuel oxidation, and thermogenesis, leading to diet-induced obesity and glucose intolerance. Mechanistically, active BCAA catabolism in BAT is mediated by SLC25A44, a previously uncharacterized mitochondrial transporter for BCAA. The present study suggests that BAT serves as a significant metabolic-filter that controls BCAA clearance via SLC25A44, thereby contributing to the improvement of metabolic health.
Keywords: Brown adipose tissue, Thermogenesis, Branched-chain amino acids, mitochondrial transporter, SLC25A44
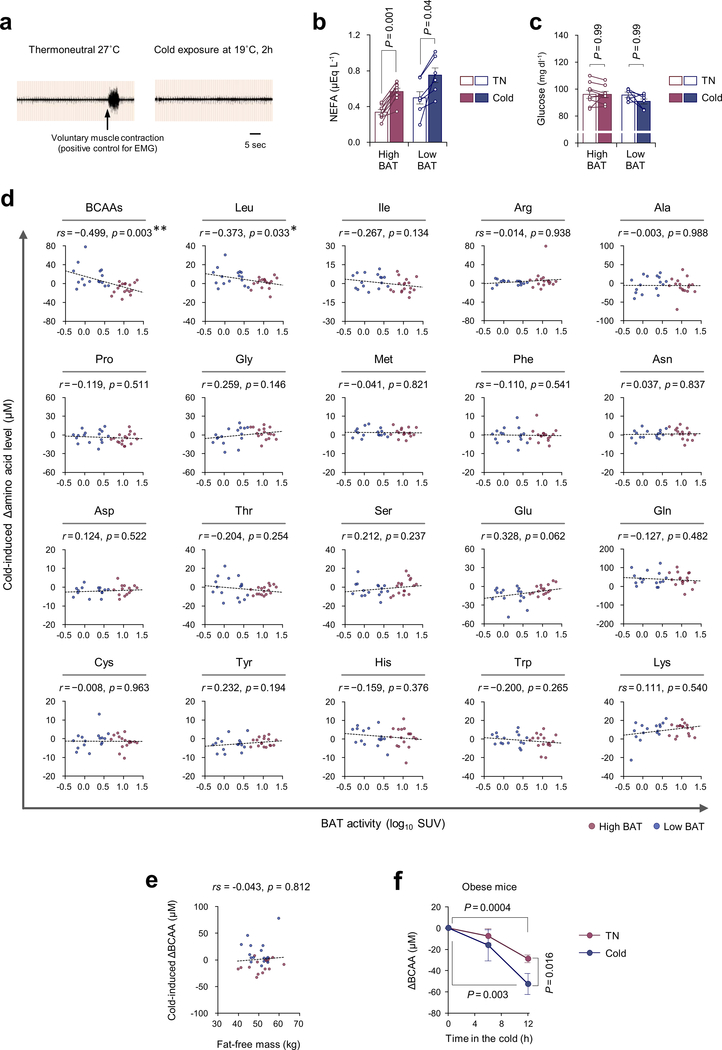
Besides its well-known function as a thermogenic organ, studies by positron emission tomography-computed tomography (PET/CT) with 18F-fluorodeoxyglucose (18FDG) and fatty acid tracers demonstrate that BAT serves as a metabolic-sink for glucose and fatty acids1–3. Such a function is tightly coupled with its ability to improve metabolic health: cold acclimation stimulates uptake of glucose but also triglyceride-rich lipoproteins and fatty acids in BAT, thereby contributing to an improvement in systemic lipid metabolism4,5. It remains unknown, however, whether BAT contributes to the clearance of any other metabolites, and how such processes are regulated. Accordingly, we performed an unbiased metabolite analysis on the sera from healthy human subjects (male, age 23.4 ± 0.6 years old, n =33) with high BAT activity (SUV > 4.03, n = 17) and low BAT activity (SUV ≦ 4.03, n = 16) at 27°C (thermoneutral, TN) and following cold exposure (19°C) for 2 hours (Supplementary Table1). Subjects with SUV > 4.03 were considered as the high BAT group, based on the median of the subjects in the study (Fig.1a). The rationale of 19°C as a cold stimulus was based on the result that BAT thermogenesis is stimulated at 19°C in adults without triggering skeletal muscle shivering (Extended Data Fig.1a). Cold exposure stimulated lipolysis in adipose tissue, leading to a significant increase in circulating non-esterified fatty acids (NEFA) levels in both groups, whereas cold exposure did not change blood glucose levels (Extended Data Fig.1b,c).
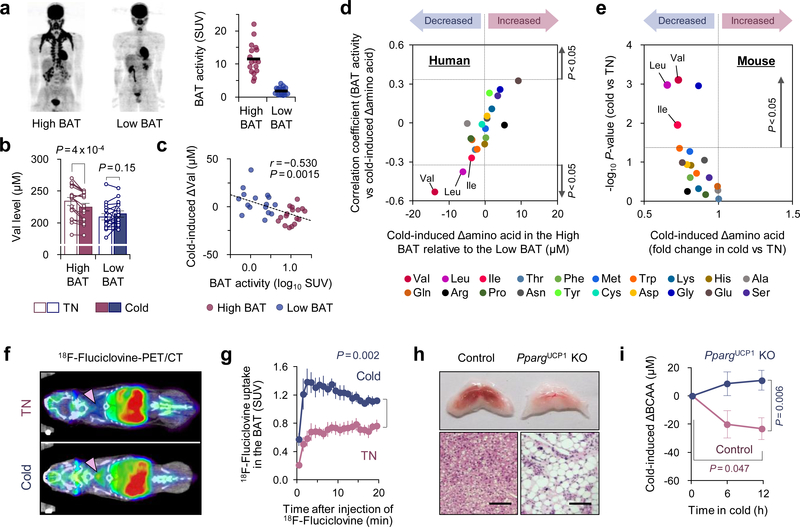
Figure 1. Cold-induced BAT thermogenesis promotes systemic BCAA clearance in mice and humans.
a. 18F-FDG-PET/CT images of subjects following cold exposure. Right graph: quantitative standardized uptake values (SUV) of 18F-FDG in the BAT deposits. n = 17 (High BAT), n = 16 (Low BAT).
b. Circulating Val concentration in (a) at 27°C (TN) and at 19°C (cold).
c. Correlation between BAT activity and cold-induced changes in serum Val concentration in (a).
d. Correlation coefficient between cold-induced amino acid changes and BAT activity (y-axis) against the degree of BAT-dependent amino acid changes (x-axis) in (a).
e. Cold-induced changes in plasma amino acids in diet-induced obese mice at 30°C (TN, n = 5) or 15°C (cold, n = 6).
f. 18F-Fluciclovine-PET/CT images of mice acclimated to 30°C (TN) or 15°C (cold) for 2 weeks. Arrows indicate interscapular BAT.
g. SUV of 18F-fluciclovine in BAT. n = 5/group.
h. Morphology and H&E staining of interscapular BAT of PpargUCP1 KO and controls. Scale bar: 50 μm. Representative result from two independent experiments
i. Plasma BCAA levels in (h) during cold temperature at 12°C. n = 7/group.
a-i, biologically independent samples. Mean ± s.e.m.; two-sided P-values by paired t-test (b), unpaired Student’s t-test (e), or two-way repeated measures ANOVA (g) followed by post-hoc paired/unpaired t-tests with Bonferroni’s correction (i). Pearson’s or Spearman’s rank correlation coefficient was calculated, as appropriate (c,d).
Cold-activated BAT promotes systemic BCAA clearance
Unexpectedly, we found that serum concentration of valine (Val) was significantly reduced, preferentially in high BAT subjects following cold exposure, whereas no statistical change was seen in low BAT subjects (Fig.1b). The cold-induced reduction in serum Val levels showed a significant inverse correlation with BAT activity (SUV) by 18F-FDG-PET imaging (Fig.1c). Similarly, cold-induced changes in leucine (Leu) and total BCAA levels were inversely correlated with SUV, whereas no amino acids except Val and Leu showed a significant correlation (Fig.1d, Extended Data Fig.1d, Supplementary Table2). While skeletal muscle is a major organ that utilizes BCAA, muscle mass showed no correlation with cold-induced changes in BCAA levels (Extended Data Fig.1e). Consistent with the human study, plasma metabolomics in obese mice found that cold exposure significantly reduced plasma Val, Leu, and Ile levels (Fig.1e, Extended Data Fig.1f).
These observations caught our attention because epidemiological studies demonstrate that increased circulating BCAA levels are strongly associated with obesity, insulin resistance, and type 2 diabetes in humans and rodents6–8, despite the fact that BCAA supplementation in healthy subjects is often associated with beneficial effects on muscle growth and energy expenditure9. Adipose tissue appears to contribute to the regulation of circulating BCAA levels as previous studies show that expression or activity of mitochondrial BCAA enzymes in the white adipose tissue (WAT), such as the branched-chain α-keto acid dehydrogenase (BCKDH) complex, are reduced under obese and diabetic states10–13, and that transplantation of WAT from wild-type mice into branched chain aminotransferase (BCAT2) deficient mice reduces circulating BCAA levels13. The extent to which cold acclimation controls systemic BCAA homeostasis via BAT remains unknown.
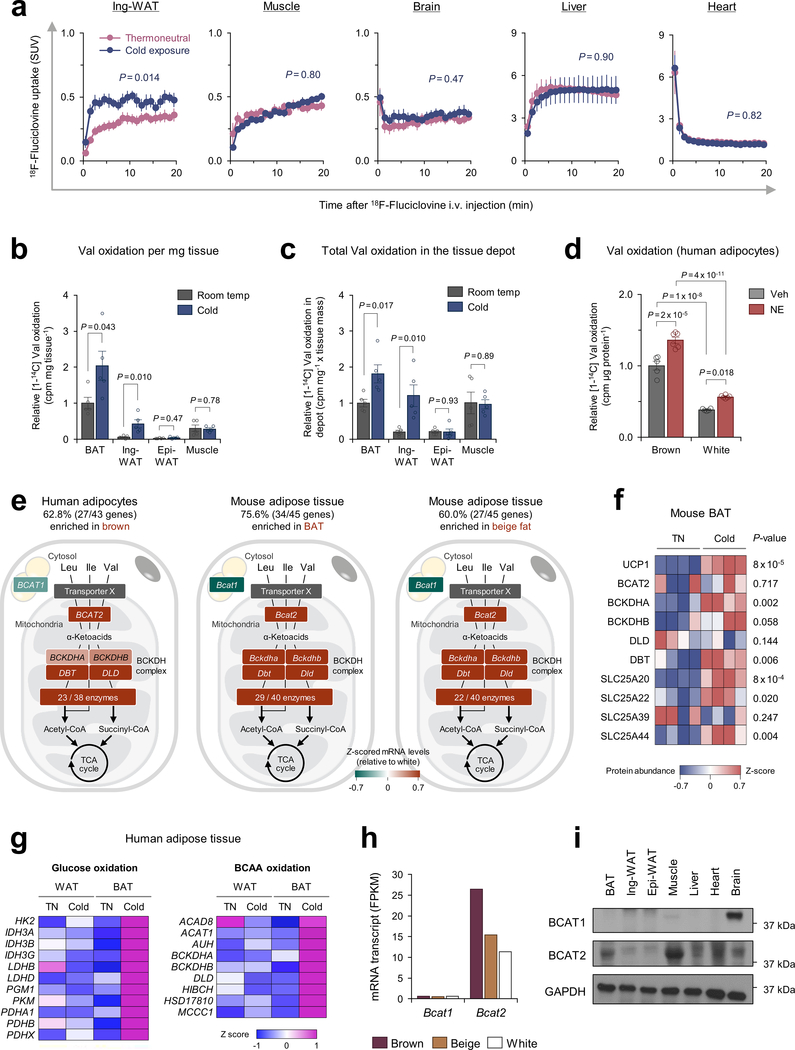
Thus, we next employed a PET/CT scan with 18F-fluciclovine, a Leu analog tracer, to visualize Leu uptake in BAT. Following cold acclimation, 18F-fluciclovine-PET/CT detected a robust increase in 18F-fluciclovine uptake in the BAT and a modest increase in the inguinal WAT of mice (Fig.1f,g). While the basal SUV in the liver and heart was higher than BAT, no significant change was seen in these organs following cold exposure (Extended Data Fig.2a). Upon cold exposure, we found along with a recent study14 that BAT displayed the highest Val oxidation relative to other metabolic organs, including inguinal WAT, epididymal WAT, and gastrocnemius muscle of mice (Extended Data Fig.2b,c). Furthermore, Val oxidation in differentiated human brown adipocytes was significantly higher than white adipocytes and further enhanced by norepinephrine (NE) (Extended Data Fig.2d). Of note, transcriptomics and proteomics data in mice and humans15–17 showed that over 60 % of the BCAA catabolic enzymes, including the rate-limiting enzymes BCAT2, were highly enriched in brown adipocytes relative to white adipocytes (Extended Data Fig.2e,f). Our previous analysis5 also found that the BCAA catabolic pathway was highly induced by cold exposure selectively in the supraclavicular BAT but not in the abdominal WAT (Extended Data Fig.2g). It is worth noting that BCAAs are oxidized within the mitochondria of BAT because brown fat predominantly expresses the mitochondria-localized form BCAT2, but not the cytosolic isoform (BCAT1) (Extended Data Fig.2h,i). Despite this knowledge, the mitochondrial transporter for BCAAs is unidentified, and as such, it remains unknown how BCAAs are utilized in brown adipocytes.
To determine if BAT contributes to systemic BCAA clearance, we generated a BAT-ablation mouse model in which Peroxisome proliferator-activated receptor-γ (PPARγ) was deleted in uncoupling protein1 (UCP1)-expressing thermogenic adipocytes (PpargUcp1 KO, Ucp1-Cre;Ppargflox/flox). In contrast to littermate controls (Ppargflox/flox), the presumptive BAT in PpargUcp1 KO mice was primarily composed of unilocular adipocytes and fibrotic tissues (Fig.1h). Following cold exposure, plasma BCAA concentration in control mice was significantly reduced, whereas such a decrease was not seen PpargUcp1 KO mice (Fig.1i).
A BAT-specific defect in BCAA catabolism impairs energy metabolism
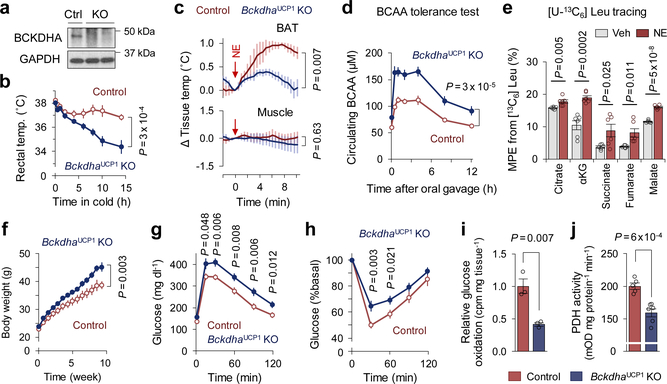
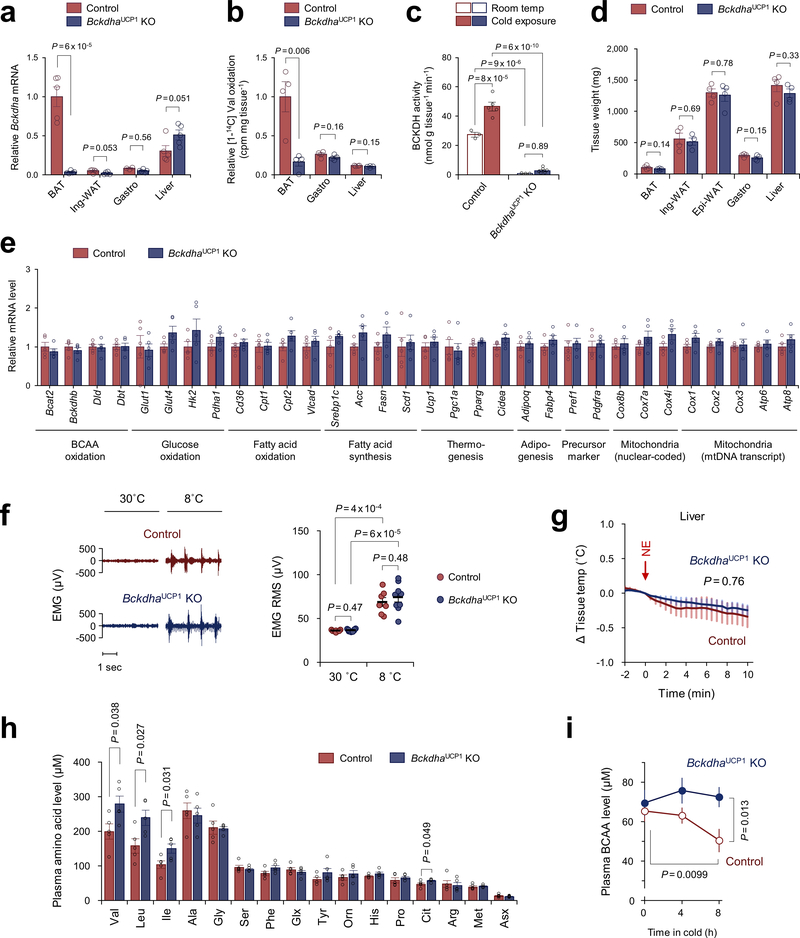
To examine the extent to which BCAA catabolism in BAT controls energy homeostasis, we next generated a mouse model in which BCAA oxidation is impaired specifically in the BAT (BckdhaUCP1 KO mice, Ucp1-Cre;Bckdhaflox/flox) (Fig.2a, Extended Data Fig.3a–c). While no difference was seen in the BAT mass and thermogenic gene expression between the genotypes on a regular diet (Extended Data Fig.3d,e), the core-body temperature of BckdhaUCP1 KO mice was significantly lower than controls after cold exposure without affecting muscle shivering (Fig.2b, Extended Data Fig.3f). Tissue-temperature recording also detected impaired thermogenesis in the BAT of BckdhaUCP1 KO mice following NE treatment, whereas no change was seen in muscle and liver temperature (Fig.2c, Extended Data Fig.3g). Importantly, BckdhaUCP1 KO mice were intolerant to oral BCAA challenge relative to control mice (Fig.2d, Extended Data Fig.3h). Similarly, BckdhaUCP1 KO mice displayed higher plasma BCAA levels than controls following cold exposure (Extended Data Fig.3i). These results indicate that BCAA oxidation is required for BAT thermogenesis and systemic BCAA clearance.
Figure 2. BCAA oxidation in BAT is required for BCAA clearance and energy homeostasis.
a. Immunoblotting of BCKDHA in BAT of BckdhaUCP1 KO and controls. GAPDH as a loading control. Representative result from two independent experiments. Gel source data are in Supplementary Figure 1.
b. Rectal core-body temperature following cold exposure at 8°C. n = 8 (control), n = 9 (BckdhaUCP1 KO).
c. Tissue temperature in BAT and muscle following NE treatment. n = 4/group.
d. Plasma BCAA levels at indicated time points after a BCAA oral gavage at 12°C. n = 8/group.
e. MPE of indicated metabolites derived from [U-13C6] Leu in human brown adipocytes. Cells were treated with vehicle or NE for one hour. n = 6/group.
f. Body weight of BckdhaUCP1 KO (n = 15) and controls (n = 13) on HFD at ambient temperature.
g. Glucose tolerance test in (f).
h. insulin tolerance test in (f).
i. Glucose oxidation in BAT normalized by tissue mass. n = 3/group.
j. PDH activity in BAT of mice at 12°C for one week. n = 5 (control), n = 6 (BckdhaUCP1 KO).
b-j, biologically independent samples. Mean ± s.e.m.; two-sided P-values by unpaired Student’s t-test (e,i,j) or two-way repeated measures ANOVA (b-d,f) followed by post-hoc unpaired t-test (g,h).
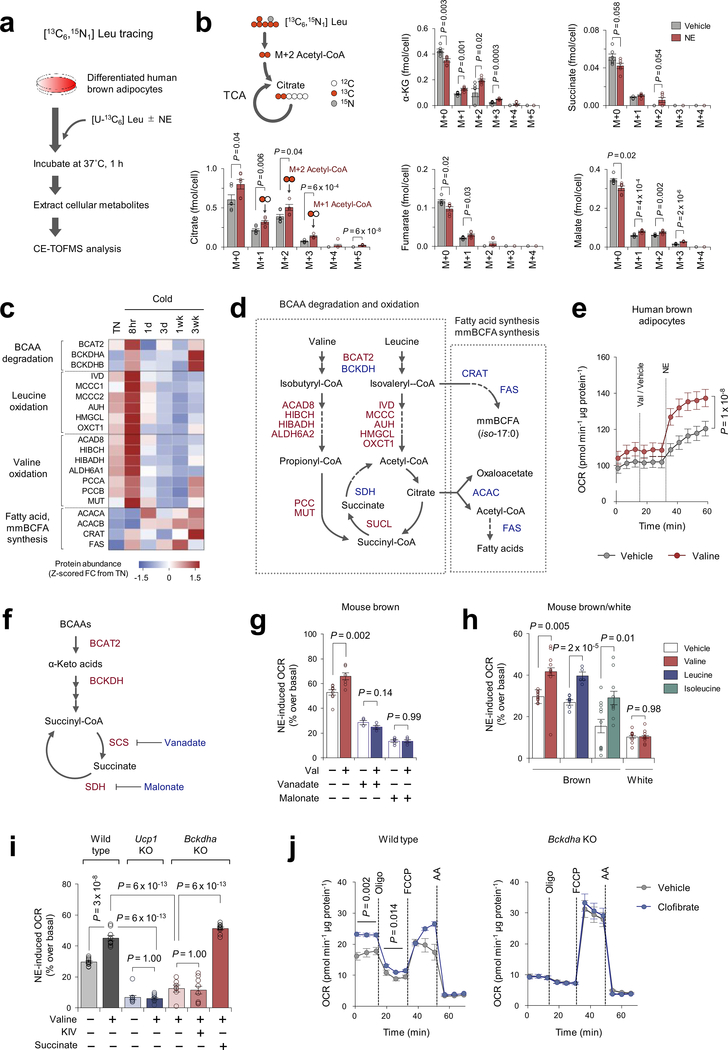
To examine how a cold stimulus alters BCAA utilization in brown fat, we next employed capillary electrophoresis time-of-flight mass spectrometry (CE-TOFMS) and performed Leu stable isotope tracing in differentiated human brown adipocytes. The mole percent enrichment (MPE) of TCA cycle intermediates derived from [U-13C6] Leu was quantified following NE treatment for one hour (Extended Data Fig.4a, Supplementary Table3). We found that acute NE treatment significantly increased MPE of TCA intermediates, including succinate (Fig.2e, Extended Data Fig.4b) although the fraction contribution of labeled Leu to the TCA cycle was relatively small. This rapid NE-stimulated BCAA oxidation is aligned with increased protein expression of many BCAA oxidation enzymes in the BAT mitochondria within 8 hours after cold exposure (Extended Data Fig.4c,d), and also the report that BCAA is rapidly oxidized in BAT14. Of note, Val supplementation rapidly increased oxygen consumption rate (OCR) in human brown adipocytes when stimulated with NE (Extended Data Fig.4e). The stimulatory effect requires the generation of a TCA cycle intermediate succinate: inhibition of succinyl coenzyme A synthetase (SCS) or succinate dehydrogenase (SDH) by vanadate or malonate, respectively, blunted the Val effect on OCR (Extended Data Fig.4f,g). We also found that supplementation of Val, Leu, or Ile significantly enhanced NE-stimulated thermogenesis in brown adipocytes in a UCP1-dependent fashion (Extended Data Fig.4h,i). BCAA supplementation or pharmacological BCAT2 activation significantly increased brown fat respiration in a BCKDHA-dependent manner, while the reduced respiration in Bckdha-deficient cells was not due to a general mitochondrial defect because succinate supplementation, but not α-ketoisovalerate (KIV), restored NE-stimulated thermogenesis in Bckdha-deficient brown adipocytes (Extended Data Fig.4i,j). Previous studies report that BCAA catabolism fuels de novo lipogenesis by generating monomethyl branched-chain fatty acids (mmBCFAs), and mmBCFA synthesis in BAT is activated after one-month-cold acclimation18,19. Consistent with the studies, proteomics data found that the expression of mmBCFA synthesis enzymes, including carnitine acetyltransferase (CrAT), are increased after 3-week-cold acclimation, while many BCAA oxidative enzymes in the mitochondria are rapidly induced within 8 hours of cold exposure and subsequently down-regulated (Extended Data Fig.4c,d). The data suggest a dynamic shift in BCAA utilization during cold accumulation in BAT, i.e., acute cold exposure activates BCAA oxidation in the TCA cycle, whereas chronic cold gradually promotes mmBCFA synthesis.
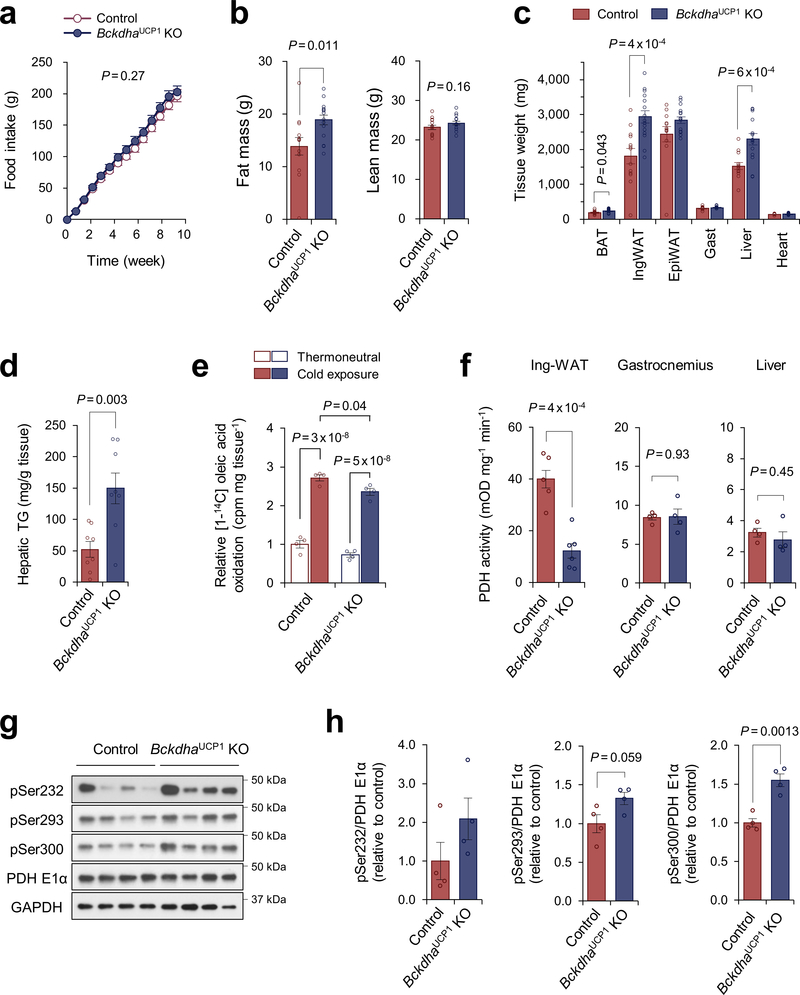
Next, we asked the degree to which a BAT-specific defect in BCAA catabolism influences whole-body metabolism. On a high-fat diet, BckdhaUCP1 KO mice gained significantly more body-weight than littermate controls due to increased adipose tissue and liver mass, but not to changes in lean mass or food intake (Fig.2f, Extended Data Fig.5a–c). Consistent with the previous studies that BAT thermogenesis controls hepatic triglyceride clearance4,20, the liver of BckdhaUCP1 contained significantly higher levels of triglycerides than that of controls (Extended Data Fig.5d). Importantly, BckdhaUCP1 KO mice exhibited systemic glucose intolerance and insulin resistance relative to controls (Fig.2g,h). Furthermore, glucose oxidation in the BAT of BckdhaUCP1 KO was significantly reduced relative to controls (Fig.2i). Fatty acid oxidation in the BAT of BckdhaUCP1 KO was modestly reduced relative to controls (Extended Data Fig.5e). The impaired glucose oxidation in BckdhaUCP1 KO mice was associated with reduced pyruvate dehydrogenase (PDH) activity in the BAT and inguinal WAT, and also with increased phosphorylation of the E1 subunit of PDH at S300 and S293 to a lesser degree (Fig.2j, Extended Data Fig.5f–h).
SLC25A44 mediates mitochondrial BCAA transport
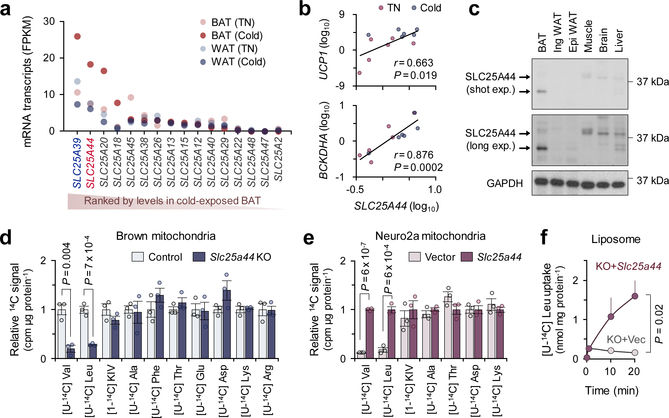
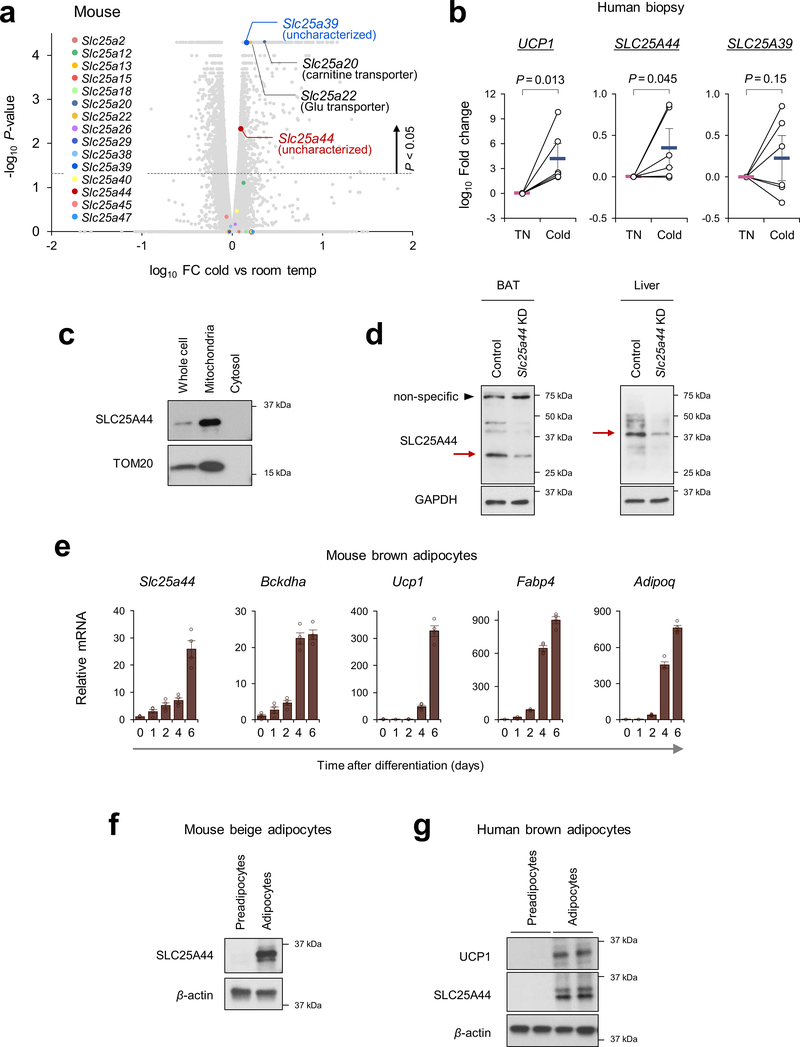
Recognizing the role of BCAA catabolism in BAT thermogenesis, we next sought to answer the long-standing question: how do cells uptake BCAAs into the mitochondria? As described earlier, brown adipocytes in humans and mice predominantly express the mitochondria-localized isoform BCAT2, but the mitochondrial BCAA transporter remains uncharacterized. Hence, we hypothesized that thermogenic adipocytes would express as-of-yet unidentified mitochondrial BCAA transporter. In this regard, SLC25A family members are promising candidates because many of the mitochondrial amino acid transporters belong to this solute carrier transporter family21. Besides SLC25A20 (carnitine/acylcarnitine transporter) and SLC25A22 (glutamate transporter), transcriptome analyses identified two uncharacterized SLC25A members, SLC25A39 and SLC25A44, that were abundantly expressed in mouse and human BAT (Fig.3a, Extended Data Fig.6a). mRNA expression of SLC25A44, but not SLC25A39, in the human supraclavicular BAT was significantly increased after cold exposure and showed a positive correlation with UCP1 and BCKDHA mRNA levels (Fig.3b, Extended Data Fig.6b). SLC25A44 protein was localized to the mitochondria and expressed at the highest level in the BAT relative to other metabolic organs (Fig. 3c, Extended Data Fig. 6c,d). In addition, SLC25A44 expression was increased during brown adipogenesis (Extended Data Fig. 6e–g).
Figure 3. Identification of SLC25A44 as a mitochondrial BCAA transporter.
a. Expression profile of SLC25A family members in human supraclavicular BAT and abdominal subcutaneous WAT from the same individual at 27°C and 19°C5.
b. Correlation of SLC25A44 mRNA expression with UCP1 or BCKDHA in human BAT. Expressions at TN (red) and cold (blue) from 6 biological independent subjects. Pearson’s correlation coefficient was calculated.
c. Protein expression of SLC25A44 in indicated tissues of mice. GAPDH as a loading control. Representative result from two independent experiments. Gel source data are in Supplementary Figure 1.
d-e. Mitochondrial uptakes of indicated molecules in control and Slc25a44 KO brown adipocytes (d) or in Neuro2a cells expressing Slc25a44 or an empty vector (e). n = 3/group, biologically independent samples.
f. [U-14C6] Leu transport into mitochondrial-liposomes from Slc25a44 KO brown adipocytes expressing an empty vector (KO+vector) or Slc25a44 (KO+Slc25a44). n = 3/group, technically independent samples. Representative result from two independent experiments.
Mean ± s.e.m.; two-sided P-values by unpaired Student’s t-test (d, e) or two-way ANOVA (f).
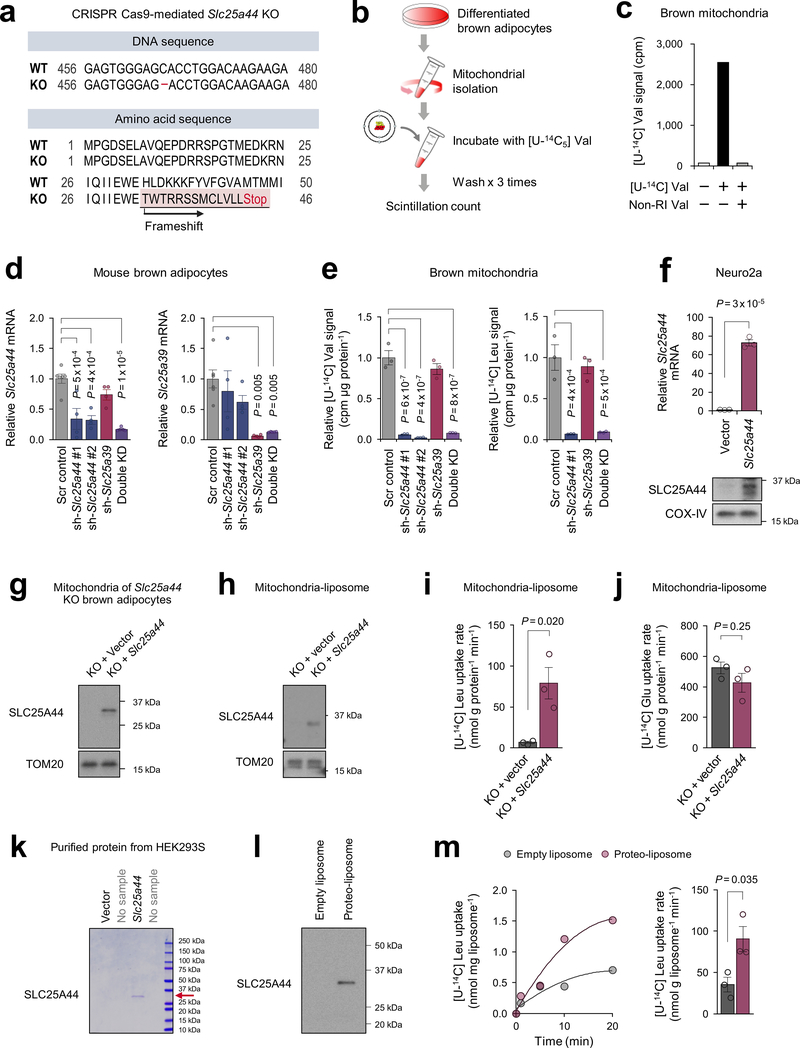
To determine the function of SLC25A44, we generated Slc25a44 KO brown adipocytes by CRISPR-Cas9 (Extended Data Fig.7a). Mitochondrial BCAA uptake assay showed that Val and Leu uptake was selectively and significantly reduced in Slc25a44 KO cells, whereas Slc25a44 deletion did not affect the mitochondrial uptake of other amino acids (Fig.3d, Extended Data Fig.7b,c). Similarly, depletion of Slc25a44 by lentivirus shRNAs abrogated mitochondrial Val and Leu uptake, whereas Slc25a39 depletion did not affect Val and Le uptake (Extended Data Fig.7d,e). Conversely, ectopic expression of SLC25A44 in a neuroblastoma cell line (Neuro2a cells) with undetectable endogenous SLC25A44 sufficiently and selectively restores mitochondrial Val and Leu uptake (Fig.3e, Extended Data Fig.7f).
To characterize SLC25A44 in a cell-free system, we next prepared liposomes that were fused with the mitochondrial inner membrane from Slc25a44 KO brown adipocytes or KO cells that ectopically expressed Slc25a44 (Extended Data Fig.7g,h). In the liposomes preloaded with Leu, we observed a robust and rapid Leu uptake in the mitochondrial-liposomes from SLC25A44-expressing cells, whereas no detectable Leu uptake was measured in the control group (Fig.3f, Extended Data Fig.7i). No difference was found in Glu uptake between the two groups (Extended Data Fig.7j). As an alternative cell-free system, we reconstituted proteo-liposomes by fusing liposomes with purified SLC25A44 protein (Extended Data Fig.7k,l). Consistent with the mitochondrial-liposome, we found active Leu uptake into the proteo-liposomes with purified SLC25A44 (Extended Data Fig.7m).
SLC25A44 is required for BCAA catabolism and BAT thermogenesis
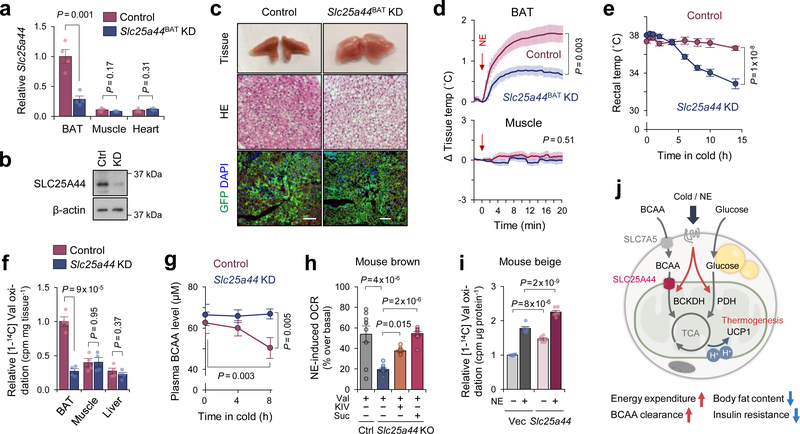
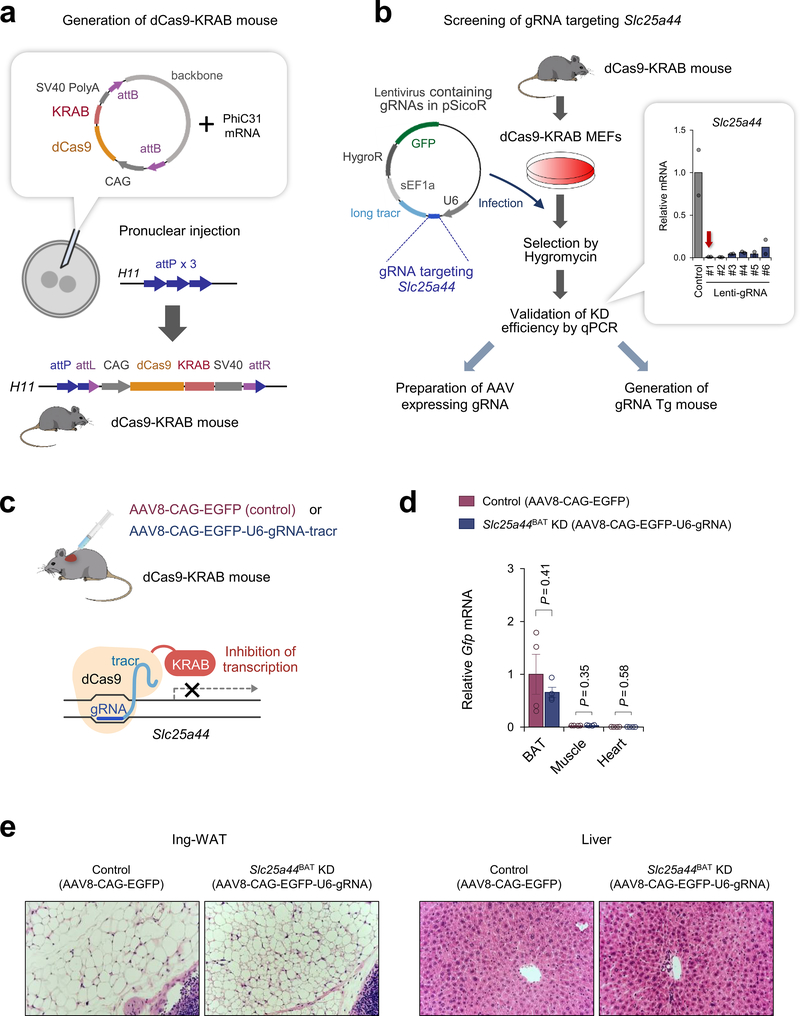
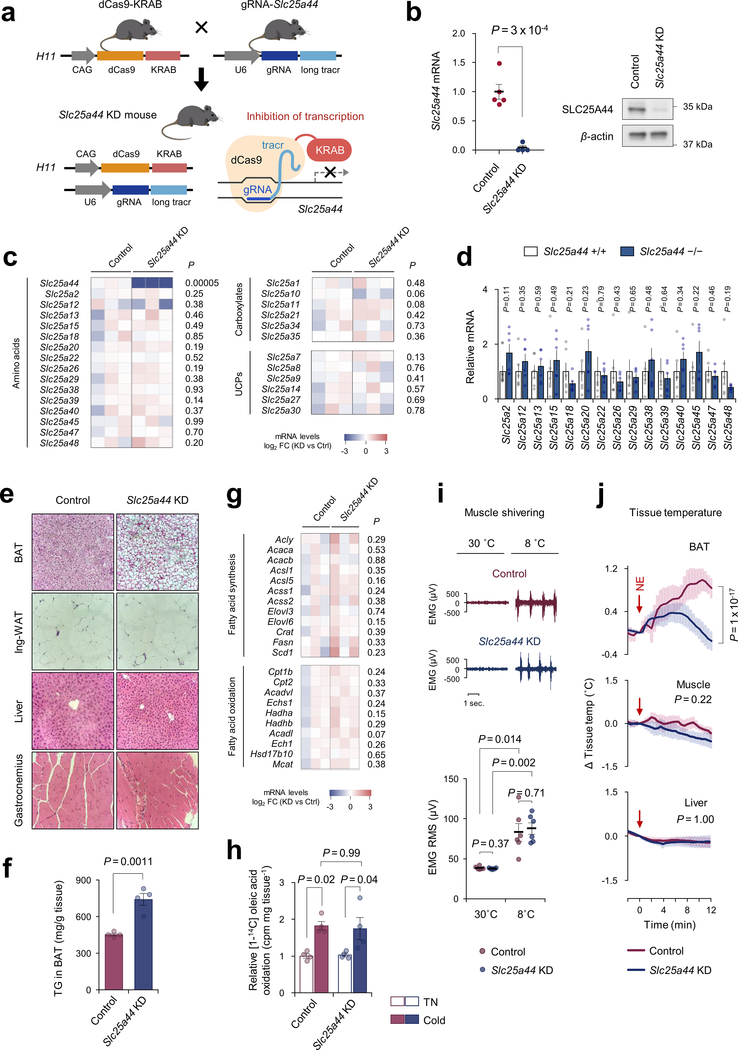
To determine the role of SLC25A44 in vivo, we employed a modified CRISPR system, catalytically inactive Cas9 protein (dCas9) fused to Krüppel associated box (KRAB) domain22. Adeno-associated virus (AAV) expressing a guide RNA (gRNA) targeting Slc25a44 or EGFP (control) was injected into the interscapular BAT of dCas9-KRAB mice22 (Extended Data Fig.8a–c). This system allowed for BAT-selective depletion of SLC25A44 (Slc25a44BAT KD) (Fig.4a,b, Extended Data Fig.8d,e). We found that brown adipocytes in Slc25a44BAT KD mice contained larger lipid droplets than those in control mice (Fig.4c). Moreover, NE-induced BAT thermogenesis in Slc25a44BAT KD mice was significantly impaired relative to controls without affecting muscle thermogenesis (Fig.4d). Next, we generated transgenic mice expressing gRNA targeting Slc25a44, which were subsequently crossed with dCas9-KRAB mice to generate SLC25A44 deficient (Slc25a44 KD) mice (Extended Data Fig.9a,b). Transcriptional analyses detected no compensatory change in other SCL25A members in Slc25a44-KD brown fat (Extended Data Fig.9c,d). Similar to Slc25a44BAT KD mice, the BAT of Slc25a44 KD mice contained larger lipid droplets and higher levels of triglycerides relative to that of controls, whereas the morphology of WAT, liver, and muscle of Slc25a44 KD was normal (Extended Data Fig.9e,f). Although we found no difference in the expression of Ucp1 and FA synthesis/oxidation pathway between the two groups, the core-body temperature of Slc25a44 KD mice was significantly lower than controls following cold exposure without affecting muscle shivering (Fig. 4e, Extended Data Fig.9g–i). Tissue temperature recording confirmed that NE-stimulated BAT thermogenesis was impaired in Slc25a44 KD mice (Extended Data Fig.9j). Furthermore, Val oxidation in the BAT of Slc25a44 KD mice was lower than controls, indicating that SLC25A44 is the primary BCAA transporter in BAT (Fig.4f). Importantly, cold exposure failed to lower plasma BCAA concentration in Slc25a44-KD mice (Fig.4g). These results indicate that SLC25A44 is required for cold-stimulated BAT thermogenesis and systemic BCAA clearance in vivo.
Figure 4. SLC25A44 is required for BAT thermogenesis and BCAA catabolism.
a. Slc25a44 mRNA expression in indicated tissues of Slc25a44BAT KD and control mice. n = 4/group.
b. Immunoblotting of SLC25A44 in BAT of mice in (a). β-actin as a loading control. Representative result from two independent experiments. Gel source data are in Supplementary Figure 1.
c. Morphology, H&E staining, and immunofluorescent GFP staining of BAT in (a). DAPI was used for counter staining. Scale bar: 100 μm. Representative result from two independent mice.
d. Tissue temperature of BAT and muscle in (a) following NE treatment (arrows). n = 5 (control), n = 7 (Slc25a44BAT KD).
e. Rectal core-body temperature of Slc25a44 KD (n = 6) and controls (n = 7) following cold exposure at 8°C.
f. Valine oxidation in indicated tissues normalized by tissue mass. n = 4/group.
g. Plasma BCAA levels in (e) following 8-hour cold temperature at 8°C. n = 6/group.
h. NE-induced OCR normalized by total protein in control and Slc25a44 KO brown adipocytes. n = 9/group (Ctrl+Val, KO+Val+KIV), n = 10/group (KO+Val, KO+Val+succinate).
i. Valine oxidation in inguinal WAT-derived white adipocytes expressing an empty vector or Slc25a44 after NE treatment. n = 5 (vehicle), n = 6 (NE).
j. A proposed model of BCAA catabolism in thermogenic adipose cells. Cold stimuli activate BCAA uptake and oxidation in the mitochondria of thermogenic adipocytes. Mitochondrial BCAA oxidation promotes BAT thermogenesis. This process requires SCL25A44, the mitochondrial BCAA transporter. SLC7A5, L-amino acid transporter 1. Norepinephrine, NE.
a,d-i, biologically independent samples. Mean ± s.e.m.; two-sided P-values by unpaired Student’s t-test (a,f), one-way factorial (h) or two-way repeated measures ANOVA (d,e,g) followed by post-hoc paired/unpaired t-test with Bonferroni’s correction (g) or Tukey’s test (h,i).
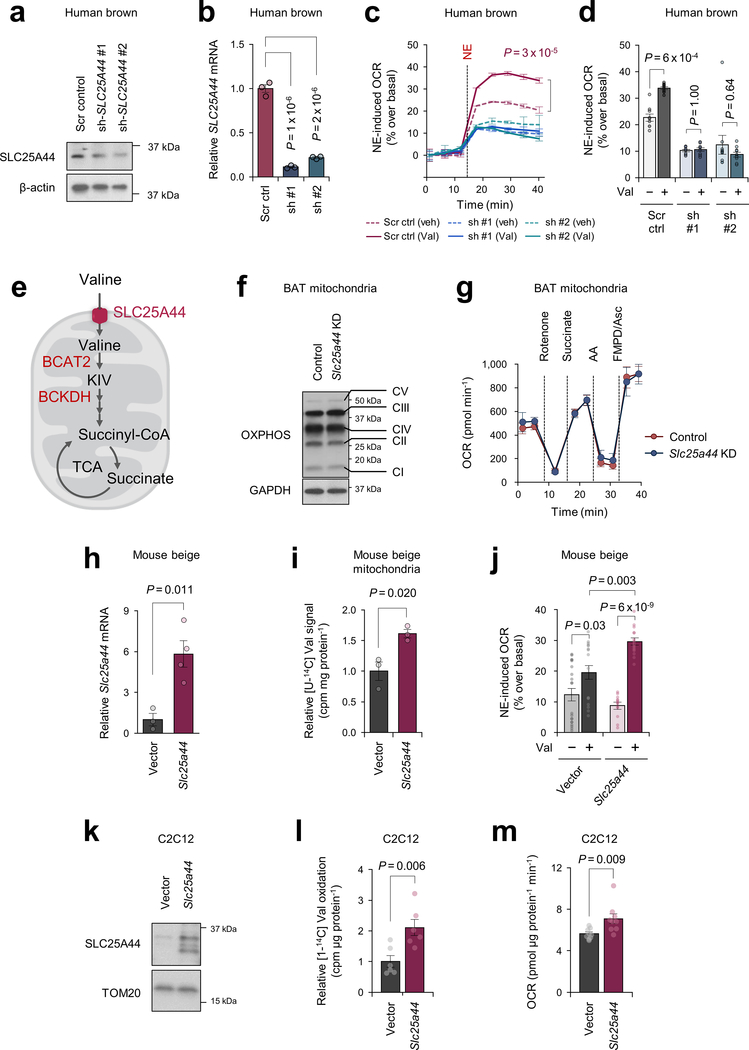
To determine the cell-autonomous function of SLC25A44 in brown adipocytes, we depleted Slc25a44 in brown preadipocytes by lentiviral shRNAs targeting SLC25A44 (Extended Data Fig.10a,b). We found that SLC25A44 depletion caused a significant reduction in NE-induced OCR in the presence of Val (Extended Data Fig.10c,d). Of note, depletion of SLC25A44 did not causes a general mitochondrial defect because supplementation of KIV or succinate, which would bypass mitochondria BCAA transport, restored NE-induced OCR in Slc25a44 KO cells (Fig.4h, Extended Data Fig.10e). Additionally, SLC25A44-depleted brown adipocytes displayed active mitochondrial respiration (Extended Data Fig.10f,g). Conversely, overexpression of Slc25a44 in mouse inguinal WAT-derived adipocytes or C2C12 myotubes significantly increased mitochondrial Val uptake and oxidation, and cellular respiration (Fig.4i, Extended Data Fig.10h–m).
Discussion
Our study suggests the following model (Fig.4j): besides glucose and fatty acids, cold stimuli potently increase mitochondrial BCAA uptake and oxidation in BAT, leading to enhanced BCAA clearance in the circulation. This process requires SLC25A44, a previously uncharacterized mitochondrial BCAA transporter in brown adipocytes. In turn, defective BCAA catabolism in BAT leads to impaired BCAA clearance and thermogenesis, leading to the development of diet-induced obesity and glucose intolerance.
This model provides important implications in the regulation of systemic BCAA metabolism under an obese or diabetic state in which impaired BAT activity and increased circulating BCAA levels are observed in humans and rodents. It has been suggested that the accumulation of incompletely oxidized intermediates derived from BCAA oxidation, such as 3-hydroxyisobutyrate (3-HIB), cause insulin resistance9,23,24. Conversely, lowering circulating BCAA levels by inhibiting the kinase BDK or overexpression of the phosphatase PPM1K in the liver improves glucose tolerance independently from body weight loss in rats25. Furthermore, reduced mitochondrial BCAA oxidation and subsequent accumulation of intracellular BCAA concentration leads to constitutive activation of mTOR signaling, resulting in persistent IRS-1 phosphorylation by mTORC1 and inhibition of insulin signaling6,23,26. The present study suggests a distinct yet non-mutually exclusive mechanism in which impaired BAT activity under an obese or diabetic state reduces systemic BCAA clearance, while active BAT acts as a significant metabolic-filter for circulating BCAA and protects against obesity and insulin resistance. It is conceivable that enhanced mitochondrial BCAA catabolism via SLC25A44 may serve as a promising strategy to improve systemic BCAA clearance and glucose homeostasis.
METHODS
Human subject
Thirty-three healthy young male volunteers were recruited in Sapporo, Japan to investigate the role of BAT in circulating BCAA clearance during cold exposure. All participants were carefully instructed regarding the study and provided written informed consent. The protocols were approved by the Institutional Research Ethics Review Board of Tenshi College (Sapporo, Japan) (UMIN000016361). Human BAT activity was assessed by 18F-FDG-PET/CT scan (Aquiduo; Toshiba Medical Systems, Otawara, Japan) after the standardized non-shivering cold exposure, as reported previously 27. All the subjects have fasted for 12 hours prior to 18F-FDG-PET/CT scanning. Following cold exposure, the volunteers were given an intravenous injection of 18F-FDG (1.66–5.18 MBq/kg body weight) and subsequently stayed in the same cold room for another one hour. BAT activity was assessed by measuring the standardized uptake value (SUV) of 18F-FDG and Hounsfield Units from −300 to −10 in the supraclavicular region using the fusion software (Toshiba Medical Systems). Based on the median of BAT activity, subjects were divided into a high BAT activity group and a low BAT activity group. Arterialized blood samples were obtained from the same subject right before cold exposure and after 2-hour-cold exposure at 19 °C between 9:00 am-11:30 am. Sera were used for metabolite analysis. Amino acid levels were corrected for total amino acid levels by means of linear regression, since individual variation in the most of amino acids (85.3%) can be explained by total amino acids. To minimize possible effects of seasonal variation on BAT, the study was performed from January to March where a monthly average of ambient temperature was 2.1 to −3.5°C in Sapporo, Japan.
Animals
All the animal experiments in this study were performed following the guidelines established by the UCSF Institutional Animal Care and Use Committee. All the mice were 12–16 weeks old, had free access to food and water, 12-hour light cycles, and were caged at 23 °C. For the generation of BAT-specific Bckdha KO mice (BckdhaUCP1 mice), Bckdha floxed mice were obtained from the EuMMCR (European Mouse Mutant cell Repository) (Bckdhatm1a(EUCOMM)Hmgu) and crossed with Ucp1-Cre mice 28. For the generation of BAT-specific Pparg KO mice, Pparg floxed mice were obtained from the Jackson Laboratory (Stock #004584) and crossed with Ucp1-Cre mice. Both KO mice were in the C57BL/6 background.
For metabolic studies, male Bckdha UCP1 KO and littermate control mice at 8 weeks old were fed on a high-fat diet (HFD, 60% fat, D12492, Research Diets) at ambient temperature. Fat mass and lean mass were measured in mice on a HFD for 10 weeks by Body Composition Analyzer EchoMRI (Echo Medical Systems). For glucose tolerance test, the mice fed with HFD for 10 weeks were fasted for 6 hours (from 8:00 to 14:00) and injected intraperitoneally with glucose (1.5 g kg−1 body weight). For ITT experiments, the mice fed with HFD for 11 weeks were fasted 3 hours (from 10:00 to 13:00) and injected intraperitoneally with insulin (0.875 U kg−1 body weight). Blood samples were collected at the indicated time points, and glucose levels were measured using blood glucose test strips (Abbott). BCAA tolerance was performed in male Bckdha UCP1 KO and control mice on a HFD for 10 weeks. For BCAA clearance test, mice were exposed to cold temperature under the fasting condition, and blood samples were obtained at the indicated time points. For BCAA tolerance test, mice were received a single bolus of BCAA oral gavage (500 mg kg−1 body weight; weight ratio, Val: Leu: Ile = 1: 1.5: 0.8) 29 and were exposed to cold at 12 °C under the fasting condition. Blood was corrected at the indicated time points and total plasma BCAA levels were measured by using a commercially available kit (ab83374, Abcam). Independently, plasma BCAA levels after 3 hours oral BCAA gavage were quantified by flow injection electrospray ionization tandem mass spectrometry and quantified by isotope dilution technique using a method described previously 30. Briefly, plasma samples were spiked with a cocktail of heavy-isotope internal standards (Cambridge Isotope Laboratories, MA, USA; CDN Isotopes, Canada), deproteinated with methanol, and esterified with butanol. Mass spectra for amino acid esters were obtained using neutral loss scanning methods. Ion ratios of analyte to respective internal standard computed from centroided spectra were converted to concentrations using calibrators constructed from authentic amino acids (Sigma, MO, USA; Larodan Sweden) and dialyzed Fetal Bovine Serum (Sigma, MO, USA).
dCas9-KRAB mice were generated according to the method reported using a site-specific integrase-mediated approach described in 22. In brief, transgenic mice dCas9-KRAB in the FVB background contain a CAG promoter within the Hipp11 (H11) locus expressing the nuclease-deficient Cas9 fused to the zinc-finger protein 10 (ZNF10) Krüppel-Associated Box (KRAB) repressor domain31, together with mCherry and the puromycin resistance cassette. dCas9-KRAB mice were backcrossed with wild-type C57BL/6J mice, and subsequently crossed with gRNA-Slc25a44 transgenic mice to generate Slc25a44 KD mice.
BAT-specific Slc25a44 KD mice (Slc25a44BAT KD) were generated by injecting AAV expressing gRNA-Slc25a44 (AAV8-CAG-EGFP-U6-gRNA-long tracr; custom order, Vector Biolabs) or control GFP (AAV8-CAG-EGFP) into interscapular BAT following the published protocol32. In short, AAV was injected into the interscapular BAT of dCas9-KRAB adult mice at a viral titer of 6.0 ×10¹¹ genomic copies (GC) per mice. Fifty μl of AAV at a dose of 1.2 × 10¹⁰ GC μl−1 was injected in each BAT depot (5 μl per injection, 10 locations per depot). Efficacy of viral infection and knockdown was evaluated by immunohistochemistry for GFP, and quantification of SLC25A44 expression level.
Chemicals and antibodies
All the chemicals were obtained from Sigma-Aldrich unless otherwise specified. Following antibodies were used in this study: UCP1 antibody (ab-10983, Abcam), BCAT1 antibody (TA504360, OriGene), BCAT2 antibody (9432, Cell Signaling Tech), BCKDHA antibody (sc-271538, Santa Cruz), TOM20 antibody (11802–1-AP, Proteintech), COX-IV antibody (4850, Cell Signaling), OXPHOS cocktail (Abcam, ab110413), PDH-E1α antibody (sc-377092, Santa Cruz), PDH-E1α (pSer232) antibody (AP1063, Millipore), PDH-E1α (pSer293) antibody (ab177461, Abcam), PDH-E1α (pSer300) antibody (AP1064, Millipore), GAPDH antibody (sc-32233, Santa Cruz), and β-actin antibody (A3854, Sigma-Aldrich). Polyclonal antibody for SLC25A44 was generated by using amino acids (MEDKRNIQIIEWEHLDKKKC, MMQRKGEKMGRFQVC, and CKKLSLRPELVDSRH) as epitopes for immunization in rabbit (GeneScript).
Cell culture
Brown adipocyte and beige adipocyte lines from C57BL/6 mice were established in our previous study33. Similarly, immortalized human brown adipocyte and white adipocyte lines were established previously 15. Murine adipocyte differentiation was induced by treating confluent preadipocytes with DMEM containing 10% FBS, 0.5 mM isobutylmethylxanthine, 125 nM indomethacin, 2 μg/ml dexamethasone, 850 nM insulin, 1 nM T3 and 0.5 μM rosiglitazone. Two days after induction, cells were switched to maintenance medium containing 10% FBS, 850 nM insulin, 1 nM T3 and 0.5 μM rosiglitazone. Mouse cells were fully differentiated 6–7 days after inducing differentiation. Immortalized human brown preadipocytes were cultured with animal component-free medium (Stem Cell Technologies; #05449). Brown adipocyte differentiation was induced by treating confluent preadipocytes with animal component free adipogenic differentiation medium (Stem Cell Technologies; #05412) supplemented with T3 (1 nM) and rosiglitazone (0.5 μM). Human cells were fully differentiated 4 weeks after induction. A mouse neuroblastoma line, Neuro2a (89121404, Sigma-Aldrich), was cultured in minimum essential medium Eagle (Sigma-Aldrich, M4655) containing 10% FBS, 1% non-essential amino acid solution (Sigma-Aldrich, M7145), and 1% penicillin streptomycin solution on the collagen-coated plates. C2C12 cells were differentiated into myotubes by culturing confluent cells with DMEM supplemented with 2% FBS and 850 nM insulin. HEK293S cells were infected with retrovirus expressing the C-terminal Flag-tagged Slc25a44 or an empty vector and cultured in suspension with a FreeStyle 293 Expression Medium (Thermo Fisher; 12338018) supplemented with 2% FBS.
Stable isotope-labeled leucine metabolome analysis
To determine the metabolic fate and catabolic flux of Leu in brown adipocytes, we used [13C6, 15N1] Leu tracing followed by capillary electrophoresis time-of-flight mass spectrometry (CE-TOFMS, Agilent Technologies, Santa Clara, CA). Differentiated human brown adipocytes were incubated in the BCAA-free medium supplemented with 2 mM [13C6, 15N1] Leu (608068, Sigma-Aldrich) and were harvested at 1 hour after the treatment with norepinephrine, washed twice with 10 mL of 5% mannitol aqueous solution, and subsequently incubated with 1 mL of methanol containing 25 μM internal standards [methionine sulfone, 2-(N-morpholino)-ethanesulfonic acid (MES) and D-camphor-10-sulfonic acid (CSA)] for 10 min. Four hundred μL of the extracts were mixed with 200 μL of Milli-Q water and 400 μL of chloroform and centrifuged at 10,000 g for 3 min at 4°C. Subsequently, 400 μL of the aqueous solution was centrifugally filtered through a 5-kDa cut-off filter (Human Metabolome Technologies, Tsuruoka, Japan) to remove proteins. The filtrate was centrifugally concentrated and dissolved in 50 μL of Milli-Q water that contained reference compounds (200 μM each of 3-aminopyrrolidine and trimesate) immediately prior to metabolome analysis.
The concentrations of all the charged metabolites in samples were measured by CE-TOFMS, following the methods as previously reported 34. In brief, a fused silica capillary (50 μm i.d. × 100 cm) was used with 1 M formic acid as the electrolyte. Methanol/water (50% v/v) containing 0.1 μM hexakis (2,2-difluoroethoxy) phosphazene was delivered as the sheath liquid at 10 μL/min. Electrospray ionization (ESI)-TOFMS was performed in positive ion mode, and the capillary voltage was set to 4 kV. Automatic recalibration of each acquired spectrum was achieved using the masses of the reference standards ([13C isotopic ion of a protonated methanol dimer (2 MeOH+H)]+, m/z 66.0632) and ([hexakis (2,2-difluoroethoxy) phosphazene +H]+, m/z 622.0290). Quantification was performed by comparing peak areas to calibration curves generated using internal standardization techniques with methionine sulfone. The other conditions were identical to those described previously 34. To analyze anionic metabolites, a commercially available COSMO(+) (chemically coated with cationic polymer) capillary (50 μm i.d. x 105 cm) (Nacalai Tesque, Kyoto, Japan) was used with a 50 mM ammonium acetate solution (pH 8.5) as the electrolyte. Methanol/5 mM ammonium acetate (50% v/v) containing 0.1 μM hexakis (2,2-difluoroethoxy) phosphazene was delivered as the sheath liquid at 10 μL/min. ESI-TOFMS was performed in negative ion mode, and the capillary voltage was set to 3.5 kV. For anion analysis, trimesate and CAS were used as the reference and the internal standards, respectively. The other conditions were identical to those described previously 35. Mole percent enrichment (MPE) of isotopes, an index of isotopic enrichment of metabolites, was calculated as the percent of all atoms within the metabolite pool that are labeled according to the established formula 18,19
DNA constructs for overexpression and knockdown studies
The lentiviral expression plasmid that encodes mouse Slc25a44 open reading frame was obtained from GeneCopoeia (EX-Mm15289-Lv207-GS). The Slc25a44 sequence was amplified from the lentiviral plasmid by PCR and cloned in-frame with a Flag sequence into the retroviral expression vector (Addgene, #75085). Lentiviral shRNA expression constructs targeting mouse Slc25a44 and Slc25a39 (shSlc25a44, CS-MSH073484-LVRU6GH-01; shSlc25a39, MSH034465-LVRU6GH; scrambled control, CSHCTR001-LVRU6GH), lentiviral shRNA expression constructs targeting human SLC25A44 (shSLC25A44, HSH057134-LVRH1H; scrambled control, CSHCTR001-LVRH1H), as well as lentiviral shRNA expression construct targeting mouse Ucp1 were obtained from GeneCopoeia (shUcp1, MSH028473-LVRH1MH). For virus production, HEK293T packaging cells were transfected with 10 μg of lentiviral or retroviral plasmids and the packaging constructs (VSVg, pMDL, and Rev) using a calcium phosphate method. After 48 h, the viral supernatant was harvested and filtered. Immortalized preadipocytes, Neuro2a or HEK293S cells were incubated overnight with the viral supernatant and supplemented with 10 μg/ml polybrene. Hygromycin at a dose of 50 or 200 μg/mL was used for selection of lentivirus-infected human cells and murine cells, respectively. Blasticidin at a dose of 10 μg/mL was used for selection of retrovirus-infected cells.
Generation of Bckdha KO and Slc25a44 KO brown adipocytes
For generation of Bckdha KO brown adipocytes, preadipocytes isolated from BAT of Bckdhaflox/flox mice were immortalized by using the SV40 Large T antigen as described previously 15 and subsequently infected with retrovirus containing Cre (#34565, Addgene), followed by hygromycin selection at a dose of 200 μg/ml. For generation of Slc25a44-KO brown adipocytes, immortalized brown adipocyte cell line was infected with lentivirus packaged by lentiCRISPRv2 (#98291, Addgene) expressing Cas9 and gRNA for Slc25a44 (5’- GGTGCTCCCACTCGATGATC-3’). After selection with 200 μg/ml hygromycin followed by isolating a monoclonal cell, we confirmed homozygous mutations in the Slc25a44 genes by DNA sequencing.
RNA preparation, quantitative RT-PCR, and RNA-sequencing
Total RNA was extracted from tissue or cells using RNeasy mini-kit (Qiagen) and cDNA was synthesized using iScript cDNA Synthesis kit (BioRad) according to the provided protocols. qRT-PCR was performed using an ABI ViiA™7 PCR cycler. The primer sequences are listed in Supplementary Table 4. For RNA-sequencing, the libraries were constructed from total RNA and sequenced using a HiSeq 3000 instrument (Illumina) at the UCLA Technology Center for Genomics and Bioinformatics core by technical staffs who were blinded to the experimental group. Sequenced tags were pseudo-aligned to mouse reference transcriptome. Transcript-level estimated using Kallisto 0.44.0 were imported into R and expression levels per gene were estimated using the Bioconductor package tximport 1.10.0.
BCAA oxidation assay
Differentiated adipocytes in a six-well plate were washed with PBS and incubated in 1 ml of Krebs-Ringer Modified Buffer (KRB)/HEPES buffer, containing 2% BSA, 15 mM glucose, 200 nM adenosine, and either 0.16 μCi/ml [1-14C] Val together with 1 mM non-radioisotope (RI) Val or 0.16 μCi/ml [1-14C] Leu together with non-RI 1 mM Leu, at 37 °C for 2 hours. Subsequently, 350 μL 30% hydrogen peroxide was added in each well, and [14C] CO2 was trapped in the smears supplemented with 300 μL 1 M benzethonium hydroxide solution at room temperature for 20 min. Similarly, isolated tissue (20–30 mg) was placed in a plypropylene round-bottom tube and incubated in the 1 mL KRB/HEPES buffer containing 0.16 μCi/ml [1-14C] Val at 37 °C for 1 hour. After adding 350 μL 30% hydrogen peroxide in the tube, [14C] CO2 was trapped in the center well supplemented with 300 μL 1 M benzethonium hydroxide solution for 20 min at room temperature. BCAA oxidation was quantified by counting radioactivity of trapped [14C] CO2 using scintillation counter.
Mitochondrial amino acid uptake assay
Differentiated adipocytes in 10 cm culture plates were washed in cold PBS and incubated with KPBS at 4 °C for 10 min. Confluent Neuro2a cells were incubated with KPBS without washing in PBS to minimize cell loss. After removing KPBS, mitochondria were isolated by using a mitochondria isolation kit (Thermo Fisher; 89874) according to the provided protocol. Isolated mitochondria were incubated with KRB/HEPES buffer, containing 2% BSA, 15 mM glucose, 200 nM adenosine, and either 0.32 μCi/ml [U-14C] Val, [U-14C] Leu, [U-14C] Ala, [U-14C] Phe, [U-14C] Thr, [U-14C] Glu, [U-14C] Asp, [U-14C] Lys, [U-14C] Arg (Moraveck), or [1-14C] α-ketoisovalerate (American Radiolabeled Chemicals) at 37 °C for 1 hour. After cooling down on ice, mitochondria were washed in chilled PBS three-times and homogenized in 100 μL RIPA buffer. Mitochondrial Val or Leu uptake was quantified by counting radioactivity using a scintillation counter and normalized by protein content.
Liposome preparation
Egg phosphatidylcholine (1.280 mL, 25 mg/mL in CHCl3, Avanti Polar Lipids, 840051), E.coli polar lipid (1.344 mL, 25 mg/mL in CHCl3, Avanti Polar Lipids, 100600), and cardiolipin (0.640 mL, 10 mg/mL in CHCl3, Sigma-Aldrich, C0563) were mixed in round bottle flask. The solvent was removed by rotary evaporation under vacuum at room temperature to form a lipid film, which was further dried under strong vacuum for at least 2 h to remove trace CHCl3. Four mL of 10 mM PIPES buffer pH7.4, which contains 25 mM non-radioisotope Leu and Glu as internal substrates, was gently added to the dried lipid film. The flask was kept overnight at 4 °C to allow the formation of large unilamellar vesicles (LUVs), followed by incubating at 70 °C for 30 min. The LUVs were extruded seven-times through an extruder (Avanti Polar Lipids, 610000), which was assembled with two drain disks separated with a 1.0 μm pore size polycarbonate membrane (GE Whatman, 889–78159). The extruded liposome was concentrated to 40 mg/mL lipid concentration in 10 kDa centrifugal filters (Millipore, UFC505024).
Mitochondria-liposome assay
Mitochondria was isolated from differentiated Slc25a44 KO brown adipocytes stably expressing either Slc25a44 or an empty vector (90 plates/group). The mitochondrial membrane was obtained by mechanical disruption and sonication. Sonicated mitochondrial membrane (2 mg/mL) was fused with liposome (4 mg/mL) by incubating with 40 mM β-D-Octyl glucoside (β-OG, Sigma-Aldrich, O8001) at 4 °C for 1 h in PIPES buffer containing non-radioactive Leu and Glu. After removal of β-OG by Bio-Beads SM-2 (Bio-Rad), mitochondria-liposome was isolated on Sepharose 4B columns (Sigma-Aldrich, 4B-200) to remove the external substrates. Mitochondria-liposomes were trapped on 10 kDa centrifugal filters (Millipore, UFC505024), eluted in 1200 μL PIPES buffer without non-radioactive Leu or Glu, and then used for uptake assays. Transports of [14C6] Leu or [14C5] Glu were initiated by incubating mitochondria-liposomes with either 20 μM [14C6] Leu or 20 μM [14C5] Glu at 37 °C and stopped by filtrating the reaction mixture with vacuum manifold (0.45 μm pore size) at the indicated time points. Following six-times washing with 600 μL ice-cold PIPES buffer, uptake was quantified by a scintillation counter.
Proteo-liposome assay
HEK293S cells stably expressing C-terminal Flag-tagged Slc25a44 were cultured in 9 L suspension medium, harvested, and disrupted with Dounce homogenizer in solubilization buffer [20 mM Tris-HCl, 100 mM NaCl, 10% glycerol, 1% DDM with 0.1 % CHS (Anatrace, D310-CH210), EDTA-free protease inhibitor (Roche)], followed by solubilization at 4 °C for 1 h. After ultracentrifugation at 200,000 x g for 20 min, the supernatant was incubated with Flag M2 affinity gel (Sigma-Aldrich, A2220) at 4 °C for 2 h. The immunoprecipitates were washed five times with washing buffer [20 mM Tris-HCl, 500 mM NaCl, 10% glycerol, 0.1% DDM with 0.01 % CHS], followed by competitive elution using Flag peptide (Sigma-Aldrich, F4799) in SEC buffer [20mM Tris-HCl, 100 mM NaCl, 10% glycerol, 0.1% DDM with 0.01 % CHS]. Purified c-Flag-SLC25A44 (56 μg) was fused with liposome (8 mg) by incubating at 4 °C for 1 h in 2 mL PIPES buffer containing 25 mM non-radioactive Leu and Glu in the presence of 40 mM β-OG. Following removal of β-OG by Bio-Beads SM-2, proteo-liposome was isolated on Sepharose 4B columns to remove the external substrates. Subsequently, the proteo-liposomes were trapped on 10 kDa centrifugal filters, eluted in 1200 μL PIPES buffer without non-radioactive Leu or Glu, and then used for uptake assays. Transports of [14C6] Leu were initiated by incubating proteo-liposomes with 20 μM [14C6] Leu at 37 °C and stopped by filtrating the reaction mixture with vacuum manifold at the indicated time points. Following six-times washing with 600 μL ice-cold PIPES buffer, uptake was quantified by a scintillation counter.
Temperature recording
For core-body temperature recording experiments, rectal temperature of BckdhaUCP1 KO and Slc25a44 KD mice was monitored using a TH-5 thermometer (Physitemp) up to 14 hours after cold exposure. For tissue temperature recording, mice under anesthesia were implanted with type T thermocouple probes in the interscapular BAT, inguinal WAT, liver, and skeletal muscle, according to the method that was described previously 33. Tissue temperature was recorded by TC-2000 Meter (Sable Systems International). When tissue temperature was stable, mice were intraperitoneally administered norepinephrine at a dose of 1 mg per kg body weight to induce non-shivering thermogenesis.
Electromyography (EMG)
Skeletal muscle shivering was assessed by using EMG recording, as reported in our previous study 33. In brief, mice were placed in a restrainer to limit free movement, and twenty-nine-gauge needle electrodes were placed the back muscles of mice. The EMG signal was processed (low-pass filter, 3 kHz; high-pass filter,10 Hz; notch filter, 60 Hz) and amplified 1,000× with Bio Amp (ADInstruments). EMG data were collected from the implanted electrodes at a sampling rate of 2 kHz using LabChart 8 Pro Software (ADInstruments). The raw signal was converted to RMS activity. RMS activity was analyzed for shivering bursts in 10-s windows. For monitoring muscle shivering in humans, EMG at the pectoral muscle was recorded by using a surface EMG (Polymate II; TEAC). EMG was recorded for 10-min at 27°C before cold exposure, and for another 10 min at 19 °C during the 2-hour-cold exposure.
18F-Fluciclovine-PET/CT scan
18F-Fluciclovine (100 μCi) was administered to male wild-type mice (C57Bl6/J) at 14–15 weeks old via a tail vein injection under 2% isoflurane anesthesia after 6-h fasting. Mice were acclimated to either 30°C or cold temperature at 15°C for 2 weeks. 18F-Fluciclovine-uptake (SUV) was measured every minute immediately after tail vein injection using micro-PET/CT imaging system at the UCSF PET/CT Imaging Core Facility. Changes in SUV was quantified starting from the first 60 seconds after 18F-Fluciclovine injection by using software AMIDE 1.0.4 (Amide).
Oxygen consumption assays
Oxygen consumption rate (OCR) in cultured adipocytes was measured using the Seahorse XFe Extracellular Flux Analyzer (Agilent) in a 24-well plate. For measurement of NE-induced respiration in the presence and absence of BCAA, differentiated adipocytes were maintained in KRB/HEPES buffer containing 15 mM glucose, 200 nM adenosine, and 2% BSA. During OCR measurement, cells were treated with 2 mM BCAA (Val, Leu, or Ile), 2 mM KIV, 10 mM succinate, or vehicle, and subsequently treated with NE (1 μM) at the indicated time point. For the mitochondrial stress test, differentiated brown adipocytes in a 24-well plate were pretreated with 300 μM clofibrate, a BCAT2 activator, and subjected to respiratory assay. During OCR measurement, cells were treated with oligomycin (5 μM), carbonyl cyanide 4-(trifluoromethoxy) phenylhydrazone (FCCP, 5 μM) and antimycin (5 μM).
Mitochondrial electron transport (ETC) activity
ETC activity was assessed as reported previously 36. In brief, mitochondria were isolated from BAT of mice using a comitial kit (Ab110168, Abcam) and were resuspended in 300 μl of isolation buffer provided by the kit. After protein quantification by the BCA method, the mitochondrial suspension was diluted with isolation buffer at concentration 0.1 mg/ml, seeded into a 24-well plate (5 μg/50 μl/well), and adhered to the bottom of the plate by centrifugation 2,000 x g at 4°C for 20 min using microplate rotor adaptor. Immediately prior to the measurement, 450μl mitochondrial assay buffer (MAS) and substrates supplemented with pyruvate 10 mM, malate 5 mM, 50 mM KCl, 4 mM KH2PO4, 5 mM HEPES, 1 mM EGTA and 4% fatty-acid-free BSA was added to each well. During OCR measurement by the Seahorse XFe Extracellular Flux Analyzer, mitochondria were treated with 2 μM rotenone, 10 mM succinate, 5 μM antimycin A and 100 μM cN,N,N’,N’-Tetramethyl-p-phenylenediamine (TMPD) with 10 mM ascorbate (Asc) at the indicated time points.
PDH activity and BCKDH assays
Tissue lysate was prepared by homogenizing BAT in ice-cold PBS buffer containing cOmplete Protease Inhibitor Cocktail (Roche) and 5 mM NaF. Two hundred micrograms of BAT lysates were applied to measure PDH enzymatic activities by a commercially available kit (Abcam, ab109902). The BCKDH activity measurement was performed as previously described 37.
Glucose oxidation assay
Differentiated adipocytes in a six-well plate were incubated in DMEM containing 2% FBS for 2 hours. After washing in PBS, cells were incubated in 1 ml of KRB/HEPES buffer, containing 2% BSA, 15 mM glucose, 200 nM adenosine, and 0.5 μCi/ml [1-14C] glucose, supplemented with or without 1 mM Val, at 37 °C for 2 hours. Subsequently, 350 μL 30% hydrogen peroxide was added in each well, and [14C] CO2 was trapped in the smears supplemented with 300 μL 1 M benzethonium hydroxide solution at room temperature for 20 min. For the assay in tissues, mice were fasted for 6 hours and sacrificed. Isolated tissue (20–30 mg) was placed in a plypropylene round-bottom tube and incubated in the 1 mL KRB/HEPES buffer containing 1.0 μCi/ml [1-14C] glucose at 37 °C for 1 hour. After adding 350 μL 30% hydrogen peroxide in the tube, [14C] CO2 was trapped in the center well supplemented with 300 μL 1 M benzethonium hydroxide solution for 20 min at room temperature. Glucose oxidation was quantified by counting radioactivity of trapped [14C] CO2 using scintillation counter.
Fatty acid oxidation assay
Differentiated adipocytes were plated in a six-well plate and incubated in medium containing 2% FBS for 4 h. After washing in PBS, the cells were incubated in 1 ml of KRB/HEPES buffer, containing 15 mM glucose, 0.1 mM oleic acid, and 0.5 μCi/ml [1-14C] oleic acid bound to 2% BSA and 100 μM carnitine, supplemented with or without 1 mM Val, for 2 h at 37 °C. Then, 350 μL 30% hydrogen peroxide was added in each well to trap [14C] CO2 in the smears supplemented with 300 μL 1 M benzethonium hydroxide solution. For the assay in tissues, mice were fasted for 4 hours and sacrificed. Isolated tissue (20–30 mg) was placed in a polypropylene round-bottom tube and incubated in the 1 ml KRB/HEPES buffer containing 1.0 μCi/ml [1-14C] oleic acid at 37°C for 1 hour. After adding 350 μl 30% hydrogen peroxide in the tube, [14C] CO2 was trapped in the center well supplemented with 300 μl 1 M benzethonium hydroxide solution for 20 min at room temperature. Oleic acid oxidation was quantified by counting radioactivity of trapped [14C] CO2 using scintillation counter.
Immunoblotting
Protein lysates from isolated tissues or cultured cells were extracted using Qiagen TissueLyzer LT and RIPA lysis and extraction buffer (Thermo Fisher) and cOmplete protease inhibitors (Roche). Tissue lysates were applied to immunoblot analysis using the UCP1 antibody (1:2000), BCAT1 antibody (1:1000), BCAT2 antibody (1:1000), BCKDHA antibody (1:2000), TOM20 antibody (1:2000), COX-IV antibody (1:2000), OXPHOS cocktail (1:2000), PDH-E1α antibody (1:1000), PDH-E1α (pSer232) antibody (1:1000), PDH-E1α (pSer293) antibody (1:1000), PDH-E1α (pSer300) antibody (1:1000), and SLC25A44 antibody (1:1000). β-actin (1:10000) and GAPDH (1:2000) were used as a loading control for each sample.
Tissue histology and immunostaining
For hematoxylin and eosin (H&E) staining, tissues of mice were fixed in 4% paraformaldehyde overnight at 4 °C, followed by dehydration in 70% ethanol. After the dehydration procedure, tissues were embedded in paraffin, sectioned at a thickness of 5 μm, and stained with H&E following the standard protocol. For immunostaining, paraffin-embedded tissues were deparaffinized twice in xylene and subsequently rehydrated. After incubating the slides for 20 min in boiling water, the tissues were blocked in PBS containing 2% BSA for 60 min. After washing in PBS, the slides were incubated with the primary antibody (chicken anti-mouse GFP, 1:200) overnight at 4 °C, followed by incubation with the fluorescence-conjugated second antibody (goat anti-chicken IgG Alexa Fluor 488 green, 1:500) for 1 hour at room temperature. After washing, the sections were stained with 4’,6-diamidino-2-phenylindole (DAPI) and mounted with mounting medium (Cytoseal 60, Thermo-Scientific). Images of tissue samples were captured using the Inverted Microscope Leica DMi8.
Statistical analyses
All data were expressed as the means with SEMs and analyzed by using statistical software (SPSS 25.0; IBM Japan, Tokyo, Japan). Comparisons between the two groups were analyzed using the paired t-test or the Student’s t-test, as appropriate. One-way or two-way ANOVA followed by Tukey’s test was used for multiple group comparisons. One-way or two-way repeated measures ANOVA was used for the comparisons of repeated measurements. Pearson’s and Spearman’s correlation coefficients were used to determine normally distributed variables and non-normally distributed variables, respectively. Two-tailed P value < 0.05 was considered as statistically significant.
Data availability
The RNA-seq data generated in this study is available at Array Express under the accession code E-MTAB-7987. 13C-Leu tracing data is available in Supplementary Table 3. Uncropped immunoblot images are available in Supplementary Figure 1. The other dataset that support the findings of this study are available in Supplementary Information and Source Data.
Extended Data
Extended Data Fig. 1. Cold-induced changes in circulating metabolites in mice and humans.
a. Representative surface electromyogram (EMG) in adult humans at 27°C and following cold exposure at 19°C for 2 hours. Voluntary muscle contraction as a positive control of EMG recording.
b-c. Serum non-esterified fatty acids (NEFA) (b) and blood glucose (c) levels in high (n = 9) and low BAT subjects (n = 6) at 27°C and following cold exposure at 19°C.
d. Correlation between BAT activity (SUV, log10) and cold-induced changes in serum amino acid levels of high (red dots) and low BAT subjects (blue dots). n = 33/group (all amino acids) except n = 29 (Asp).
e. Correlation between fat-free mass (kg) and changes in serum total BCAAs in (d). n = 33.
f. Changes in plasma BCAA levels at thermoneutral (TN, 30°C) or cold exposure (15°C) in diet-induced obese mice. n = 8 (TN), n = 7 (cold).
b-f, biologically independent samples. Mean ± s.e.m.; two-sided P-values by paired t-test (b,c) or two-way repeated measures ANOVA followed by post-hoc paired/unpaired t-tests with Bonferroni’s correction (f). Pearson’s (r) or Spearman’s rank correlation coefficient (rs) was calculated, as appropriate (d,e).
Extended Data Fig. 2. The BCAA catabolic pathway in human and mouse adipose tissues.
a. 18F-Fluciclovine-uptake into indicated organs determined by dynamic PET scanning. n = 5/group.
b. Valine oxidation (per mg tissue) in indicated tissues of mice acclimated to 23°C or 12°C for one week. n = 5/group.
c. Total valine oxidation in (b). Total Val oxidation was calculated by multiplying Val oxidation per mg tissue (cpm/mg tissue) and tissue mass of the depot (mg).
d. Valine oxidation normalized by total protein (μg) in human brown adipocytes and white adipocytes following 2-hour-treatment with NE or vehicle. n = 5 (Veh), n =6 (NE).
e. Expression profile of BCAA catabolic enzymes enriched in brown/beige fat relative to white fat of humans (left) and mouse (middle, right). Data were obtained from previous RNA-seq dataset in humans15 and microarray dataset in mice17. The profiles were mapped onto the KEGG BCAA catabolic pathway. The number of brown/beige-enriched enzymes among total BCAA catabolic enzymes is shown. n = 3/group.
f. Proteomic profile of indicated enzymes in the BCAA oxidation pathway and mitochondrial carriers (SLC25A families) in interscapular BAT of mice at thermoneutrality (29°C) or 5°C for 3 weeks16. n = 4/group.
g. Transcriptional profile of indicated genes in the glucose oxidation pathway (left) and the BCAA oxidation pathway (right) in the supraclavicular BAT and abdominal WAT from the identical subject under a thermoneutral condition (TN, at 27°C) and after cold exposure at 19°C5. Color scale represents Z-scored FPKM (fragments per kilobase of exon per million fragments mapped).
h. mRNA expression level (FPKM) of Bcat1 and Bcat2 in differentiated brown adipocytes, beige adipocytes, and white adipocytes. The transcriptome data are from previous RNA-seq dataset15.
i. Immunoblotting of BCAT1 and BCAT2 in indicated tissues of mice kept at ambient temperature. GAPDH as a loading control. Representative result from two independent experiments. Gel source data are in Supplementary Figure 1.
a-h, biologically independent samples. Mean ± s.e.m.; two-sided P-values by unpaired Student’s t-test (b,c,f), two-way repeated measures ANOVA (a), or two-way factorial ANOVA followed by Tukey’s post-hoc test (d).
Extended Data Fig. 3. Characterization of BAT-specific Bckdha KO mice.
a. mRNA expression of Bckdha in BAT of BckdhaUCP1 KO and littermate control mice. n = 5/group for all groups except n = 3 for control-gastrocnemius.
b. Valine oxidation normalized by tissue weight (mg) in indicated tissues of mice in (a). n = 5/group.
c. Enzymatic activity of BCKDH complex (KIV oxidation) in BAT of control and BckdhaUCP1 KO mice acclimated to 23°C (n = 3/group) or 12°C (n = 5/group) for one week.
d. Tissue weights of mice in (a) on a normal chow at ambient temperature. n = 4/group.
e. mRNA expression of indicated genes in BAT of mice in (a). n = 5/group.
f. EMG of muscle shivering in control (n = 7) and BckdhaUCP1 KO mice (n = 9) at 30 ºC or 8 ºC. The right graph shows quantitative root mean square (RMS) of EMG.
g. Liver temperature of control and BckdhaUCP1 KO mice following NE treatment. n = 4/group.
h. Plasma amino acid levels after three hours BCAA oral gavage. n = 5/group.
i. Plasma BCAA concentration of control (n = 7) and BckdhaUCP1 KO mice (n = 9) following cold exposure at 8ºC.
a-i, biologically independent samples. Mean ± s.e.m.; two-sided P-values by unpaired Student’s t-test (a,b,d,e,h), two-way factorial ANOVA followed by Tukey’s post-hoc test (c), or two-way repeated measures ANOVA (f,g,i) followed by post-hoc paired/unpaired t-tests with Bonferroni’s correction (f,i).
Extended Data Fig. 4. The effect of norepinephrine on BCAA metabolism in brown adipocytes.
a. Scheme of the metabolic tracer experiment in human brown adipocytes. Cells were treated with vehicle or NE for one hour in the presence of [13C6, 15N1] Leu. CE-TOFMS, capillary electrophoresis time-of-flight mass spectrometry.
b. Isotopologue distributions of TCA intermediates from [13C6, 15N1] Leu in (a). n = 6/group.
c. Protein expression of indicated BCAA catabolic enzymes at indicated time points of cold acclimation. The expression profile is analyzed in the proteomics dataset16. n = 4 (TN, cold 3 weeks), n = 3 (cold 8 hours, 1 day, 3 days, 1 week).
d. The BCAA catabolic pathway that indicates Val and Leu catabolic enzymes. Enzymes whose protein expression was transiently upregulated by acute cold exposure were highlighted in red based on the results in (c). Enzymes whose protein expression was gradually upregulated following chronic cold adaptation were highlighted in blue.
e. OCR normalized by total protein (μg) in human brown adipocytes. Differentiated adipocytes in the BCAA-free medium were supplemented with Val or vehicle, and subsequently stimulated with NE. n = 10/group.
f. Schematics of the mitochondrial Val catabolic pathway. Vanadate and malonate inhibit succinyl coenzyme A synthetase (SCS) and succinate dehydrogenase (SDH), respectively.
g. NE-induced OCR in the presence and absence of Val in mouse brown adipocytes. Following pretreatment with vanadate (50 μM) or malonate (5 mM), differentiated cells in the BCAA-free medium were supplemented with Val or vehicle, and subsequently treated with NE. n = 9 (vehicle), n = 8 (Val), n = 4 (vehicle+vanadate, Val+vanadate), n = 5 (vehicle+malonate, Val+malonate).
h. NE-induced OCR in the presence and absence of BCAAs in mouse brown and white adipocytes. Differentiated cells were supplemented with indicated amino acids, and subsequently treated with 1 μM NE. Brown adipocytes: n = 10 (Val−, Val+, Ile+), 9 (Leu−), 5 (Leu+), and 11 (Ile−). White adipocytes: n = 9 (Val−), and 10 (Val+).
i. NE-induced OCR in the presence and absence of Val in wild-type, Ucp1 KO, and Bckdha KO brown adipocytes. Bckdha KO brown adipocytes were treated with 2 mM KIV, 10 mM succinate, or vehicle prior to NE stimulation. Wild type: n = 10 (Val−) and 9 (Val+). Ucp1 KO: n = 10 (Val−, Val+). Bckdha KO: n = 7 (Val+), 9 (Val+; KIV+), and 10 (Val+; succinate+).
j. OCR normalized by total protein (μM) in wild-type (left) and Bcdkha KO brown adipocytes (right). Differentiated adipocytes were pretreated with BCAT2 activator, clofibrate (300 μM), or vehicle. Following measurement of basal OCR, cells were treated with oligomycin (5 μM), FCCP (5 μM), and AA (5 μM). Wild type: n = 5/group. Bckdha KO: n = 5/group.
b,c,e,g-j, biologically independent samples. Mean ± s.e.m.; two-sided P-values by unpaired Student’s t-test (b,g,h), one-way factorial ANOVA followed by Tukey’s post-hoc test (i) or two-way repeated measures ANOVA (e,i).
Extended Data Fig. 5. Metabolic characterization of BckdhaUCP1 knockout mice.
a. Cumulative food intake of BckdhaUCP1 KO (n = 15) and littermate controls (n = 13) on HFD.
b. Fat mass and lean mass of mice in (a) at 10 weeks of HFD.
c. Tissue weights of in (a).
d. Triglyceride (TG) content in the liver of mice in (a). n = 8/group.
e. Oleic acid oxidation normalized by tissue mass (mg) in the interscapular BAT of mice acclimated to thermoneutral 30°C or cold exposure at 12°C. n = 4/group.
f. PDH activity in the inguinal WAT, gastrocnemius muscle, and liver of BckdhaUCP1 KO mice and littermate controls that were exposed to cold at 12 °C for one week. Ing-WAT: n = 5 (control) and 6 (BckdhaUCP1 KO). Gastrocnemius, liver: n = 4/group.
g. Immunoblotting for PDH-E1α(pSer232), PDH-E1α(pSer293), PDH-E1α(pSer300), and total PDH-E1α in the BAT of the control and BckdhaUCP1 KO mice. GAPDH as a loading control. n = 4/group. Uncropped immunoblot images of are available in Supplementary Figure 1.
h. Quantification of phosphorylated PDH-E1α normalized by total PDH-E1α protein level in (g).
a-h, biologically independent samples. Mean ± s.e.m.; two-sided P-values by unpaired Student’s t-test (b-d,f,h), two-way repeated measures ANOVA (a) or two-way factorial ANOVA followed by Tukey’s post-hoc test (e).
Extended Data Fig. 6. Characterization of SLC25A44 in thermogenic adipocytes.
a. Expression profile of Slc25a family members in the inguinal WAT of mice acclimated to 23°C or 12°C for one week. n = 3/group.
b. mRNA expression of UCP1, SLC25A44, and SLC25A39 normalized to TBP levels in the supraclavicular BAT from the same individuals (6 pairs) at thermoneutrality (TN, 27°C) and cold temperature (19°C).
c. Mitochondrial localization of SLC25A44 protein in differentiated mouse beige adipocytes. TOM20 as a mitochondrial marker.
d. Immunoblotting for SLC25A44 in BAT and liver of control and Slc25a44 KD mice. GAPDH as a loading control. Red arrows indicate specific bands whose intensities were decreased in Slc25a44 KD mice.
e. mRNA expression of Slc25a44 and indicated genes normalized by 36B4 levels during mouse brown adipogenesis. n = 4/group.
f. Protein expression of SLC25A44 in mouse beige preadipocytes and differentiated adipocytes. β-actin as a loading control.
g. Protein expression of UCP1 and SLC25A44 in immortalized human brown preadipocytes and differentiated adipocytes. β-actin as a loading control.
a,b,e, biologically independent samples. Means ± s.e.m.; one-sided P-values by paired t-test (b) and two-sided P-values by unpaired Student’s t-test (a). c,d,f,g, representative results from two independent experiments. Uncropped images are available in Supplementary Figure 1.
Extended Data Fig. 7. Biochemical characterization of SLC25A44.
a. Genomic Slc25a44 sequence and amino acid sequence of Slc25a44 KO brown cell line. Homozygous mutation in the Slc25a44 gene by CRISPR-Cas9 results in a premature stop codon in KO cells.
b. Scheme of mitochondrial BCAA uptake assay. Isolated mitochondria from differentiated brown adipocytes were incubated with [U-14C5] Val. Mitochondrial uptake was quantified by a scintillation counter.
c. Validation of mitochondrial Val uptake assay in differentiated brown adipocytes. Note that addition of excess non-labeled Val (20 mM) abolished [U-14C5] Val uptake into the mitochondria.
d. mRNA expression of Slc25a44 and Slc25a39 in differentiated mouse brown adipocytes expressing a scrambled control shRNA (Scr) and shRNAs targeting Slc25a44 (shRNA #1, #2), Slc25a39, or both Slc25a44 shRNA #1 and Slc25a39 shRNA (double knockdown). n = 4/group for all group except n = 6 for Scr control.
e. Mitochondria uptake of [U-14C5] Val (left) and [U-14C6] Leu (right) in brown adipocytes in (d). n = 3/group.
f. mRNA and protein expression of Slc25a44 in mitochondria of Neuro2a cells expressing an empty vector or Slc25a44. COX-IV as a loading control. n = 3/group.
g. Immunoblotting for SLC25A44 in the isolated mitochondria from differentiated Slc25a44 KO brown adipocytes expressing an empty vector or Slc25a44. TOM20 as a loading control.
h. Immunoblotting of SLC25A44 in the mitochondria-fused liposome. Mitochondrial membrane isolated from Slc25a44 KO brown adipocytes expressing an empty vector or Slc25a44 was fused with liposome. TOM20 as a loading control.
i. [U-14C6] Leu uptake rate in the liposome in (h). n = 3/group.
j. [U-14C5] Glutamate (Glu) uptake rate in the liposome in (h). n = 3/group.
k. Coomassie-blue staining of purified SLC25A44 protein from HEK293S cells overexpressing Slc25a44.
l. Immunoblotting of SLC25A44 in liposomes reconstituted with purified SLC25A44 (proteo-liposome) and liposomes reconstituted without SLC25A44 (empty liposome).
m. Left: [U-14C6] Leu transport into proteo-liposome in (l). Right: Leucine uptake rate. n = 3/group.
d-f, biologically independent samples. i,j,m, technically independent samples. f-m, representative result from two independent experiments. Means ± s.e.m.; two-sided P-values by unpaired Student’s t-test (f,i,j,m) or one-way ANOVA followed by Tukey’s post-hoc test (d,e). f-h,k-l, uncropped images are available in Supplementary Figure 1.
Extended Data Fig. 8. Generation of Slc25a44BAT knockdown mice.
a. DNA constructs used in the generation of dCas9-KRAB mice. The dCas9-KRAB construct was inserted into the Hipp11 (H11) gene locus by the site-specific PhiC31 integrase.
b. Experimental procedure of gRNA screening. MEFs from dCas9-KRAB mice were used to identify gRNA that effectively deplete Slc25a44. The right graph: Slc25a44 knockdown efficiency for six independent gRNAs in the dCas9-KRAB-derived MEFs (n = 2/group). gRNA-Slc25a44 #1 (indicated by a red arrow) was used for generation of gRNA Tg mouse.
c. Schematics of BAT-specific Slc25a44 KD mice (Slc25a44BAT KD) by using the dCas9-KRAB system. AAV8-CAG-EGFP-U6-gRNA-tracr targeting Slc25a44 was injected into the interscapular BAT of mice expressing dCas9-KRAB on the H11 locus (dCas9-KRAB mouse). AAV8-CAG-EGFP without gRNA was used as a control.
d. mRNA expression of Gfp normalized by 36B4 in the indicated tissues of dCas9-KRAB mice in (c). n = 4/group.
e. H&E staining of inguinal WAT and liver of control and Slc25a44BAT KD mice.
b,d, biologically independent samples. Means ± s.e.m.; two-sided P-values by unpaired Student’s t-test (d).
Extended Data Fig. 9. Characterization of Slc25a44 knockdown mice.
a. Generation of Slc25a44 KD mice by the dCas9-KRAB system. The dCas9-KRAB mouse was crossed with transgenic mouse expressing gRNA targeting Slc25a44 to generate SLC25A44 deficient mice.
b. Slc25a44 mRNA expression normalized by 36B4 levels and protein expression in the BAT of mice in (a). β-actin as a loading control. n = 5 (control), and 4 (Slc25a44 KD).
c. Expression profile of Slc25a family members in BAT in (a) by RNA-seq analysis. The color scale shows Z-scored fold change in FPKM (Slc25a44 KD vs control). n = 3/group.
d. mRNA expression of Slc25a families normalized by 36B4 levels in Slc25a44 KO and control brown adipocytes. n = 6/group.
e. H&E staining of BAT, inguinal WAT, liver, and gastrocnemius muscle from mice in (a).
f. Triglyceride (TG) content in the interscapular BAT of Slc25a44 KD and control mice. n = 4/group.
g. Expression profile of fatty acid synthesis- and oxidation-related genes in BAT of mice in (a) by RNA-seq analysis. The color scale shows Z-scored fold change in FPKM (Slc25a44 KD vs control). n = 3/group.
h. Oleic acid oxidation normalized by tissue mass (mg) in BAT of Slc25a44 KD and control mice acclimated to thermoneutral 30°C or cold temperature (12°C) for one week. n = 4/group.
i. EMG measurement of muscle shivering in control mice and Slc25a44 KD mice at 30 ºC or 8 ºC. The lower graph shows the quantitative root mean square (RMS) of the EMG. n = 6/group.
j. Tissue temperature in indicated tissues of control and Slc25a44 KD mice following NE treatment (indicated by red arrows). n = 4/group.
b-d,f-j, biologically independent samples. Means ± s.e.m.; two-sided P-values by unpaired Student’s t-test (b-d,f-g), two-way factorial ANOVA followed by Tukey’s post-hoc test (h), or two-way repeated measures ANOVA (i,j) followed by post hoc paired/unpaired t-test with Bonferroni’s correction (i). b,e, representative results from two independent experiments. Uncropped immunoblot images are available in Supplementary Figure 1.
Extended Data Fig. 10. The cell-autonomous role of SLC25A44 in brown adipocytes.
a. Immunoblotting of SLC25A44 in human brown adipocytes expressing a scrambled control shRNA (Scr) and shRNAs targeting SLC25A44 (#1, #2). β-actin as a loading control.
b. mRNA expression of SLC25A44 normalized by TBP levels in (a). n = 3/group.
c. NE-induced OCR normalized by total protein (μg) in the presence and absence of Val supplementation in (a). Differentiated human brown adipocytes in the BCAA-free medium were supplemented with Val or vehicle, and subsequently treated with NE. n = 9/group (Scr control, sh-Slc25a44 #1), n = 10/group (sh-Slc25a44 #2).
d. Means NE-induced OCR in (c).
e. Illustration of Val metabolism in the mitochondria.
f. Immunoblotting of mitochondrial proteins (as indicated) in the interscapular BAT of control and Slc25a44 KD mice. GAPDH as a loading control.
g. ETC activity of BAT mitochondria. Isolated mitochondria from BAT of control mice and Slc25a44 KD mice were treated with rotenone (2 μM), succinate (10 mM), AA (5 μM), and TMPD (100 μM) with ascorbate (Asc, 10mM). n = 5/group.
h. mRNA expression of Slc25a44 normalized by 36B4 in mouse beige adipocytes expressing an empty vector (n = 3) or Slc25a44 (n = 4).
i. Mitochondrial Val uptake in beige adipocytes in (h). n = 3/group.
j. NE-induced OCR in (h). Differentiated adipocytes in the BCAA-free medium were supplemented with Val or vehicle, and subsequently stimulated with NE. Vector: n = 20 (vehicle) and 16 (Val). Slc25a44: n = 13 (vehicle) and 16 (Val).
k. Immunoblotting of SLC25A44 in C2C12 myotubes expressing an empty vector or Slc25a44. β-actin as a loading control.
l. Valine oxidation normalized by total protein (μg) in C2C12 myotubes in (k). n = 6/group.
m. OCR normalized by total protein (μg) in C2C12 myotubes in (k). n = 9/group.
b-d,g-j,l-m, biologically independent samples. Means ± s.e.m; two-sided P-values by unpaired Student’s t-test (h,i,l,m), one-way (b) or two-way (d,j) factorial ANOVA followed by Tukey’s post-hoc test, or two-way repeated measures ANOVA (c,g). a,f,k, representative results from two independent experiments. Uncropped immunoblot images are available in Supplementary Figure 1.
Supplementary Material
Acknowledgments
We are grateful to Newgard C.B. for the initial metabolomics analysis, Kunji E. for liposome study, Seo Y. and Huynh T. for PET/CT scan, Cheng Y. and Green E. for providing HEK293S cells, Chouchani E.T. and Mills E. for cell respiration studies, Drs. Lu X. and Shinoda K. for technical help. This work was supported by the NIH (DK97441 and DK112268) and the Edward Mallinckrodt, Jr. Foundation to S.K., the American Diabetes Association Pathways Award (1-16-INI-17) to P.J.W., the AMED-CREST from the Japan Agency for Medical Research and Development to T.S., and the NIH (U19CA179513 and P30 DK063720) to M.T.M. T.Y. and M.K. are supported by the JSPS Fellowships.
Footnotes
The authors declare no competing financial interests.
Supplementary Information is available in the online version of the paper.
References
- 1.Ouellet V et al. Brown adipose tissue oxidative metabolism contributes to energy expenditure during acute cold exposure in humans. The Journal of clinical investigation 122, 545–552, doi: 10.1172/JCI60433 (2012). [DOI] [PMC free article] [PubMed] [Google Scholar]
- 2.Cypess AM et al. Identification and importance of brown adipose tissue in adult humans. The New England journal of medicine 360, 1509–1517 (2009). [DOI] [PMC free article] [PubMed] [Google Scholar]
- 3.Saito M et al. High incidence of metabolically active brown adipose tissue in healthy adult humans: effects of cold exposure and adiposity. Diabetes 58, 1526–1531 (2009). [DOI] [PMC free article] [PubMed] [Google Scholar]
- 4.Bartelt A et al. Brown adipose tissue activity controls triglyceride clearance. Nature medicine 17, 200–205, doi: 10.1038/nm.2297 (2011). [DOI] [PubMed] [Google Scholar]
- 5.Chondronikola M et al. Brown Adipose Tissue Activation Is Linked to Distinct Systemic Effects on Lipid Metabolism in Humans. Cell metabolism 23, 1200–1206, doi: 10.1016/j.cmet.2016.04.029 (2016). [DOI] [PMC free article] [PubMed] [Google Scholar]
- 6.Newgard CB et al. A branched-chain amino acid-related metabolic signature that differentiates obese and lean humans and contributes to insulin resistance. Cell metabolism 9, 311–326, doi: 10.1016/j.cmet.2009.02.002 (2009). [DOI] [PMC free article] [PubMed] [Google Scholar]
- 7.Huffman KM et al. Relationships between circulating metabolic intermediates and insulin action in overweight to obese, inactive men and women. Diabetes care 32, 1678–1683, doi: 10.2337/dc08-2075 (2009). [DOI] [PMC free article] [PubMed] [Google Scholar]
- 8.Wang TJ et al. Metabolite profiles and the risk of developing diabetes. Nature medicine 17, 448–453, doi: 10.1038/nm.2307 (2011). [DOI] [PMC free article] [PubMed] [Google Scholar]
- 9.Lynch CJ & Adams SH Branched-chain amino acids in metabolic signalling and insulin resistance. Nat Rev Endocrinol 10, 723–736, doi: 10.1038/nrendo.2014.171 (2014). [DOI] [PMC free article] [PubMed] [Google Scholar]
- 10.Pietilainen KH et al. Global transcript profiles of fat in monozygotic twins discordant for BMI: pathways behind acquired obesity. PLoS medicine 5, e51, doi: 10.1371/journal.pmed.0050051 (2008). [DOI] [PMC free article] [PubMed] [Google Scholar]
- 11.She P et al. Obesity-related elevations in plasma leucine are associated with alterations in enzymes involved in branched-chain amino acid metabolism. American journal of physiology 293, E1552–1563, doi: 10.1152/ajpendo.00134.2007 (2007). [DOI] [PMC free article] [PubMed] [Google Scholar]
- 12.Lackey DE et al. Regulation of adipose branched-chain amino acid catabolism enzyme expression and cross-adipose amino acid flux in human obesity. American journal of physiology 304, E1175–1187, doi: 10.1152/ajpendo.00630.2012 (2013). [DOI] [PMC free article] [PubMed] [Google Scholar]
- 13.Herman MA, She P, Peroni OD, Lynch CJ & Kahn BB Adipose tissue branched chain amino acid (BCAA) metabolism modulates circulating BCAA levels. The Journal of biological chemistry 285, 11348–11356, doi: 10.1074/jbc.M109.075184 (2010). [DOI] [PMC free article] [PubMed] [Google Scholar]
- 14.Neinast MD et al. Quantitative Analysis of the Whole-Body Metabolic Fate of Branched-Chain Amino Acids. Cell metabolism, doi: 10.1016/j.cmet.2018.10.013 (2018). [DOI] [Google Scholar]
- 15.Shinoda K et al. Genetic and functional characterization of clonally derived adult human brown adipocytes. Nature medicine 21, 389–394, doi: 10.1038/nm.3819 (2015). [DOI] [PMC free article] [PubMed] [Google Scholar]
- 16.Sustarsic EG et al. Cardiolipin Synthesis in Brown and Beige Fat Mitochondria Is Essential for Systemic Energy Homeostasis. Cell metabolism 28, 159–174 e111, doi: 10.1016/j.cmet.2018.05.003 (2018). [DOI] [PMC free article] [PubMed] [Google Scholar]
- 17.Rosell M et al. Brown and white adipose tissues: intrinsic differences in gene expression and response to cold exposure in mice. American journal of physiology 306, E945–964, doi: 10.1152/ajpendo.00473.2013 (2014). [DOI] [PMC free article] [PubMed] [Google Scholar]
- 18.Green CR et al. Branched-chain amino acid catabolism fuels adipocyte differentiation and lipogenesis. Nature chemical biology 12, 15–21, doi: 10.1038/nchembio.1961 (2016). [DOI] [PMC free article] [PubMed] [Google Scholar]
- 19.Wallace M et al. Enzyme promiscuity drives branched-chain fatty acid synthesis in adipose tissues. Nature chemical biology 14, 1021–1031, doi: 10.1038/s41589-018-0132-2 (2018). [DOI] [PMC free article] [PubMed] [Google Scholar]
- 20.Ohno H, Shinoda K, Ohyama K, Sharp LZ & Kajimura S EHMT1 controls brown adipose cell fate and thermogenesis through the PRDM16 complex. Nature 504, 163–167, doi: 10.1038/nature12652 (2013). [DOI] [PMC free article] [PubMed] [Google Scholar]
- 21.Palmieri F The mitochondrial transporter family SLC25: identification, properties and physiopathology. Mol Aspects Med 34, 465–484, doi: 10.1016/j.mam.2012.05.005 (2013). [DOI] [PubMed] [Google Scholar]
- 22.Tasic B et al. Site-specific integrase-mediated transgenesis in mice via pronuclear injection. Proceedings of the National Academy of Sciences of the United States of America 108, 7902–7907, doi: 10.1073/pnas.1019507108 (2011). [DOI] [PMC free article] [PubMed] [Google Scholar]
- 23.Newgard CB Interplay between lipids and branched-chain amino acids in development of insulin resistance. Cell metabolism 15, 606–614, doi: 10.1016/j.cmet.2012.01.024 (2012). [DOI] [PMC free article] [PubMed] [Google Scholar]
- 24.Jang C et al. A branched-chain amino acid metabolite drives vascular fatty acid transport and causes insulin resistance. Nature medicine 22, 421–426, doi: 10.1038/nm.4057 (2016). [DOI] [PMC free article] [PubMed] [Google Scholar]
- 25.White PJ et al. The BCKDH Kinase and Phosphatase Integrate BCAA and Lipid Metabolism via Regulation of ATP-Citrate Lyase. Cell metabolism, doi: 10.1016/j.cmet.2018.04.015 (2018). [DOI] [PMC free article] [PubMed] [Google Scholar]
- 26.Um SH, D’Alessio D & Thomas G Nutrient overload, insulin resistance, and ribosomal protein S6 kinase 1, S6K1. Cell metabolism 3, 393–402, doi: 10.1016/j.cmet.2006.05.003 (2006). [DOI] [PubMed] [Google Scholar]
References for Method section
- 27.Yoneshiro T et al. Recruited brown adipose tissue as an antiobesity agent in humans. The Journal of clinical investigation 123, 3404–3408, doi: 10.1172/JCI67803 (2013). [DOI] [PMC free article] [PubMed] [Google Scholar]
- 28.Kong X et al. IRF4 is a key thermogenic transcriptional partner of PGC-1alpha. Cell 158, 69–83, doi: 10.1016/j.cell.2014.04.049 (2014). [DOI] [PMC free article] [PubMed] [Google Scholar]
- 29.Li T et al. Defective Branched-Chain Amino Acid Catabolism Disrupts Glucose Metabolism and Sensitizes the Heart to Ischemia-Reperfusion Injury. Cell metabolism 25, 374–385, doi: 10.1016/j.cmet.2016.11.005 (2017). [DOI] [PMC free article] [PubMed] [Google Scholar]
- 30.Ferrara CT et al. Genetic networks of liver metabolism revealed by integration of metabolic and transcriptional profiling. PLoS genetics 4, e1000034, doi: 10.1371/journal.pgen.1000034 (2008). [DOI] [PMC free article] [PubMed] [Google Scholar]
- 31.Gilbert LA et al. CRISPR-mediated modular RNA-guided regulation of transcription in eukaryotes. Cell 154, 442–451, doi: 10.1016/j.cell.2013.06.044 (2013). [DOI] [PMC free article] [PubMed] [Google Scholar]
- 32.Balkow A et al. Direct lentivirus injection for fast and efficient gene transfer into brown and beige adipose tissue.. J Biol Methods 3, e48, doi:doi: 10.14440/jbm.2016.123(2016)(2016). [DOI] [PMC free article] [PubMed] [Google Scholar]
- 33.Ikeda K et al. UCP1-independent signaling involving SERCA2b-mediated calcium cycling regulates beige fat thermogenesis and systemic glucose homeostasis. Nature medicine 23, 1454–1465, doi: 10.1038/nm.4429 (2017). [DOI] [PMC free article] [PubMed] [Google Scholar]
- 34.Soga T et al. Differential metabolomics reveals ophthalmic acid as an oxidative stress biomarker indicating hepatic glutathione consumption. The Journal of biological chemistry 281, 16768–16776, doi: 10.1074/jbc.M601876200 (2006). [DOI] [PubMed] [Google Scholar]
- 35.Soga T et al. Metabolomic profiling of anionic metabolites by capillary electrophoresis mass spectrometry. Analytical chemistry 81, 6165–6174, doi: 10.1021/ac900675k (2009). [DOI] [PubMed] [Google Scholar]
- 36.Das KC Hyperoxia decreases glycolytic capacity, glycolytic reserve and oxidative phosphorylation in MLE-12 cells and inhibits complex I and II function, but not complex IV in isolated mouse lung mitochondria. PloS one 8, e73358, doi: 10.1371/journal.pone.0073358 (2013). [DOI] [PMC free article] [PubMed] [Google Scholar]
- 37.White PJ et al. Branched-chain amino acid restriction in Zucker-fatty rats improves muscle insulin sensitivity by enhancing efficiency of fatty acid oxidation and acyl-glycine export. Molecular metabolism 5, 538–551, doi: 10.1016/j.molmet.2016.04.006 (2016). [DOI] [PMC free article] [PubMed] [Google Scholar]
Associated Data
This section collects any data citations, data availability statements, or supplementary materials included in this article.
Supplementary Materials
Data Availability Statement
The RNA-seq data generated in this study is available at Array Express under the accession code E-MTAB-7987. 13C-Leu tracing data is available in Supplementary Table 3. Uncropped immunoblot images are available in Supplementary Figure 1. The other dataset that support the findings of this study are available in Supplementary Information and Source Data.


