

Abstract
Solubility isotherms of beta-tricalcium phosphate, β-Ca(PO4)2, prepared by heating mixtures of CaCO3 and CaHPO4 above 800 °C, were determined in the ternary system Ca(OH)2-H3PO4-H2O at 5, 15, 25, and 37 °C in the pH range 6.0–7.5 by equilibration with dilute H3PO4 solutions. The results indicate that β-Ca3(PO4)2 has a negative thermal coefficient of solubility. The solubility product, Ks, was determined as a function of temperature by a generalized least-squares procedure; the resulting equation is
the values of Ks and its dispersion at 25 and 37 °C are 1.20(0.056), and 0.283(0.011) × 10−29. Thermodynamic functions for the dissolution of the salt at the four experimental temperatures are reported.
When treated as an adjustable constant, the Ca/P ratio in these β-Ca3(PO4)2 solutions was found to have the value 1.514(0.010), confirming that the stoichiometry of the high temperature form of this salt is correctly indicated by the above formula.
The computed isotherms at 25 °C for several calcium phosphates are compared; it is shown that β-Ca3(PO4)2 is, next to Ca5(PO4)3OH, the most stable at pH’s above 6.36. The singular points of the β-Ca3(PO4)2 isotherm with those of CaHPO4 · 2H2O and CaHPO4 are at pH’s 5.88 and 6.36, respectively.
Keywords: Beta-tricalcium phosphate, preparation, solubility, solubility product, stoichiometry of, dissolution, thermodynamics of, ion pairs, singular points, solubility isotherms, thermal coefficient of solubility
1. Introduction
Whitlockite, a mineral related to β-Ca3(PO4)2 (beta-tricalcium phosphate), is an important constituent of dental calculus [1, 2]1 and may occur in carious lesions [3, 4, 5] and calcified aortas [6]. The formation and stability of whitlockite seem to be enhanced by the presence of cations smaller than Ca2+, such as Fe2+ and Mg2+ [7]. There appears to be a structural difference between material prepared at a high temperature (referred to here as β-Ca3(PO4)2) and that which is formed in an aqueous environment (whitlockite) [7]. Information on the solubility of either form of this salt in the ternary system Ca(OH)2-H3PO4-H2O has hitherto been lacking. Preliminary reports on the solubility at 25 °C [8], and at 5, 15, and 37 °C [9] of the high temperature product have been presented earlier. We report here the consolidated results and refined calculations at these four temperatures. The experimental data were treated by the generalized least squares procedure described in earlier publications [10, 11, 12], taking into account the formation of ion pairs.
2. Materials and Methods
2.1. Preparation of β-Ca3(PO4)2
The starting materials used were calcium carbonate (reagent grade) and dicalcium phosphate (CaHPO4), the preparation of which has been described in detail [13]. Mixtures of these salts were suspended in ethanol, homogenized, filtered, and dried for a day or longer at approximately 1000 °C. After cooling, the product was examined microscopically and analyzed. The process was repeated after adjustment of the composition by an incremental addition of the appropriate salt or of aq. Ca(OH)2. When the composition was satisfactory (molar Ca/P ratio = 1.50) the product was converted to the high temperature form (α-Ca3(PO4)2) by heating to 1150 to 1200 °C; this treatment removed inhomogeneities noted by microscopic examination. Finally the product was reconverted to the β-form by prolonged heating at 800 to 950 °C. The final preparation consisted of aggregates of rounded grains ranging from 7 to 50 μm in diameter. The percentage of phosphorus present as pyrophosphate was at most 0.30. X-ray powder diffraction patterns confirmed that the bulk of the material was β-Ca3(PO4)2, with a few barely detectable peaks that could be attributed to α-(Ca)3(PO4)2.
2.2. Analyses
The methods for the measurement of pH, calcium and phosphorus (as orthophosphate) have been described in earlier publications [12, 13]. Phosphorus as pyrophosphate was determined by the method of Gee and Dietz [14].
2.3. Equilibrations
Batch equilibration was employed. Glass-stoppered 200 ml bottles containing 2–3 g of β-Ca3(PO4)2 were half filled with phosphoric acid solutions of known concentrations while flushing with a stream of N2; after sealing the stoppers with paraffin, the bottles were rotated end-over-end in a water bath held to within 0.1 degree of the selected temperature for periods ranging from 2–3 weeks. Samples were passed through millipore filters before analysis. Final equilibration runs were made only after preliminary “washing” runs were made under the same conditions. This procedure was used to ascertain the behavior of the systems and in particular to check on possible changes in the solid during prolonged exposure to the acid solutions. No significant changes in composition or form of the solid were detected in any of the systems included in the final equilibrations.
3. Calculations
The methods and procedures used for calculating solubility products and ion pair association constants by generalized least squares have been described previously [12]. In what follows only the modifications and specifications pertinent to the case of β-Ca3(PO4)2 are given in detail. Curly brackets will be used to denote equation, section, and table numbers used in the previous paper [12]. In this work the purpose of the calculations was to obtain the “true” solubility product, Ks, of β-Ca3(PO4)2 as a function of temperature, and to compute the adjusted values of the observations. The values for the association constants of the ion pairs [CaHPO4]° and [CaH2PO4]+, Kx and Ky respectively, were taken from the earlier work (table {12}). The weighted sum of squares of residuals of four observations per system (concentration of total calcium, Ca, and total phosphorus, P, initial phosphoric acid concentration, P0, and pH) was minimized subject to three condition functions: saturation with respect to β-Ca3(PO4)2, congruent dissolution of this salt, and electroneutrality.2 Separate adjustments were first made at each temperature to establish the trend of the variation in Ks, and to check the appropriateness of the weight assignments. A final run was made with the combined data, in which Ks was computed by the least squares estimation of the coefficients Aj in the expression ln Ks = A1/T + A2 + A3T, with T the temperature in Kelvins (eq. {16}).
Table 12.
Results of preliminary calculations
| °C | Number of functions (r) |
Number of points (N) |
f c | Sd × 104 | Ks × 1029 |
|---|---|---|---|---|---|
| 5 | a3 | 8 | 23 | 1.02 | 0.970 |
| 15 | 3 | 7 | 20 | 0.944 | 1.69 |
| 25 | 3 | 9 | 26 | .936 | 1.19 |
| 37 | b2 | 11 | 21 | .996 | 0.283 |
Saturation, electroneutrality and congruent dissolution.
Saturation and congruent dissolution.
Degrees of Freedom =Nr − 1.
Standard deviation.
3.1. Balance Equations, Solubility Product, and Activity Coefficients
The equations of mass balance are given by eqs {1} to {4}. Activity coefficients and ionic strength are defined in eqs {10} and {11a}. (Only the Debye-Hückel (D. – H.) type coefficients are used in this report.) The ionic activity product is defined for β-Ca3(PO4)2 as
| (1) |
where the first factor (activity of ionic calcium) and the second (activity of orthophosphate ion) are defined as follows:
| (2a) |
| (2b) |
The quantities gCa, k3, and N are defined in the equations of [12] already referred to; (H+) = 10−pH, and τ is the sum of ion pair concentrations, eq {8}. The apparent solubility product, , was calculated taking τ to be zero.
3.2. Condition Functions, Parameters, and Standard Deviation
As mentioned above, each system was required to satisfy three (two at 37 °C) conditions. The electroneutrality condition is given by eq {14}. The other two conditions are defined here as:
(1) Saturation with respect to β-Ca3(PO4)2
| (3) |
where the activities are given by eqs (2a) and (2b); (2) Congruent dissolution of β-Ca3(PO4)2
| (4) |
where R is the expected value of the ratio, 3/2.
Since the ion pair association constants were not subject to adjustment in these calculations, the number of constants is just one (Ks); the number of adjustable parameters (p) is one or three corresponding to separate (ln Ks = A2) or combined (ln Ks = A1/T + A2 + A3T) data adjustments, respectively. (See sec. {3.5b}.) The standard deviation is given by eq {22}, with the degrees of freedom, Nr-p, in that equation replaced by ΣtNtrt-p. Here Nt and rt are the number of systems and condition functions, respectively, at temperature t.
4. Results
4.1. Solubility and Solubility Product
The compositions of saturated β-Ca3(PO4)2 solutions at 5, 15, 25, and 37 °C are summarized in tables 1 through 4. Congruent dissolution is indicated by the smallness of the variation in the Ca:(P−P0) ratio about the expected value 1.5. Column 5 exhibits the values of the apparent solubility product, (no ion pairs assumed); there is no discernible trend towards a minimum, in contrast to for CaHPO4 · 2H2O [12]. Its lower solubility, which reduces the concentrations of the ion pairs, along with the restricted range of pH values available for the β–Ca3(PO4)2 data, make it difficult to establish the existence of a minimum. The values of KTC as computed with the unadjusted data and appropriate values of the ion pair concentrations, eq (1), are shown in the last column of the tables as .
Table 1.
Solubility of β-tricalcium phosphate at 5 °C Unadjusted quantities
| Initial Acid P0 M ×103 |
Composition of equil. Solns. |
× 1029 |
×1029 |
|||
|---|---|---|---|---|---|---|
| pH | Ca M ×103 |
P M×103 |
||||
| 0.197 | 7.230 | 0.338 | 0.410 | 1.59 | 1.13 | 0.86 |
| .590 | 6.776 | .712 | 1.057 | 1.52 | 1.88 | 1.35 |
| .590 | 6.758 | .684 | 1.033 | 1.54 | 1.40 | 1.02 |
| .986 | 6.567 | 1.032 | 1.666 | 1.52 | 2.25 | 1.60 |
| .788 | 6.584 | 0.834 | 1.344 | 1.50 | 0.97 | 0.72 |
| 1.38 | 6.353 | 1.29 | 2.26 | 1.47 | 1.21 | .88 |
| 1.66 | 6.300 | 1.54 | 2.65 | 1.56 | 1.66 | 1.20 |
| 1.66 | 6.291 | 1.52 | 2.66 | 1.52 | 1.49 | 1.08 |
Table 4.
Solubility of β-tricalcium phosphate at 37 °C Unadjusted quantities
| Initial
Acid Po M × 103 |
Composition of equil. solns. | × 1029 |
×1029 |
|||
|---|---|---|---|---|---|---|
| pH | Ca M × 103 |
P M × I03 |
||||
| 0.197 | 6.909 | 0.226 | 0.340 | 1.58 | 0.295 | 0.253 |
| .197 | 6.891 | .243 | .351 | 1.58 | .335 | .287 |
| .392 | 6.612 | .371 | .625 | 1.59 | .378 | .322 |
| .590 | 6.414 | .499 | .903 | 1.59 | .344 | .293 |
| .590 | 6.405 | .507 | .931 | 1.49 | .352 | .300 |
| .788 | 6.249 | .670 | 1.262 | 1.41 | .360 | .308 |
| .986 | 6.146 | .799 | 1.533 | 1.46 | .347 | .298 |
| .986 | 6.136 | .794 | 1.527 | 1.47 | .311 | .267 |
| 1.38 | 5.993 | 1.05 | 2.06 | 1.54 | .329 | .283 |
| 1.66 | 5.894 | 1.26 | 2.47 | 1.56 | .315 | .272 |
| 1.66 | 5.889 | 1.25 | 2.51 | 1.47 | .309 | .267 |
Table 2.
Solubility of β-tricalcium phosphate at 15 °C Unadjusted quantities
| Initial
Acid P0 M ×103 |
Composition of equil. solns. | < × 1029 |
×1029 |
|||
|---|---|---|---|---|---|---|
| pH | Ca M ×103 |
P M ×103 |
||||
| 0.205 | 7.251 | 0.336 | 0.421 | 1.56 | 2.96 | 2.44 |
| .415 | 6.896 | .537 | .759 | 1.56 | 2.69 | 2.20 |
| .829 | 6.564 | .859 | 1.377 | 1.57 | 2.22 | 1.81 |
| .829 | 6.558 | .843 | . 1.362 | 1.58 | 1.96 | 1.61 |
| 1.04 | 6.460 | 1.04 | 1.68 | 1.62 | 2.32 | 1.89 |
| 1.04 | 6.458 | 1.08 | 1.72 | 1.59 | 2.60 | 2.11 |
| 2.07 | 6.081 | 1.79 | 3.22 | 1.56 | 1.29 | 1.07 |
Table 3.
Solubility of β-tricalcium phosphate at 25 °C Unadjusted quantities
| Initial
Acid Po M ×103 |
Composition of equil. solns. | ×1029 |
×1029 |
|||
|---|---|---|---|---|---|---|
| pH | Ca M ×103 |
P M × l03 |
||||
| 0.110 | 7.391 | 0.199 | 0.229 | 1.67 | 1.11 | 0.97 |
| .200 | 7.063 | .295 | .397 | 1.50 | 1.09 | .95 |
| .816 | 6.455 | .795 | 1.346 | 1.50 | 1.56 | 1.33 |
| .816 | 6.443 | .809 | 1.338 | 1.55 | 1.47 | 1.25 |
| .816 | 6.430 | .793 | 1.330 | 1.54 | 1.23 | 1.06 |
| 1.21 | 6.305 | 1.06 | 1.88 | 1.58 | 1.80 | 1.52 |
| 1.60 | 6.177 | 1.36 | 2.48 | 1.55 | 1.98 | 1.68 |
| 2.03 | 6.031 | 1.69 | 3.16 | 1.50 | 1.57 | 1.34 |
| 2.29 | 5.974 | 1.88 | 3.52 | 1.53 | 1.52 | 1.29 |
Tables 5 through 8 summarize the data adjustments as found for the combined data. The ionic strength, μ, is shown in column 5. The last two columns of these tables illustrate the effectiveness of the adjustment procedure. The Ca:(P−P0) ratios have the expected value of 1.5. The adjusted values of KTC at temperature T in the last column are in every case the same (to five digits or better) as the value of the constant Ks given by the adjustment for that temperature. To a sufficient approximation,
| (5) |
Values of log Ks and Ks, and their standard errors at the four temperatures are exhibited in table 9. (The standard error of the adjustment is discussed in section 5.1.)
Table 5.
Solubility of β-tricalcium phosphate at 5 °C Adjusted quantities
| Initial
Acid Po M ×103 |
Composition of equil. solns | μ ×103 | KTc × 1029 | |||
|---|---|---|---|---|---|---|
| pH | Ca M × I03 |
P M × I03 |
||||
| 0.203(3)a | 7.267(10) | 0.321(4) | 0.417(6) | 1.11 | 1.50 | 0.972 |
| .597(9) | 6.754(9) | .674(8) | 1.046(15) | 2.13 | 1.50 | .972 |
| .591(9) | 6.758(9) | .670(8) | 1.038(15) | 2.11 | 1.50 | .972 |
| .982(15) | 6.521(9) | .989(13) | 1.642(24) | 3.01 | 1.50 | .972 |
| .798(12) | 6.618(9) | .840(11) | 1.358(19) | 2.59 | 1.50 | .972 |
| 1.383(21) | 6.361(9) | 1.308(17) | 2:255(32) | 3.90 | 1.50 | .972 |
| 1.642(25) | 6.280(9) | 1.513(20) | 2.651 38) | 4.47 | 1.50 | .972 |
| 1.645(25) | 6.280(9) | 1.515(20) | 2.655(38) | 4.48 | 1.50 | .972 |
Standard errors in the last digit(s) calculated by eq {26}.
Table 8.
Solubility of β-tricalcium phosphate at 37 °C Adjusted quantities
| Initial
Acid Po M ×103 |
Composition of equil. solns. | μ ×103 | KTC×1029 | |||
|---|---|---|---|---|---|---|
| pH | Ca M ×103 |
P M ×103 |
||||
| 0.195(2) | 6.924(7) | 0.225(3) | 0.345(2) | 0.792 | 1.50 | 0.283 |
| .196(2) | 6.891(7) | .240(3) | .356(2) | .823 | 1.50 | .283 |
| .389(3) | 6.599(7) | .365(5) | .632(4) | 1.22 | 1.50 | .283 |
| .585(5) | 6.411(7) | .494(6) | .914(6) | 1.61 | 1.50 | .283 |
| .591(5) | 6.398(6) | .507(6) | .928(6) | 1.64 | 1.50 | .283 |
| .794(7) | 6.239(6) | .675(8) | 1.244(8) | 2.12 | 1.50 | .283 |
| .989(8) | 6.140(6) | .801(10) | 1.524(9) | 2.51 | 1.50 | .283 |
| .989(8) | 6.142(6) | .799(10) | 1.521(9) | 2.50 | 1.50 | .283 |
| 1.377(11) | 5.993(6) | 1.041(13) | 2.071(13) | 3.24 | 1.50 | .283 |
| 1.648(14) | 5.898(6) | 1.252(16) | 2.482(15) | 3.85 | 1.50 | .283 |
| 1.661(14) | 5.895(6) | 1.259(16) | 2.500(15) | 3.87 | 1.50 | .283 |
Table 9.
Temperature dependence of the solubility product
| log Ks = −45723.26/T+
287.4536 −.546763T [eq(5)] | ||
|---|---|---|
| °C | logKs + 29 | Ks× 1029 |
| 5 | −0.0121 a(0.026) |
0.972 (0.059) |
| 15 | 0.2251 (0.020) | 1.679 (0.076) |
| 25 | 0.0796 (0.020) | 1.201 (0.056) |
| 37 | −0.5481 (0.016) | 0.283 (0.01l) |
Standard error.
Table 6.
Solubility of β-tricalcium phosphate at 15 °C Adjusted quantities
| Initial
Acid Po M ×103 |
Composition of equil. solns. | μ ×103 | KTC × 1029 | |||
|---|---|---|---|---|---|---|
| pH | Ca M × 103 |
P M ×103 |
||||
| 0.204(3) | 7.216(9) | 0.320(6) | 0.417(6) | 1.13 | 1.50 | 1.68 |
| .415(7) | 6.876(9) | .513(6) | .758(10) | 1.72 | 1.50 | 1.68 |
| .823(13) | 6.557(8) | .848(10) | 1.389(20) | 2.69 | 1.50 | 1.68 |
| .819(13) | 6.560(8) | .844(10) | 1.382(19) | 2.68 | 1.50 | 1.68 |
| 1.030(16) | 6.452(8) | 1.012(13) | 1.705(24) | 3.16 | 1.50 | 1.68 |
| 1.045(16) | 6.456(8) | 1.024(13) | 1.727(24) | 3.20 | 1.50 | 1.68 |
| 2.074(31) | 6.124(8) | 1.825(24) | 3.290(46) | 5.49 | 1.50 | 1.68 |
Table 7.
Solubility of β-tricalcium phosphate at 25 °C Adjusted quantities
| Initial Acid
Po M × l03 |
Composition of equil. solns. | μ ×103 | KTC×1029 | |||
|---|---|---|---|---|---|---|
| pH | Ca M ×103 |
P M ×103 |
||||
| 0.108(2) | 7.412(10) | 0.198(2) | 0.240(3) | 0.728 | 1.50 | 1.20 |
| .203(2) | 7.093(9) | .297(3) | .401(5) | 1.04 | 1.50 | 1.20 |
| .810(12) | 6.442(8) | .797(10) | 1.341(19) | 2.53 | 1.50 | 1.20 |
| .813(12) | 6.440(8) | .800(10) | 1.347(19) | 2.53 | 1.50 | 1.20 |
| .812(12) | 6.441(8) | .799(10) | 1.344(19) | 2.53 | 1.50 | 1.20 |
| 1.166(18) | 6.271(8) | 1.074(14) | 1.882(27) | 3.33 | 1.50 | 1.20 |
| 1.550(23) | 6.136(8) | 1.371(18) | 2.464(36) | 4.19 | 1.50 | 1.20 |
| 2.001(30) | 6.015(8) | 1.717(23) | 3.146(45) | 5.19 | 1.50 | 1.20 |
| 2.249(33) | 5.960(8) | 1.907(26) | 3.521(51) | 5.74 | 1.50 | 1.20 |
The temperature dependence of the solubility product is illustrated in figure 1, where the smooth curve was obtained with the use of eq (5). The values of Ks from preliminary independent adjustments at the four temperatures (table 12) are plotted and are practically identical with the values in table 9. The 95 percent confidence intervals (horizontal lines) were computed at each temperature from the standard errors in table 9. The KTC values plotted in the figure as experimental points are those listed in column 6 of tables 1 through 4. (The values of KTC at 37 °C, covering the narrow range (0.25 to 0.32) × 1029, have been omitted for clarity.)
Figure 1.
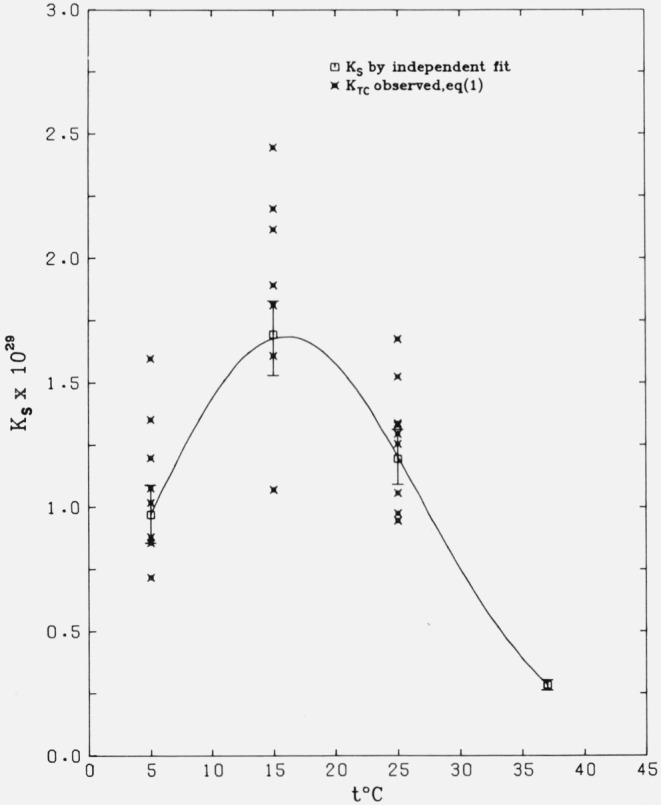
Temperature dependence (eq (5)) of the solubility product of β-Ca3(PO4)2.
Points are the “experimental” values. See text. The 95 percent confidence intervals are shown as vertical lines.
Figure 2 shows the solubility isotherms for β-Ca3(PO4)2 in terms of log (total calcium concentration) as a function of pH. The smooth curves were obtained in a separate calculation using appropriate values of Ks (table 9), Kx and Ky (table {12}), and a sequence of pH values (arbitrary) covering the range of interest. The adjusted values of Ca and pH, tables 5–8, are a subset on the curves but are not indicated. All of the experimental points (tables 1–4) are plotted in the figure. It is evident from the relative positions of the curves, in spite of some ambiguity in the data for 15 °C, that the solubility of this salt decreases with increasing temperature; in this respect its behavior resembles that of CaHPO4 · 2H2O [12] and CaHPO4 [13].
Figure 2.

Calculated isotherms of β-Ca3(PO4)2 at 5, 15, 25, and 37 °C.
Points represent experimental data.
4.2. Ion Pairs
Table 10 gives the concentrations at 25 °C of the ion pairs [CaHPO4]° and [CaH2PO4]+ as found by the adjustment. The percentage of bound calcium (sum of pair conc. × 100/total calcium concentration) is also shown. The values for the other temperatures are similar. Two points may be noted in reference to the earlier results from [12]. The concentrations of both pairs remain very small relative to the total calcium concentration over the range of observed pH. The maximum bound calcium was 8 percent (5 °C) in contrast to a figure of over 20 percent for the more soluble salt, CaHPO4 · 2H2O. An attempt to estimate the values of the association constants Kx and Ky in the adjustment of the β-Ca3(PO4)2 data was not successful under these conditions. Secondly, in contrast to the pH-independent values of the concentration X° of [CaHPO4]° expected and found for solutions saturated with respect to the solids CaHPO4 · 2H2O [12] and CaHPO4 [13], the values reported here are pH-variable as indicated in table 10. This variation is predictable, since the pH-independence of X° is a consequence of the pH-invariance of the “true” activity product (Ca2+) (HPO42−) in solutions saturated with CaHPO4 · 2H2O or CaHPO4 (eq {6}); on the contrary, this product is pH-variable in saturated solutions of β-Ca3(PO4)2.
Table 10.
Concentration of ion pairs and bound calcium at 25 °C
| pH |
M ×103 |
M ×103 |
l00τa/Ca |
|---|---|---|---|
| 7.412 | 0.0058 | 0.0001 | 2.95 |
| 7.093 | .0100 | .0003 | 3.46 |
| 6.442 | .0284 | .0034 | 3.99 |
| 6.440 | .0285 | .0034 | 3.99 |
| 6.441 | .0284 | .0034 | 3.99 |
| 6.271 | .0368 | .0066 | 4.04 |
| 6.136 | .0451 | .0111 | 4.10 |
| 6.015 | .0539 | .0177 | 4.17 |
| 5.960 | .0584 | .0219 | 4.21 |
τ is sum of ion pair concentrations.
4.3. Thermodynamic Quantities
The dissolution of β – Ca3(PO4)2 is described by the reaction
| (6) |
The quantities ΔG°, ΔS°, ΔH° and their associated standard errors3 were calculated for this reaction from eq (5) for log Ks following the procedure of eqs {27–29}. The results are tabulated in table 11.
Table 11.
Thermodynamic quantities
| °C | Δ
G° kcala/mol |
ΔH° kcal/mol |
ΔS° cal/mol · K |
|---|---|---|---|
| 5 | 36.9 | 15.7 | −76.5 |
| b (0.03) | (1.4) | (5.0) | |
| 15 | 37.9 | 1.5 | −127 |
| (.03) | (.7) | (2) | |
| 25 | 39.4 | −13.2 | −177 |
| (.03) | (.5) | (1) | |
| 37 | 41.9 | −31.4 | −237 |
| (.02) | (1.4) | (4) |
1 kcal = 4184.0 joules.
Standard error.
5. Discussion
5.1. Standard Deviation. Weights and Goodness of Fit
The adequacy of the adjustment results was examined by several criteria. Three of them are discussed here and the remainder in the following section. In the first place the exploratory adjustments for the four temperature sets were utilized to check for uniformity of the estimated standard deviation (s, eq {22}) among the sets. The results for these runs (using the final weights described below) are summarized in table 12. Secondly, assuming the correctness of the physical model, the x2 statistic with f degrees of freedom (sec. 3.2) was used to judge the overall adequacy of the weights assignments. Since the expected value of x2 = f, and the test value of , where s0 = 1 × 10⁻⁴ is the estimate of s used in defining the weights (eq {12}), a poor assignment of errors will yield a value of s that may differ markedly from s0; that is, the hypothesis χ2 = f would be rejected. In view of the variability in the initial KTC values (fig. 1) at 5, 15, and 25 °C, the weights at these temperatures were computed from the following errors assigned to the observables: Ca, 3.5 percent; P (and P0), 2.5 percent; pH, 0.020 (absolute). The (smaller) errors assigned to the 37 °C data were the same as those used for CaHPO4 · 2H2O [12]. With this assignment of weights, s2 for the final adjustment of the combined data has the value 0.938 × 10⁻⁸, with f = 3 × (8+ 7 + 9) + 2 × 11 − 3 = 91. Since the critical values of (95%), 66.5 and 119.3, bracket the value of f, the assigned weights may be considered reasonable, and a 95 percent confidence interval for s2 is (0.73 < s2 < 1.31) × 10−8. The corresponding values of s and its dispersion [15] are 0.968 × 10⁻⁴ and 0.072 × 10⁻⁴; the confidence interval for s is (0.86 < s < 1.14) × 10−4.
An additional check was made by adopting an alternative model: the combined data were adjusted with ion pairs assumed absent and weights as described above. As might be anticipated from the very low ion pair concentrations listed in table 10, the resulting standard deviation of 1.06 × 10⁻⁴ hardly differs from the value reported above, 0.968 × 10⁻⁴. However, the residuals at 5° and 15 °C showed considerably less randomness in the distribution of signs, and somewhat larger magnitudes, with this alternative model. The data are best described by the ion pair model.
5.2. Solubility Isotherms
The experimental design underlying the data reported herein was intended to assure the attainment of equilibrium of solutions of variable initial phosphoric acid concentration with solid β-Ca3(PO4)2 of known purity. The three condition functions adopted for the adjustment assume (i) equilibrium (saturation), (ii) congruent dissolution, (i.e., dissolution, without the formation of extraneous solid phases) and (iii) electroneutrality (i.e., all charged species accounted for). If this model correctly describes the data, and if the errors are random, the experimental points plotted as in figure 2 should be close to the computed isotherms and show a random scatter about the curves. This implies that at each temperature the relative residuals (residual/observed value) should be small (< 0.03) and have a random distribution of signs. Alternatively, the standardized residuals (not reported) were computed and, with a few exceptions, satisfy these criteria. A glance at figure 2 shows that most of the exceptions with respect to size occur in the 15 °C data. In addition, these experimental points seem to define a curve that is somewhat skewed with respect to the computed 15 °C curve. It is possible that the saturation condition was not satisfied at some of these points.
The data for 37 °C presented a different problem. In spite of the unusually narrow range of initial KTC values, the attempt to adjust these data using all three condition functions gave an unsatisfactory value of s and uniformly large and negative relative residuals for calcium. Examination of the initial electroneutrality values showed them to be almost uniformly negative and larger in magnitude by a factor of at least 10 than the values computed at the other temperatures. The reason for this is obscure. Two possible explanations are (1) systematic errors in the analysis for calcium and (2) the presence of a foreign ion of positive charge. Considering the experimental procedures and the fact that the solid β-Ca3(PO4)2 at all four temperatures was from the same batch of material, the second possibility seems very unlikely. In any event, the omission of the electroneutrality condition produced acceptable numerical results which were confirmed in the following manner. An adjustment (not reported) was made with the 37 °C data excluded; the adjusted values of Ks, 0.970, 1.694, and 1.193 × 10⁻²⁹ at 5, 15, and 25 °C, respectively, are very close to those reported in table 9 for these temperatures. The corresponding equation for log Ks, similar to eq (5), predicts the value 0.267 × 10⁻²⁹ for Ks at 37 °C, in good agreement with that found for the 37 °C data alone (table 12).
5.3. Stoichiometric Composition of β-Ca3(PO4)2
It has been suggested [16, 17] that the Ca/P ratio in whitlockite may be 10/7 rather than 3/2. Inspection of tables 1–4 shows that the value of 10/7 lies well below most of the listed Ca:(P − P0) ratios. Wallace and Brown [18] have shown by the pyrolysis of calcium orthophosphates that the ratio in whitlockite-like materials prepared at high temperatures is very close to 3/2. A recalculation of their results, using weights derived from their published standard errors, yielded a weighted mean ratio of 1.500, standard error of the mean, 0.011, and a 95 percent confidence interval on 14 degrees of freedom, 1.476 < Ca/P < 1.524. In order to further test the value of the ratio, using the solubility data of this paper, an additional adjustment was run, in which the ratio R in eq (4) was treated as an additional adjustable constant. The result was , , and s2 = 0.926 × 10⁻⁸ (90 degrees of freedom), which is very close to the value, 0.938 × 10⁻⁸ found above (sec. 5.1). Using the t statistic, both R = 3/2 and R = 10/7 were tested at the 95 percent level against ; the hypothesis R = 10/7 was easily rejected, whereas R = 3/2 was acceptable. These results confirm the chemical findings of Wallace and Brown [18] and the crystal structure analysis [7, 19] of the thermally prepared form of this salt. The latter showed that the apparent anomaly in the unit-cell contents is explained by the fact that one of the calcium sites is only one-half occupied.
5.4. Comparison With Reported Data
We are unaware of any previous attempts to determine the solubility product of well-characterized β-Ca3(PO4)2. Bjerrum’s compilation [20] contains several references [21–24], all but one of which pertain to work done long before the chemistry of the sparingly soluble calcium phosphates was well understood. In particular, preparations described as Ca3(PO4)2 very probably contained the less soluble salt, Ca5(PO4)3OH (hydroxyapatite). A more recent report [24] gives 2.0 × 10⁻²⁹ as the value of the solubility product [Ca2+]3[PO43−]2 at circa 20 °C; no details on the material employed are available to us. From the thermochemical data published by the National Bureau of Standards [25, 26, 27], including a standard heat of formation at 25 °C for β-Ca3(PO4)2 equal to −928.5 kcal/mol, we derive the unreasonably small value KTC (25 °C) = 2.0 × 10⁻³³. The uncertainty in a solubility product derived from a variety of thermochemical data is known to be considerable and the direct measurement of solubility of well-characterized material as reported here may be expected to yield a value of KTC subject to much less uncertainty.
5.5. Chemical Significance
Isotherms for the data at 25 °C of several calcium phosphates in the ternary system are plotted in figure 3. It can be seen that β-Ca3(PO4)2 is second only to Ca5(PO4)3OH in stability at pH’s above 6.36. The calculated pH’s of the singular points at 25 °C for β-Ca3(PO4)2 with CaHPO4 · 2H2O and CaHPO4 are 5.88 and 6.36, respectively.
Figure 3.

Calculated isotherms at 25 °C illustrating the relative stability of several calcium phosphates.
DCPD, CaHPO4 · 2H2O [12]; DCPA, CaHPO4 [13]; OCP, [28]; TCP, β-Ca3(PO4)2; HAP, Ca5(PO4)3OH [29].′
In view of the indication that small cations such as Mg2+ and Fe2+ stabilize whitlockite and β-Ca3(PO4)2, it seems reasonable to expect that under certain aqueous conditions the stability of these compounds may be even greater than revealed by our results for pure β-Ca3(PO4)2.
Acknowledgments
This investigation was supported in part by Research Grant DE 00572 to the American Dental Association from the National Institute of Dental Research and is part of the dental research program conducted by the National Bureau of Standards in cooperation with the American Dental Association Health Foundation.
Footnotes
Figures in brackets indicate the literature references at the end of this paper.
The electroneutrality condition was omitted for the 37 °C data. See discussion.
The elements of the moment matrix of the parameter set (Aj), the numerical coefficients in eq {16}, needed for these calculations are available from the adjustment results.
6. References
- [1].Jensen A. T., and Rowles S. L., Acta Odontologica Scand. 16, 121 (1957). [Google Scholar]
- [2].Leung S. W., and Jensen A. T., Int. Dent. J. 8, 613 (1958). [Google Scholar]
- [3].Höhling H. J., and Katterback R., Dtsch. Zahnärztl. Z. 24, 37 (1969). [PubMed] [Google Scholar]
- [4].Llory H., and Frank R.M., Actual Odont. Stomatol. 88, 507 (1969). [PubMed] [Google Scholar]
- [5].Takuma S., Sunohara H., Watanabe H., and Yama K., Bull. Tokyo Dent Coll. 10, 173 (1969). [PubMed] [Google Scholar]
- [6].Höhling H. J., Fearnhead R. W., and Lotter G., German Med. Monthly, Vol. XIII, 135 (1968). [PubMed] [Google Scholar]
- [7].Dickens B., Schroeder L. W. and Brown W. E., J. Solid State Chem. (In press). [Google Scholar]
- [8].Moreno E. C., and Brown W. E., (Abstract) Internat. Assoc. Dental Res., 46th Gen. Meeting, San Francisco: (1968). [Google Scholar]
- [9].Moreno E. C., Patel J. M., Gregory T. M., and Brown W. E., (Abstract) Internat. Assoc. Dental Res., 48th Gen. Meeting, New York: (1970). [Google Scholar]
- [10].Gregory T. M., Moreno E. C., and Brown W. E., (Abstract) Internat. Assoc. Dental Res., 45th Gen. Meeting. Washington: (1967). [Google Scholar]
- [11].Moreno E. C., Gregory T. M., and Brown W. E., J. Res. Nat. Bur. Stand. (U.S.), 72A, (Phys, and Chem.), No. 6, 773–782 (Nov.–Dec. 1968). [DOI] [PMC free article] [PubMed] [Google Scholar]
- [12].Gregory T. M., Moreno E. C., and Brown W. E., J. Res. Nat. Bur. Stand. (U.S.), 74A, (Phys. and Chem.), No. 4, 461–475 (July–Aug. 1970). [DOI] [PMC free article] [PubMed] [Google Scholar]
- [13].McDowell H., Brown W. E., and Sutler J. R., Inorg. Chem. 10, 1638 (1971). [Google Scholar]
- [14].Gee A., and Dietz V. R., J. Amer. Chem. Soc. 77, 2961 (1955). [Google Scholar]
- [15].Arley N. and Buch K. R., Introduction to the Theory of Probability and Statistics, Ch. 12 (John Wiley & Sons, New York, N.Y: 1950). [Google Scholar]
- [16].Mackay A. L., Dissertation (Unpublished, University of London, England: 1952). [Google Scholar]
- [17].Keppler U., Neues Jahrbuch Mineral. 6, 171 (1965). [Google Scholar]
- [18].Wallace B. M., and Brown W. E., J. Dent. Res. 50, 343 (1971). [DOI] [PubMed] [Google Scholar]
- [19].Dickens B., and Brown W. E., Tschermaks Min. Petr. Mitt. 16, 79 (1971). [Google Scholar]
- [20].Bjerrum J., Stability Constants (The Chemical Society, London: 1958). [Google Scholar]
- [21].Bassett H., Z. Anorg. Chem. 59, 1 (1908). [Google Scholar]
- [22].Bassett H., J. Chem. Soc. 111, 620 (1917). [Google Scholar]
- [23].Holt L. E., LaMer V. K., and Chown H. B., J. Biol. Chem. 64, 509 (1925). [Google Scholar]
- [24].Zharovskii F. G., Trudy Komissii Analit. Khim. Akad. Nauk. SSSR 3, 101 (1951). [Google Scholar]
- [25].Nat. Bur. Stand. (U.S.), Circ. 500 (1952). [Google Scholar]
- [26].Nat. Bur. Stand. (U.S.), Tech. Note 270–3, 268 pages (Jan. 1968).
- [27].Nat. Bur. Stand. (U.S.), Tech. Note 270–6, 119 pages (Nov. 1971).
- [28].Moreno E. C., Brown W. E., and Osborn G., Soil Sci. Soc. Amer. Proc. 24, 99 (1960). [Google Scholar]
- [29].McDowell H., Wallace B. M., and Brown W. E., (Abstract) Internat. Assoc. Dent. Res., 47th Gen. Meeting, Houston, Tex: (1969). [Google Scholar]