Abstract
The reproducibility of the International Practical Temperature Scale of 1968 (IPTS–68) in the region of 13.81 K to 90.188 K using standard platinum resistance thermometers is discussed. The effect of errors above 0 °C on the calibration between 13 and 90 K is analyzed. Calibrations resulting from least squares and “fixed point” treatment of the data are compared. The results show that in general the NBS–IPTS–68 temperature scale maintained at the National Bureau of Standards (NBS) by reference standard platinum resistance thermometers is transferred to thermometers calibrated at the NBS within a few tenths of a mK between about 20 and 90.188 K and within about ±1 mK between 13.81 and 20 K. Agreements within a few mK are shown between the observed values of temperatures, employing platinum resistance thermometers calibrated in terms of the NBS–IPTS–68 scale, and the values of temperatures of the fixed points in the region 13.81 to 90.188 K given in the text of the IPTS–68.
Keywords: International Practical Temperature Scale, NBS-IPTS-68, NBS-1955 provisional scale, platinum resistance thermometer
1. Introduction
Between 13.81 K (−259.34 °C) and 903.89 K (630.74 °C) the International Practical Temperature Scale of 1968 [1],1 referred to hereafter as IPTS–68, is defined by nine fixed points and specified interpolation formula to relate the temperature and the resistance ratio,
of the particular standard platinum resistance thermometer (prt). The defining fixed points are based on equilibrium states between phases of pure substances. These equilibrium states and their assigned values of temperature on the IPTS–68 are given in table 1. The thermometer resistor must be annealed pure platinum, supported in a “strain-free” manner and have a value of W at 100 °C not less than 1.39250.
Table 1.
Defining fixed points of the IPTS–68 in the platinum resistance thermometer range
| Equilibrium Statea, b, c, d | Assigned value of the IPTS−68 temperature | |
|---|---|---|
| T, K | t, °C | |
| e–H2, TP | 13.81 | −259.34 |
| e–H2, BP (33,330.6 N/m2) | 17.042 | −256.108 |
| e–H2, NBP | 20.28 | −252.87 |
| Ne, NBP | 27.102 | −246.048 |
| O2, TP | 54.361 | −218.789 |
| O2, NBP | 90.188 | −182.962 |
| H2O, TP | 273.16 | 0.01 |
| H2O, NBP or | 373.15 | 100 |
| Sn, FP | 505.1181 | 231.9681 |
| Zn, FP | 692.58 | 419.58 |
Except for the triple points and one e-H2 point at 17.042 K the assigned values of temperature are for equilibrium states at a pressure of one standard atmosphere (101,325 N/m2). In the realization of the fixed points small departures from the assigned temperatures occur as a result of small deviations from the specified pressure at the point of immersion of the thermometer. Adjustment is made for these small temperature differences.
TP = triple point, BP = boiling point, NBP = normal boiling point, FP = freezing point, and e-H2 = equilibrium hydrogen.
The water used should have the isotopic composition of ocean water.
The neon used should have the normal isotopic composition: 0.909 mol20Ne, 0.0808 mol22Ne, and 0.0026 mol21Ne.
Below 0 °C the W versus temperature relation in between the fixed points is given by
| (1) |
where W*(T) is a reference function defined by
| (2) |
and ΔW(T) is a deviation function which is a polynomial in T [2]. (The coefficients Ai of eq (1) are given in reference [1].) The range 13.81 to 273.15 K is divided into four subranges, each with its specified deviation function. The coefficients of the polynomials are determined from ΔW(T) obtained by calibration at the fixed points (see sec. 4 for further discussion) [1]. From 0 to 630.74 °C the values of temperature t are defined by
| (3) |
where
| (4) |
(For simplification, the unit °C has been omitted from eqs (3) and (4).) The thermometer constants R(0 °C), α, and δ are determined from resistance measurements at the triple point (TP) of water, the normal boiling point (NBP) of water (or the freezing point of tin), and the freezing point of zinc. By definition t and T are related by t = T − 273.15 K.
At the National Bureau of Standards (NBS) the defining fixed points above 0 °C are maintained and are employed regularly in the calibration of prt’s. The defining fixed points below 0 °C are “maintained” at present by reference standard prt’s of the capsule type. This paper describes the NBS–IPTS–68 temperature scale between 13.81 and 90.188 K maintained by the reference standard prt’s, shows the degree of agreement of the scale with the IPTS–68 in terms of recently published measurements employing prt’s calibrated on the scale, and demonstrates the reproducibility of the NBS–IPTS–68 scale by prt’s that have been received for calibration at the NBS. The cryostat in which the calibrations are performed is described. The reduction of the calibration data by a least squares method is compared with a “fixed point” method.
2. NBS–IPTS–68 Scale
The following is a brief history and description of the IPTS–68 temperature scale between 13.81 and 90.188 K now being maintained on reference standard prt’s at the NBS. In 1939 the NBS–1939 scale [3] was established by comparing capsule type prt’s with values of temperatures that were determined by a helium gas thermometer between 10.8 and 91.4 K. Considering the apparatus that was employed at the time, the authors of the NBS–1939 scale stated, “It is hoped that the scale will be found to be in agreement with the thermodynamic scale to within ±0.02°” [3]. In 1955 the values of temperature of the NBS–1939 scale were reduced by 0.01 K because of the adoption by the Tenth General Conference on Weights and Measures in 1954 of a thermodynamic Kelvin scale that was defined by assigning the value 273.16 K to the TP of water and also on the basis of accumulated data indicating that the value of the NBP of normal hydrogen was 0.01 K too high on the NBS–1939 scale [4]. This modified scale was named the NBS–1955 scale [4]. By 1962 three other laboratories had developed provisional temperature scales between about 10 and 90 K based on gas thermometry [5,6,7,8,9,10]. To determine the relation among the existing four provisional temperature scales they were intercompared in 1964 at the Physicotechnical and Radiotechnical Measurements Institute (Moscow, U.S.S.R.) and at the National Physical Laboratory (Teddington, Middlesex, U.K.) [11]. After the four provisional scales were adjusted to a common NBP of oxygen and a common NBP of normal hydrogen, the scales were found to agree within ±0.01 between 20 K and 90 K. Between 13.81 and 90.188 K the IPTS–68 scale is based both on the results of these intercomparisons and on “best” values of temperature assigned to the defining fixed points. The new scale was intended to replace the four provisional scales, but at the time of its adoption no national laboratory could realize all five new fixed points below the NBP of oxygen. The Comité Consultatif de Thermometrie that recommended the IPTS–68 to the Comité International des Poids et Mesures to be adopted, therefore, formally recognized the use of the former provisional scales, which are highly reproducible, and published differences [12] between these scales and the IPTS–68 that would give a close approximation to the IPTS–68. The IPTS–68 scale between 13.81 and 90.188 K which is presently maintained at NBS was obtained by first adjusting the values of T(NBS–55) of the reference prt by the published differences between the IPTS–68 and the NBS–1955 scale. To obtain a smooth scale, the deviation (ΔW) between each of these adjusted values and the corresponding value of the reference function (W*) was smoothed by a least squares method using the nearest five points. These smoothed values of ΔW were added to the reference function values and the resulting table was subtabulated at 0.1 K intervals by cubic interpolation. The temperature scale represented by these tabular values will be referred to in this paper as NBS– IPTS–68 (tabular).
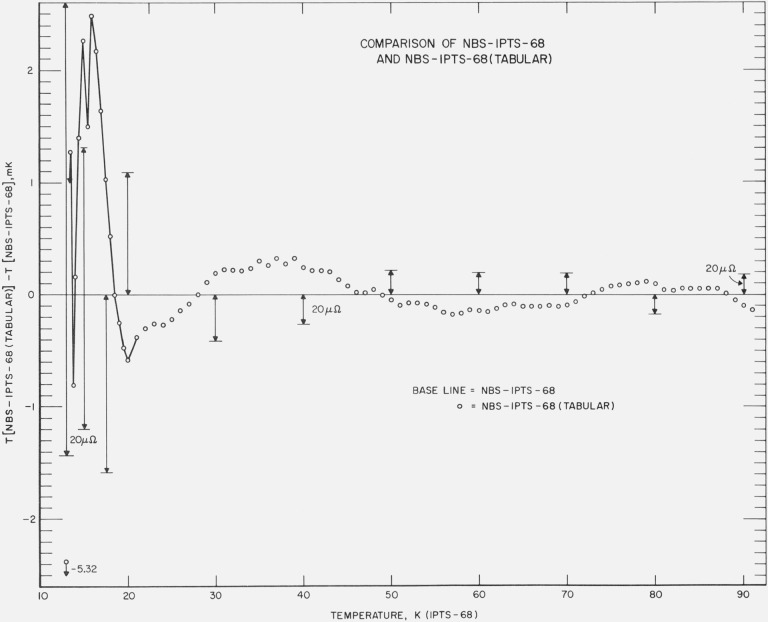
Because the NBS–IPTS–68 (tabular) scale is not convenient for computer use, the “best” IPTS–68 coefficients of the deviation functions were derived from the values of the tabular scale. This derived scale which is given in terms of the coefficients of the deviation functions will be referred to in this paper as the NBS–IPTS–68 scale. The NBS–IPTS–68 and NBS–IPTS–68 (tabular) temperature scales are compared in figure 1. The differences between the two “scales” become somewhat larger in terms of the temperature below about 20 K, but in terms of resistance the deviations are about the same over the whole temperature range. The lengths of the vertical lines represent 20 μΩ. Below 21 K the deviations,
are connected to show more clearly the general trend in the differences between the two scales. Because of the numerical smoothing procedure employed in obtaining the NBS–IPTS–68 (tabular) scale, the deviation plot exhibits some “noise.”
Figure 1. Comparison of the NBS–IPTS–68 (tabular) temperature scale with the NBS–IPTS–68 temperature scale.
NBS–IPTS–68 (tabular) is a tabular scale based on combining the NBS–1955 scale and the published differences [12] between the NBS–1955 scale and the IPTS–68 scale and numerically smoothing the adjusted scale. The NBS–IPTS–68 is based on the relation given by eq (1) and the “best” deviation functions ΔW(T) derived from NBS–IPTS–68 (tabular).
The relation between the NBS–IPTS–68 and the IPTS–68 can be assessed from measurements, e.g., at the fixed points, employing thermometers that have been calibrated in terms of the NBS scale. Table 2 lists some of the measurements that have been reported for the defining fixed points. Whenever the temperature values were reported on the NBS–1955 (or NBS–1939) scale, appropriate adjustments were made to NBS–IPTS–68 employing the published differences between IPTS–68 and NBS–1955 [12]. When the temperature value was in NBS–1939, it was first adjusted to NBS–1955 and then converted to the NBS–IPTS–68 scale. Where data were available on the other provisional scales, they were converted to the IPTS–68 employing the published differences [12]. The values of temperatures of the defining fixed points obtained on the NBS–IPTS–68 scale are in good agreement with the assigned values except for the NBP of oxygen. Inasmuch as the values on all four provisional scales are in good agreement, the oxygen NBP realized by Muijlwijk, Moussa, and van Dijk [21] may have been slightly too high. Muijlwijk, Durieux, and van Dijk [26] realized a NBP of e-H2 that is 3.7 mK higher than the value on the NBS– IPTS–68. Of the secondary reference points, the NBS– IPTS–68 values are in good agreement with the values recommended in the text of the IPTS–68 and with the values of the other provisional scales, except for the TP of neon. Since the NBS–IPTS–68 values for the TP of neon are in close agreement with the value of Tiggelman, van Rijn, and Durieux [22] that was obtained employing a prt calibrated directly with the IPTS–68 fixed points, the value recommended in the text of the IPTS–68 may be too low.
Table 2.
Comparison of observed values of temperature of some defining fixed points and secondary reference points on the various provisional temperature scales adjusted to the IPTS–68
| Equilibrium point and assigned temperature on the IPTS–68 | Temperature scalea | Temperature value |
Year of work | Reference |
|---|---|---|---|---|
| e–H2, TP | NBSb | 13.799 | 1951 | [13] |
| 13.81 K | NPL | 13.813 | 1963 | [14] |
| NBS | 13.8051 | 1971 | [15] | |
| NBS | 13.8079 | 1971 | [16] | |
| e–H2, BP | NBS | 17.04261 | 1971 | [15] |
| (25/76 atm) | ||||
| 17.042 K | ||||
| e–H2, NBP | NBSb | 20.276 | 1951 | [13] |
| 20.28 K | NBS | 20.276 | 1962 | [17] |
| NPL | 20.2796 | 1963 | [14] | |
| NBS | 20.27819 | 1971 | [15] | |
| NBS | 20.2798 | 1971 | [16] | |
| Ne, NBP | NBS | 27.099 | 1962 | [18] |
| 27.102 K | NBS | 27.103 | 1970 | [19] |
| NBS | 27.1032 | 1970 | [20] | |
| NBS | 27.103 | 1972 | [32] | |
| O2, TP | NBS | 54.3576 | 1966 | [21] |
| 54.361 K | ||||
| O2, NBP | NBS | 90.1956 | 1966 | [21] |
| 90.188 K | NBS | 90.1912 | 1966 | [21] |
| NBS | 90.1924 | 1966 | [21] | |
| PSU | 90.1928 | 1966 | [21] | |
| PSU | 90.1919 | 1966 | [21] | |
| NPL | 90.1900 | 1966 | [21] | |
| NPL | 90.1935 | 1966 | [21] | |
| PRMI | 90.1935 | 1966 | [21] | |
| PRMI | 90.1937 | 1966 | [21] | |
| PRMI | 90.1948 | 1966 | [21] | |
| Ne, TP | NBS | 24.552 | 1962 | [18] |
| 24.555 K | NBS | 24.561 | 1970 | [19] |
| NBS | 24.560 | 1970 | [20] | |
| IPTS–68c | 24.5620 | 1971 | [22] | |
| IPTS–68c | 24.5618 | 1971 | [22] | |
| N2, TP | NBS | 63.1481 | 1966 | [23] |
| 63.148 K | NBS | 63.1469 | 1966 | [23] |
| PRMI | 63.1479 | 1966 | [23] | |
| PRMI | 63.1477 | 1966 | [23] | |
| N2,NBP | NBSb | 77.3459 | 1954 | [24] |
| 77.348 K | NBS | 77.3466 | 1963 | [25] |
| NBS (1)d | 77.3493 | 1966 | [26] | |
| NBS (1)d | 77.3471 | 1966 | [26] | |
| NBS (2)d | 77.3481 | 1966 | [26] | |
| PRMI | 77.3475 | 1966 | [26] | |
| PRMI | 77.3477 | 1966 | [26] | |
| NPL (3)d | 77.3469 | 1966 | [26] | |
| NPL (3)d | 77.3473 | 1966 | [26] | |
| NPL (4)d | 77.3486 | 1966 | [26] |
NBS = NBS–IPTS–68, NPL = NPL–IPTS–68, PRMI = PRMI–IPTS–68, and PSU = PSU–IPTS–68.
Initially published on the NBS–1939 scale.
The prt was calibrated at the IPTS–68 defining fixed-points.
The number identifies the prt.
3. Design and Operation of the Cryostat
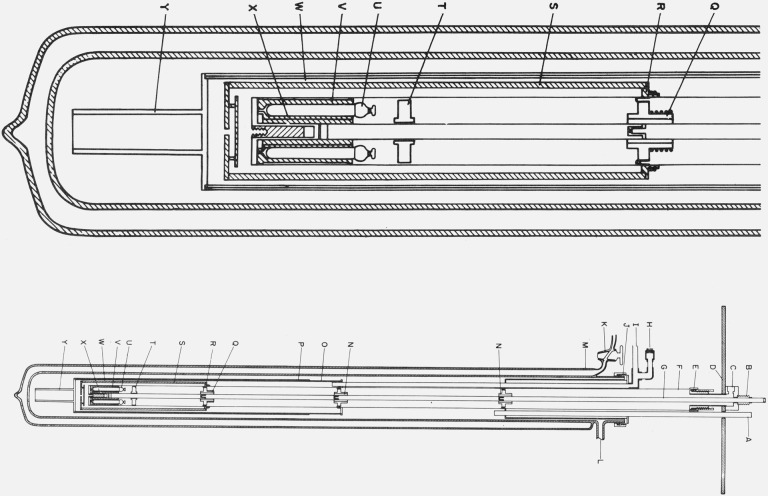
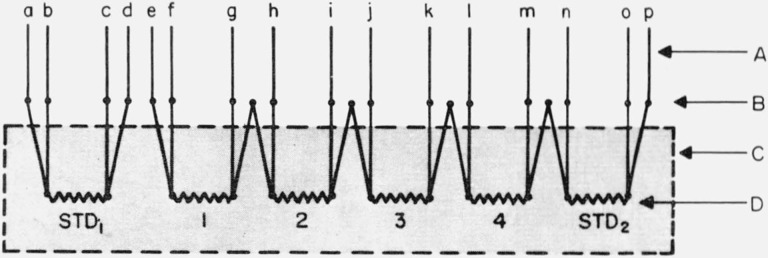
The capsule type prt’s are calibrated in terms of the standards in the cryostat shown schematically in figure 2. The copper comparison block V, shown enlarged in figure 3, has wells for six thermometers, two standards and four thermometers under test. Stopcock grease is used to enhance the thermal contact between the prt and the copper block. The wiring arrangement shown in figure 4 is employed to minimize the number of leads and, therefore, the heat transfer through the leads between the surroundings and the copper block. Five prt’s are wired with only twelve leads. The first standard is wired separately with four additional leads to allow it to be electrically isolated from the group of five prt’s. In the calibration process the resistance of the first standard and the resistance of any one of the four thermometers under test or the second standard are determined simultaneously by measurements made with two Mueller bridges by two operators.
Figure 2. Cryostat for the intercomparison of capsule type SPRT’s.
A. Guide for directing transfer tube into liquid helium Dewar.
B. Metal bellows to permit differential expansion between the central tube and the supporting thermometer block well.
C. Exit for the vacuum line and electrical leads to the thermometers, the thermocouples, and the heater on the copper thermometer block.
D. Supporting shelf.
E. Demountable “O” ring seal to the well around the thermometer block.
F. Well around the thermometer block.
G. Central tube for supporting the thermometer block.
H. Seal for the electrical leads from the vacuum can that surrounds the shield and lower portion of the thermometer block well.
I. Line from vacuum can “O”.
J. Demountable “O” ring seal to the liquid helium Dewar.
K. Glass stopcock to permit reevacuation of liquid helium Dewar.
L. Line for pumping the space within the liquid helium Dewar.
M. Liquid helium Dewar.
N. Thermal tie-down for lead wires.
O. Vacuum can that surrounds the lower portion of the thermometer block well and the thermal shield.
P. Copper sleeve on vacuum can to maintain uniform temperature when liquid helium level is low.
Q. Thermal tie-down for leads similar to N with a heater and five-junction Chromel-P/constantan thermocouple for temperature control.
R. Copper ring on the thermometer block well with temperature control components similar to Q.
S. Heavy copper shield with temperature control components similar to Q.
T. Thermometer lead terminal block of anodized aluminum.
U. Capsule type platinum resistance thermometers thermally attached to copper block with vacuum grease.
V. Copper thermometer block with holes for six thermometers.
W. Location of thermocouple junctions placed on shield.
X. Reentrant “thumb” in the bottom of well. “Thumb” contains reference junctions for thermocouples on R and S.
Y. Heavy copper tail on vacuum can to reach liquid helium at a low level.
Figure 3. Thermometer comparison block.
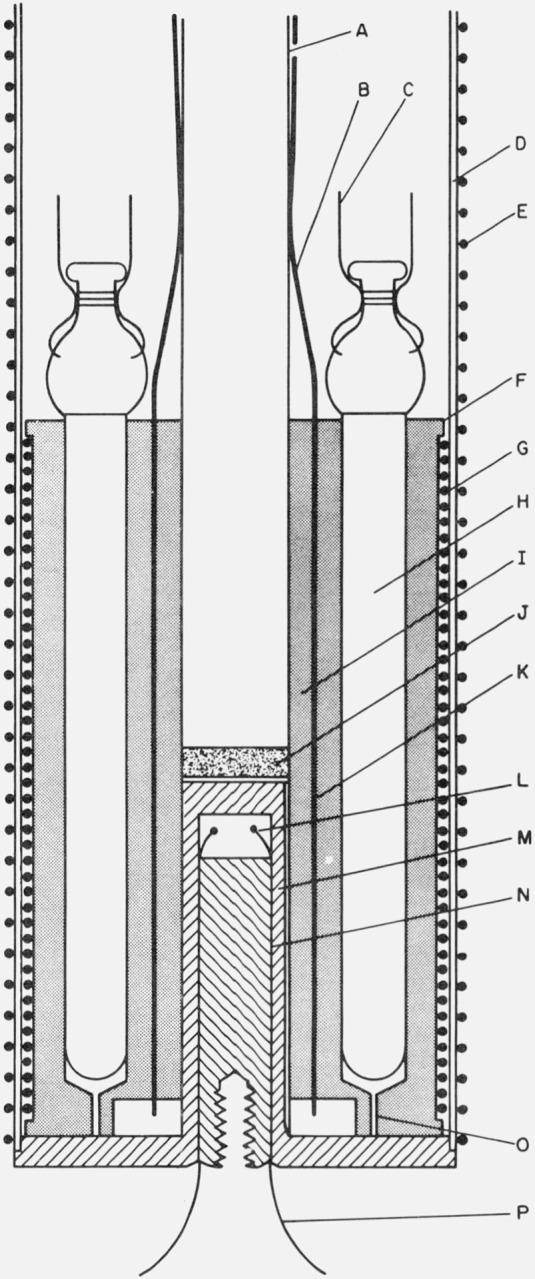
A. Stainless steel tube to support thermometer comparison block.
B. Manganin leads for thermometers and copper leads for block heater.
C. Platinum leads of resistance thermometer.
D. Stainless steel well for thermometer block.
E. Heater distributed along well “D”.
F. Copper thermometer block with wells for six thermometers.
G. Heater for thermometer block.
H. Platinum resistance thermometer.
I. Copper sleeve (attached to central supporting tube) with longitudinal grooves to serve as thermal tie-downs for manganin leads and thermocouples.
J. Brass plug to seal end of central support tube.
K. Location of grooves in sleeve “I”.
L. Reference junctions for thermocouples on shield (at “W” in fig. 2) and thermometer block well ring heater (at “R” in fig. 2).
M. Closely fitted reentrant copper “thumb” (with a groove for venting gas).
N. Copper plug with longitudinal grooves to serve as thermal tie-downs for thermocouples.
O. Vent.
P. Thermocouple leads to shield and thermometer block well ring heater.
Figure 4. Schematic of wiring capsule-type platinum resistance thermometers in the copper comparison block of the cryostat for calibration.
| SPRT | Leads used |
|---|---|
| 1 | efgh |
| 2 | ghij |
| 3 | ijkl |
| 4 | klmn |
| STD2 | mnop |
A. Cryostat leads.
B. Thermometer connections made among them and with the cryostat leads.
C. Schematic of the copper comparison block.
D. Platinum resistance thermometers. STD1 and STD2 are reference standards; others are to be calibrated.
The cryostat (fig. 2) was designed so that the central core could remain stationary when the cryostat assembly is lowered to expose the thermometer comparison block for installation or removal of thermometers. To the thin-wall, stainless steel central support tube G are attached, from bottom upward, the copper comparison block V, the thermometer lead terminal block T, thermal tie downs Q and N (two), and the upper support section which contains the vacuum line and the exit seal for the leads to the thermometers, thermocouples, and heaters. After the cryostat assembly is raised into position around the core the vacuum seal consisting of a Viton “○” ring E is closed; thus, only a single vacuum seal at room temperature is involved in the installation or removal of thermometers from the cryostat.
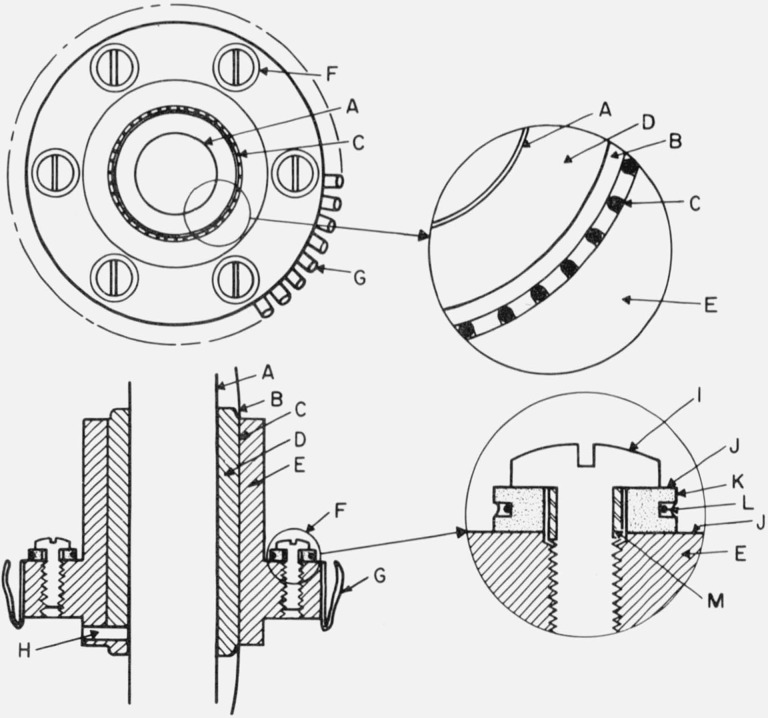
For the thermometer leads, manganin wire (No. 26 AWG, 0.404 mm diam.) insulated with a heavy coating of Formvar2 was selected for its small temperature coefficient of resistance to minimize the possible change in the difference of resistance of the potential leads between the normal (N) and reverse (R) readings of the Mueller bridge. The leads are “tempered” by being placed in good thermal contact with a series of three thermal tie downs (two of N and one of Q, shown schematically in fig. 2 and shown in detail in fig. 5). The leads are cemented in vertical grooves C of the copper cylinder D that is soldered to the central support tube A (G in fig. 2). Copper cylinder E is fitted snugly over D and held securely by pin H. The copper cylinder E contains the spring fingers G of beryllium copper. In the two thermal tie downs N the fingers make thermal contact with the refrigerant bath and in thermal tie down Q the fingers make thermal contact with the shield S. Q contains also a heater and a five-junction Chromel P/constantan thermopile for temperature control; the thermocouples are placed in thermal contact with Q by means of the “thermal tie down” shown by the insert F. The thermometer leads are tempered on the copper comparison block by cementing them in grooves shown as K in figure 3. The manganin thermometer leads and the copper leads to the thermocouples and heaters exit at the top of the cryostat through small holes in a ceramic disk. A hard wax is used to make the vacuum seal around the ceramic disk and the lead wires.
Figure 5. Thermal tie-downs.
A. Central support tube (stainless steel) for thermometer block.
B. Rounded corner, tangent to the bottom of the grooves for wire.
C. Round bottom grooves in cylinder “D” with wire cemented in place.
D. Copper cylinder soldered (tin-lead eutectic) to the central support tube.
E. Copper cylinder fitted to “D” and held in place by pin “H”.
F. Thermocouple tie-down.
G. Spring fingers of beryllium copper heavily silver plated and gold “flashed”.
H. 1.5 mm steel pin to hold cylinder “E” in position.
I. Pan head 2–56 brass screw to clamp thermocouple tie-down assembly to “E”.
J. Insulating washer of 0.005 mm Mylar coated with vacuum grease.
K. Copper washer with pretinned groove for thermocouple wire.
L. Polyimide insulated thermocouple wire, placed at the bottom of the pretinned groove and “potted” in eutectic tin-lead solder.
M. Epoxy insulation on screw.
During operation the cryostat (fig. 2) is surrounded by a liquid helium Dewar M and an outer Dewar (not shown) that contains liquid nitrogen. The “○” ring seal J between the cryostat and the inner helium Dewar is closed. For the initial cool down, liquid nitrogen is introduced through A into the inner Dewar and its vapor pressure is reduced to about 1/3 atm by pumping through L. For heat exchange the vacuum can O is filled with 3He gas to about 0.3 torr and the cryostat is left to cool over night to about 65 K. The liquid nitrogen remaining in the inner Dewar is removed by pressurizing the Dewar with 4He and forcing the liquid out through a siphon inserted through A. (Precooling the cryostat from about 80 to about 65 K reduces the liquid helium required for cooling by about two liters.) Six to seven liters of liquid helium are usually required to cool the apparatus from 65 to 4.2 K and fill the inner Dewar.
As part of the test, the resistance of the prt is first measured near 4.2 K with the 3He exchange gas in the vacuum can O. For the measurements in the range 13 to 90 K the 3He gas is removed by pumping and the temperature of the copper comparison block is stabilized by controlling the temperature of the thermal shields relative to the block. The temperature of the shields is controlled automatically by employing an amplifier and three-mode controller between each of the three five-junction Chromel P/constantan differential thermopiles and their corresponding shield heaters. The heaters and thermopiles are located on Q, R, and S of figure 2. R controls primarily the heat transfer up the stainless steel well F from the comparison block. Q controls the temperature of the leads and the central support tube. S is the thermal shield from R down and around the comparison block.
A heater wire wound directly on the copper comparison block is used to change its temperature to the next higher measurement temperature. Because of the low thermal diffusivity of stainless steel, a heater wire is also wound on the support tube to raise its temperature whenever the temperatures of the comparison block and Q are raised. When the block is being heated above about 40 K, the limitations of the power amplifiers that are presently being used cause the shield temperature to lag behind the block temperature; however, when the block heater is turned off the power amplifiers are adequate for the shield temperature to equalize rapidly to that of the block. After termination of heating the time required for the comparison block to attain temperature equilibrium increases with temperature. At 13.8 K the thermometer drift will decrease to less than 10 μΩ/min in 1 min; however, at 90 K more than 30 min are required before this temperature drift rate can be reached. Measurements are considered unsatisfactory if the thermometer drift is more than 5 μΩ/min below 20 K or more than 10 μΩ/min above 20 K.
The simultaneous measurements of each test prt and the first standard are made at 16 temperatures which are approximately 12.20, 13.81, 15.42, 17.34, 18.66, 20.28, 23.69, 27.102, 33.92, 40.75, 47.55, 54.361, 66.30, 78.24, 84.22, and 90.188 K. The measurements at these temperatures provide one to three intermediate points between the defining fixed points. The intercomparison of the first and second standards is usually made only at temperatures close to the fixed points. At each temperature a series of simultaneous measurements of the two prt’s is carried out as rapidly as possible with a continuous current of 1 mA and with the Mueller bridge commutator placed successively in positions NRRNNRRN. At approximately 90.2 K, the self-heating effect of the prt is determined by making measurements at 1 mA and at 2 mA. (Immediately after the prt is installed in the cryostat, the space around the copper block is evacuated and the prt is tested for any excessive self-heating effects. If the metal-to-glass seal of the capsule develops a leak, the helium exchange gas in the capsule is lost. Such a prt will have a large self-heating effect in a vacuum environment and is considered unreliable.) In the cryostat the total self-heating effect observed at 90 K is normally from 0.05 to 0.2 mK/(mA)2, depending upon the thermometer design.
4. Analysis of Platinum Resistance Thermometer Relations of the IPTS–68
In the IPTS–68 the specified formulae for evaluating temperatures employing the standard prt are such that the resistance versus temperature relation of a prt at any temperature (except at the defining fixed points) is influenced by all calibration points above that temperature. The following is a brief outline of the relation among the five sub-ranges of the IPTS–68 which are defined in terms of the prt.
Below 0 °C, as mentioned in the introduction, the values of temperature (T) on the IPTS–68 are defined by eq (1) which gives the observed resistance ratio W(T) as the sum of the reference function W*(T) (eq 2)) and the deviation function ΔW(T). The deviation function ΔW(T) is defined by a polynomial in T and the coefficients of the terms are determined from the deviation of the measured values of W(T) from the reference function values, W*(T), at the appropriate defining fixed points. Furthermore, the coefficients are constrained by the requirement that the first derivative of successive deviation functions be continuous at the points of joining below 0 °C.
- From 13.81 to 20.28 K the deviation function is
The coefficients are determined from the measured deviation, W(T) − W*(T), at the TP, the equilibrium temperature between liquid and vapor at 25/76 standard atmosphere, and the NBP of equilibrium hydrogen (e-H2), and by the derivative at the NBP of e-H2 of eq (6).(5) - From 20.28 to 54.361 K the deviation function is
The coefficients are determined from the measured deviation, W(T) − W*(T), at the NBP of e-H2, NBP of neon of natural composition, and the TP of oxygen, and by the derivative at the TP of oxygen of eq (7).(6) - From 54.361 to 90.188 K the deviation function is
The coefficients are determined from the measured deviation, W(T) − W*(T), at the TP and NBP of oxygen, and by the derivative at the NBP of oxygen of eq (8).(7) - From 90.188 to 273.15 K the deviation function is
The coefficients are determined from the measured deviation, W(T) − W*(T), at the NBP of oxygen and the NPB of water. (By definition, t = T − 273.15 K.) W(100 °C) for the prt may be calculated from eq (4) or (9), if the tin and zinc points are employed in the thermometer calibration. W*(100 °C) is calculated from eq (4) or (9) employing thermometer “constants” α* and δ*, which are to be described in the next paragraph.(8)
As outlined in the introduction, from 0 °C (273.15 K) to 630.74 °C (903.89 K) the values of temperature on the IPTS–68 are defined by eqs (3) and (4). The relation shown in eq (4) may be expressed in the equivalent form
| (9) |
where
| (10) |
and
| (11) |
| (12) |
and
| (13) |
It follows from eq (4) that
| (14) |
At T = 273.15 K (or t = 0 °C) the reference function eq (2) and its first and second derivatives are continuous with eq (9) (or eq (4)) for α = 3.9259668 × 10⁻³ °C−1 and δ = 1.496334 °C. (Hereafter, these values will be referred to as α* and δ*, respectively.) However, the first derivatives of real prt’s are not continuous at 0 °C [27]. The discontinuity is expected to be at most about 3 × 10⁻⁸ °C−1 or 0.0008 percent and, therefore, can be neglected for most purposes.
The contribution of α to the calibration of the prt in the subranges below 0 °C will be demonstrated in the following. From eq (4) or (14)
| (15) |
and
| (16) |
Subtracting eq (16) from eq (15) and substituting in eq (8) at 100 °C, there results
| (17) |
When eq (8) is solved for C4 at ,
| (18) |
Thus, both coefficients A4 and C4 of eq (8) are affected by the value of α. The derivative of eq (8) is
| (19) |
The values of A4 and C4 of the 28 capsule type prt’s, that have been calibrated during the last 2 1/2 years at NBS, ranged from −7.900 × 10⁻⁷ to +1.0833 × 10⁻⁶ and from −2.2740 × 10⁻¹⁴ to +2.3120 × 10⁻¹⁴, respectively. (The coefficients A4 and C4 of 166 long stem prt’s, that have been obtained over the same period by calibration at the TP of water, tin and zinc points, and the NBP of oxygen, ranged from −9.668 × 10⁻⁷ to +1.3108 × 10⁻⁶ and −5.2612 × 10⁻¹⁵ to +3.0437 × 10⁻¹⁴, respectively.) Since the factor 4t2 (t − 75) becomes about −3 × 10⁷ at the oxygen point, the two terms of eq (19) can be comparable in magnitude at that temperature. When eq (19) is expressed in terms of the measured quantities A4 and by substituting eq (18) for C4, there is obtained
| (20) |
When – 182.962 °C is substituted for , eq (20) becomes
| (21) |
Again, since ranges from about −2.0 × 10⁻⁴ to +1 × 10⁻⁴, the contribution of A4 to the derivative at the oxygen point can be comparable to that of the measured value of . (The values of A4 and have been found to be closely connected. When A4 is relatively large, i.e., when α is relatively large, is negatively larger; when A4 is minus, is positive.)
The capsule type prt’s are calibrated first at the TP of water and at the tin point before calibrating in the region of 13 to 90 K. Because of the possible damage and the electrical leakage across the metal-glass lead seal at high temperatures, the capsule type prt’s are not calibrated at the zinc point as is routinely done with long-stem type prt’s. The capsule type prt’s are also not given any annealing treatment at NBS. The calibration sequence consists of measurements at the TP of water, tin point, TP of water, and the 13 to 90 K range. To obtain α from the calibration measurements at the TP of water and the tin point, an average value of B (approximately −5.8755 × 10⁻⁷ °C−2) is employed which is based on the values obtained earlier on 203 long-stem type prt’s. The range of values of B on the long-stem type prt’s is 5 × 10⁻¹⁰ °C−2. From eq (12)
| (22) |
and at the tin point from eq (9)
| (23) |
thus
| (24) |
Therefore, by choosing the mean value of B there would be an uncertainty in α (or in A4) of about ±3 × 10⁻⁸ °C−1 (equivalent to about 1 mK at the NBP of water). (A survey of the values of B obtained on long-stem prt’s that were received during the last 21/2 years shows the average to be closer to −5.8768 × 10⁻⁷ °C−2 and the range to be about 4 × 10⁻¹⁰ °C−2.) A survey of 28 capsule type prt’s shows that the derivatives at the NBP of oxygen of the deviation functions could be 3 × 10⁻⁸ °C−1 or smaller. This indicates that the value of the derivative of the deviation function at the oxygen point could be obscured by the uncertainty in the value of B that is used.
An error in the realization of the NBP of water (or in the calculated value of W(100 °C) because of the calibration error at the tin point) results in an error in the value of α. From eq (14)
| (25) |
and from eq (9)
| (26) |
Thus,
| (27) |
Since A is about 3.98 × 10⁻³ °C−1 and B is about −5.87 × 10⁻⁷ °C−2,
| (28) |
(dt′ is replaced by dt in this approximation because at 100 °C dt/dt′ is about 1.0003; see eq (3).) Thus, the uncertainty in α of ±3 × 10⁻⁸ °C−1, caused by employing the mean value of B, is equivalent to an uncertainty of about ±1 mK in the realization of the NBP of water. Reproducibilities of ±0.1 mK to ±1 mK have been reported for the NBP of water [28, 29], indicating that the uncertainty in B is comparable to the reproducibility of the NBP of water.
The effect of an error in the realization of the tin point on the value of α is shown by the following. When eq (9) is substituted for A in eq (12), there is obtained
| (29) |
When eq (29) is differentiated with respect to W,
| (30) |
if an assumed average B is used. By substituting eq (9) for A in eq (26), the effect of a change in temperature on W is obtained as
| (31) |
The substitution of eq (31) for dW in eq (30) gives
| (32) |
At the tin point, W is approximately 1.892, dt/dt′ is about 1.0002, and since B is about −5.876 × 10⁻⁷ °C−2, eq (32) becomes
| (33) |
which shows that the effect on α (or A4) of a unit error of temperature at the tin point (if using an assumed value of B) is about 0.4 of that at the NBP of water.
The foregoing analysis shows that the errors of calibration above 0 °C could contribute a relatively large effect on the derivative of the deviation function at the oxygen point. However, the errors of computed temperatures in the region below 0 °C is determined by the absolute magnitude of the error in the value of the deviation functions. From eq (2)
| (34) |
and from eq (1)
| (35) |
(The effect of the error of resistance ratio measurement δW(T) by the user of the prt is not considered in this discussion; this error can be best estimated by the user and combined with the error of calibration δΔW(t) to determine the overall error.) In the region of 13 to 90 K, dT/dW*(T) ranges from about 4918 to 230 K so that the error δΔW(t) must be smaller than 2 × 10⁻⁷ at 13 K and smaller than 4 × 10⁻⁶ at 90 K for the temperature error δT to be 1 mK or less. This corresponds to the resistance reading error of a standard prt, with an R(0 °C) of 25 Ω, to be less than 5 × 10⁻⁶ Ω at 13 K and less than 11 × 10−5 Ω at 90 K. The effect of the error in the deviation, , at the NBP of oxygen on the final deviation functions between 13 and 90 K was analyzed by numerical techniques using a computer.
The data (16 points) from the comparison measurements, obtained as described in the section, “Design and Operation of the Cryostat,” are processed by a computer employing a least squares technique in which the derivatives of the four polynomial deviation equations are constrained to be equal at the point of their joining as outlined earlier, i.e., at 20.28 K (NBP of e-H2), at 54.361 K (TP of oxygen), and 90.188 K (NBP of oxygen). The analysis yields the “best values” of ΔW (or W) at the fixed points for the respective prt’s which are then used to obtain the polynomial deviation functions of the IPTS-68 and then to evaluate tables of W or R versus T. This method, which is employed in processing the 16 observations obtained on all capsule type prt’s that are received for calibration at NBS, will be referred to in this paper as the least squares method.
The comparison measurements include observations within 0.02 or 0.03 K of the defining fixed point temperatures; they deviate at most by 0.3 K. In the second method of analysis the points close to the fixed points were “extrapolated,” without the use of the observations at the intermediate temperatures, to the appropriate fixed points to obtain W and then the ΔW. The IPTS–68 deviation functions were derived from these extrapolated values. This method of analysis will be referred to as the fixed-point method. This analysis procedure illustrates the case when only the defining fixed points are employed in calibrating prt’s.
In the analysis of the interrelationship of the deviation functions of the IPTS–68 for prt presented here, the calibration obtained on a typical capsule type prt was taken to be “perfect.” Various types of errors, to be subsequently described, were introduced into the calibration of this prt and the results are compared with the results of the “perfect” calibration. Plots show the temperature difference or the deviations between the two “calibrations.”
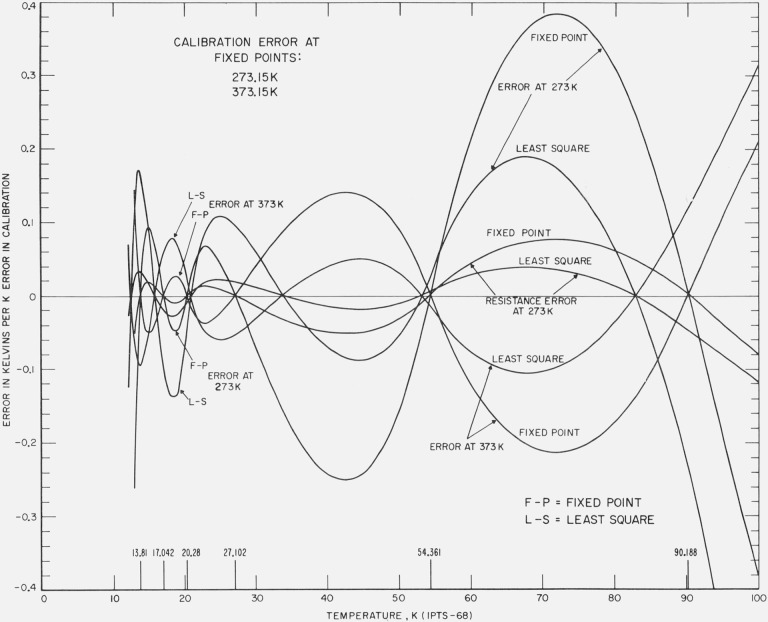
A computer analysis was made in terms of how a unit positive error of temperature in the realization of the NBP of water is reflected in the reduction of the calibration data in the region of 13 to 90 K. The results are shown in figure 6. The effect of the error is shown to be attenuated and is smaller between about 30 and 87 K for the least squares treatment of the data than for the fixed point treatment but at other temperatures the effect is larger for the least square method. Since the least squares method involves the minimization of the absolute error in W, the relatively large deviations at the lower temperatures shown in figure 6 reflect the increased sensitivity in ∂t/∂W*(t) at these temperatures. These relatively large temperature deviations at the lower temperatures will be seen in other figures. There is shown also in figure 6 how a unit positive error of temperature in the realization of the TP of water is reflected in the reduction of the calibration data in the region of 13 to 90 K. This measurement error causes an error in α and in R(0 °C). Figure 6 shows also the effect of resistance error in R(0 °C) corresponding to a unit positive error of temperature, but with no error in α. In general the results obtained in the latter two cases with the least squares treatment and the fixed point treatment are very similar to those obtained with an error at the NBP of water. As pointed out earlier, in employing the average value of B in the calibration of capsule prt’s there results an uncertainty equivalent to an uncertainty of ±1 mK in the realization of the NBP of water. Figure 6 shows that this uncertainty corresponds to less than 0.1 mK over most of the 13 to 90 K range. In the least squares treatment the error would amount to about 0.1 mK at 65 and 90 K.
Figure 6. The effect of errors in the realization of the fixed points above 0 °C on the calibration of a platinum resistance thermometer in the region 13 K to 90 K.
The errors introduced in the calibration when the least squares treatment is employed is compared with those of the fixed point treatment of the same data. The effects of errors equivalent to unit positive temperature in the realization of the TP and of the NBP of water are each plotted. The resulting errors are also shown when an error in R(0 °C) equivalent to a unit positive temperature is made but no error in α is made.
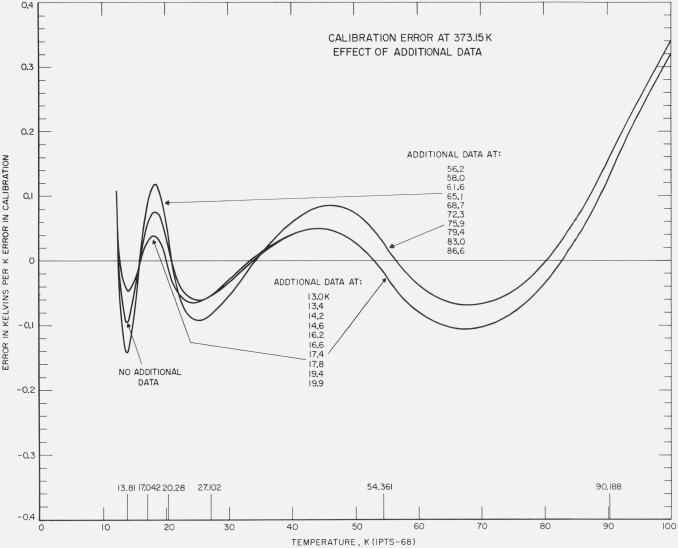
For the least squares treatment, the effect of taking additional observations below 90 K was examined as a possibility to reduce the influence of the calibration errors above 0 °C. Figure 7 shows the results of three times more data between 54 and 90 K and between 13 and 20 K. The additional data between 54 and 90 K make relatively small improvement on the deviations above about 50 K and make the deviation worse below 50 K. The additional data between 13 and 20 K result in significant reduction of the deviations between 13 and 40 K and very little change in the deviations above about 50 K.
Figure 7. The effect of three times more data in the region 13 to 20 K and the effect of three times more data in the region 54 K to 90 K on the results of least squares treatment of the calibration data with an error equivalent to unit positive temperature at the NBP of water.
The plot gives the deviations of the values of temperatures of the calibration with error from those of the calibration without error.
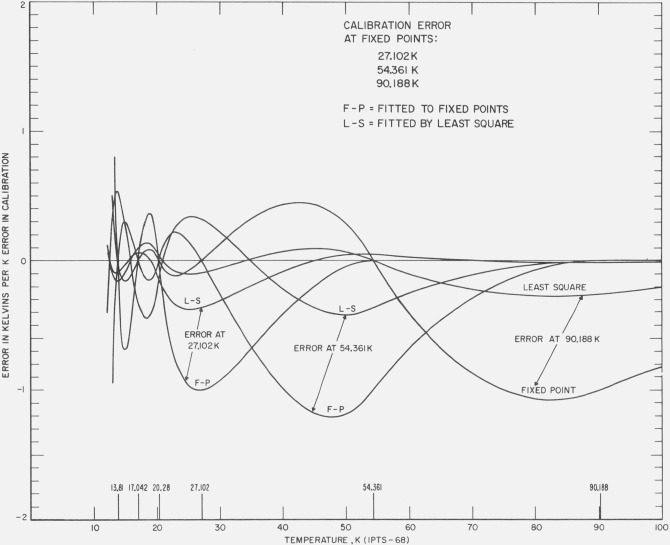
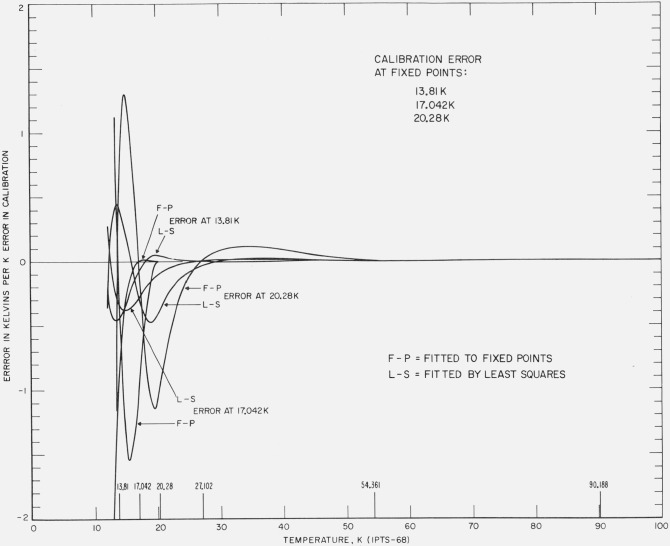
Figures 8 and 9 show the effect of unit positive error in the realization of the fixed-point temperatures at 90.188, 54.361, 27.102, 20.28, 17.042, and 13.81 K. The results of both least squares and fixed point treatments are shown. The least squares treatment propagates the errors both upward and downward and causes relatively larger deviations at the lower temperatures than the fixed-point treatment. However, the overall average deviation is smaller for the least squares method.
Figure 8. The effect of an error in the realization of the fixed point on the calibration of platinum resistance thermometer in the region 13 to 90 K.
The figure shows the resulting error with the least squares treatment and the resulting error with the fixed point treatment of the same data with an error equivalent to unit positive temperature at 90.188, at 54.361, and at 27.102 K.
Figure 9. The effect of an error in the realization of the fixed point on the calibration of platinum resistance thermometer in the region 13 to 90 K.
The figure shows the resulting error with the least squares treatment and the resulting error with the fixed point treatment of the same data with an error equivalent to unit positive temperature at 20.28 K, at 17.042 K, and at 13.81 K.
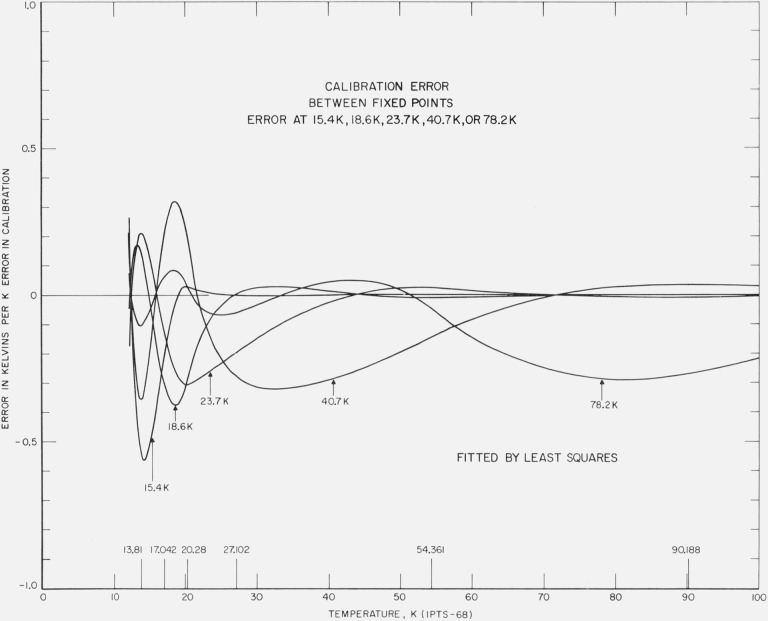
The least squares treatment of error of observation at temperatures between the fixed points was also examined. Figure 10 shows that the error is attenuated significantly although the error is propagated to other temperature regions, particularly to lower temperatures. The error at 15.4 K is reduced to 46 percent, that at 18.6 K to 37 percent, that at 23.7 K to 26 percent, that at 40.7 K to 28 percent, and that at 78.2 K to 28 percent. Thus, considering only the possible measurement errors, the least squares analysis of the calibration data should yield better results than the fixed point method. Additional data at the lower temperatures, particularly below about 25 K, and increased weighting of these data should improve the results of the least squares treatment of calibration data.
Figure 10. The effect of an error in the calibration data at temperatures midway between the fixed points on the calibration of platinum resistance thermometer in the region 13 to 90 K.
The figure shows the resulting error with the least squares treatment of the data with an error equivalent to unit positive temperature at 15.4 K, at 18.6 K, at 23.7 K, at 40.7 K, and at 78.2 K.
5. Reproducibility of NBS–IPTS–68
The reduction of the calibration data involves calculating the temperature from the observed resistance of the reference standard and assigning this value of temperature to the simultaneously observed value of resistance of the prt being calibrated. The temperature of the reference standard prt is evaluated from its IPTS–68 deviation functions and the reference function in accordance with eqs (1) and (2). As described earlier, these observed resistance versus temperature data for the prt being calibrated are processed by the least squares method to obtain the “best” coefficients for the IPTS–68 deviation functions. These deviation functions are employed to compute the thermometer calibration table issued from NBS. The coefficients of the deviation functions for the prt are also issued as a part of the calibration service. The differences between the final tabular values and the observed resistance versus temperature data for the prt being calibrated are indicative of the quality of reproduction of the NBS–IPTS–68 by the prt. Systematic differences would indicate that the formulations being used do not adequately transfer the NBS– IPTS–68 to the prt being calibrated. A close similarity of these differences for different prt’s indicates that the NBS–IPTS–68 scale is being transferred to the prt’s in a similar manner. If many “wild” differences exist, the measurement process, which includes the cryostat, requires improvement. Obviously, if the differences are small, then the transfer of the NBS– IPTS–68 to the prt’s is adequate.
In the following discussion a series of plots of the differences between the calculated values and the observed values is shown to indicate the reproducibility of prt comparison calibrations performed at the NBS the past 21/2 years since the present least squares computer program was initiated. In addition to the least squares method, the fixed point treatment described earlier was also used with the same data. The results of the latter method of analysis should indicate the reproducibility of the IPTS–68 for this group of thermometers.
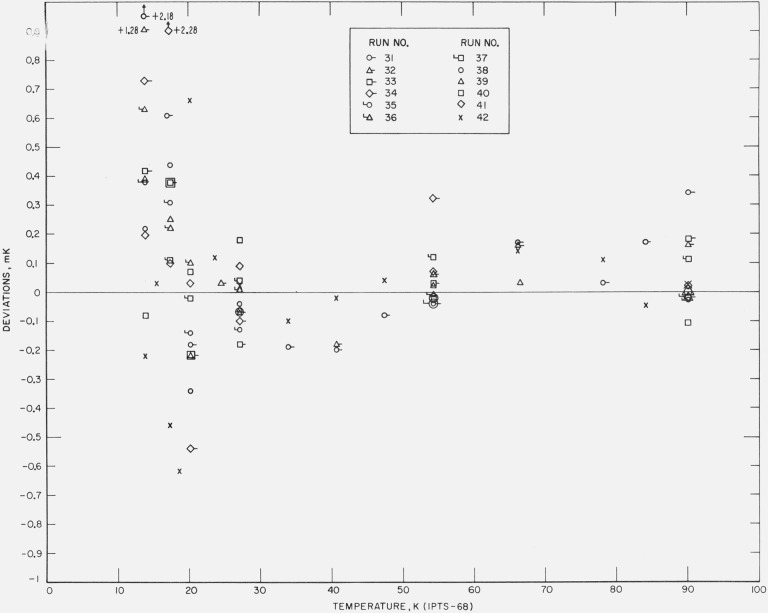
A second reference standard prt is intercompared with the first standard in every group of thermometers calibrated. The comparisons are made at temperatures near the fixed points and occasionally at other temperatures. The coefficients of the IPTS–68 deviation functions have been derived for this second reference standard. Figure 11 shows the differences between the computed values of temperatures at the temperatures of intercomparison of the two reference standard prt’s. The deviations, except for a few possible errors of recording of observations, indicate excellent precision in the calibration measurements.
Figure 11. Measured deviations of the values of temperatures of the second reference standard platinum resistance thermometer from those of the first reference standard.
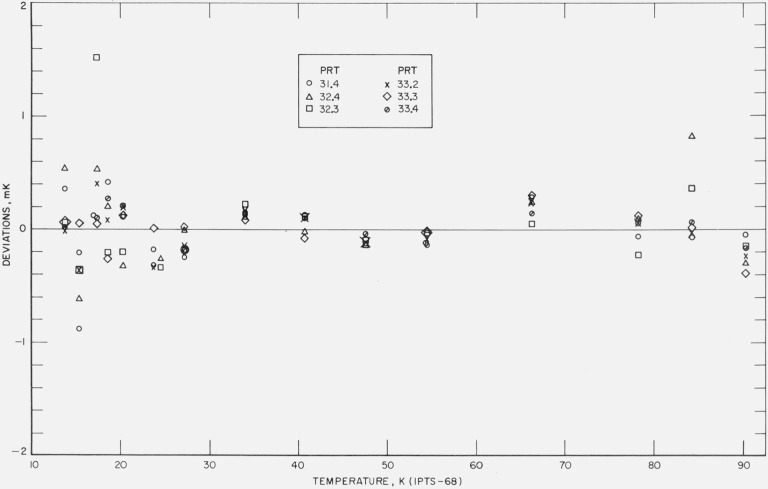
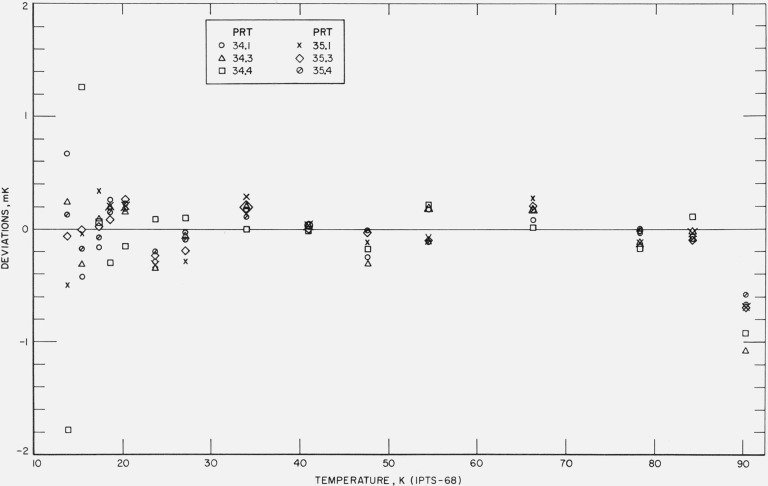
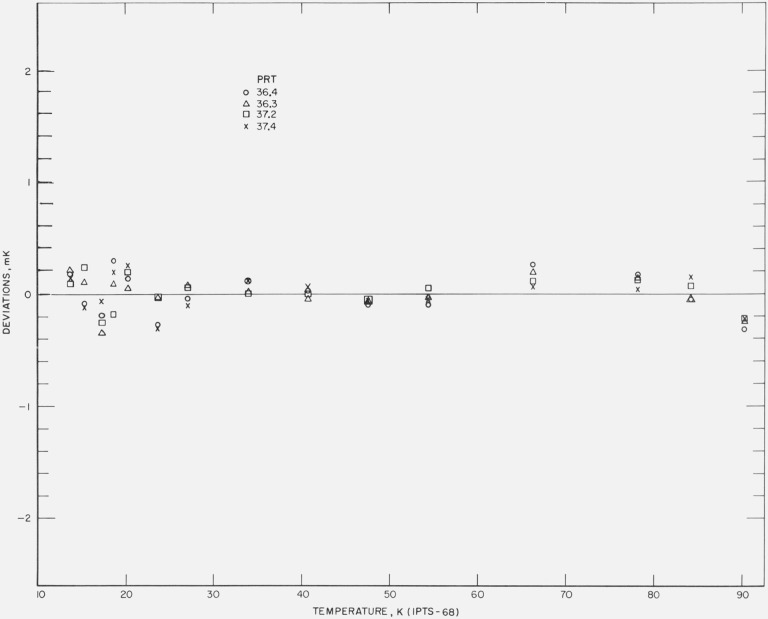
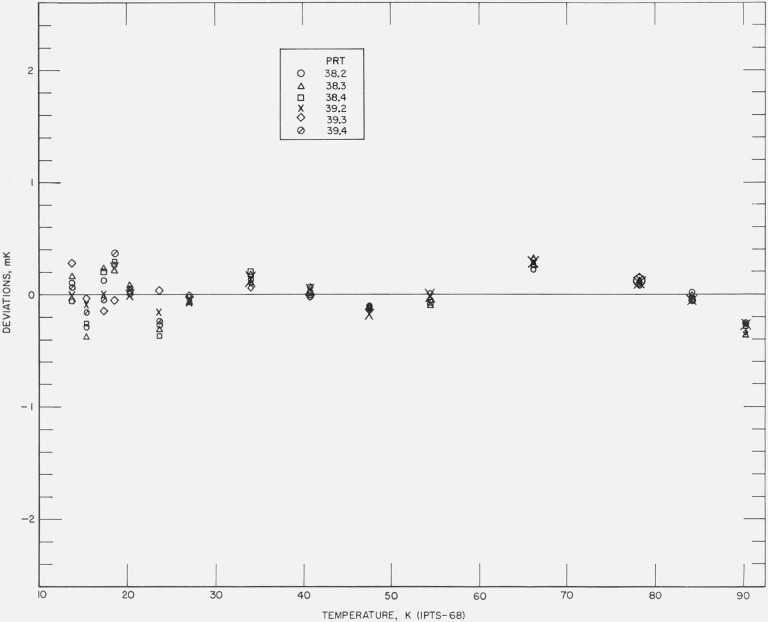
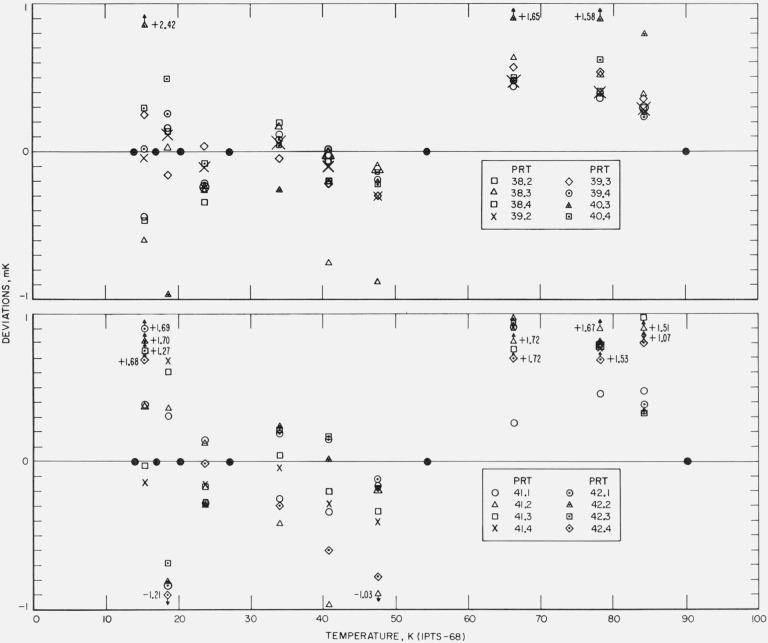
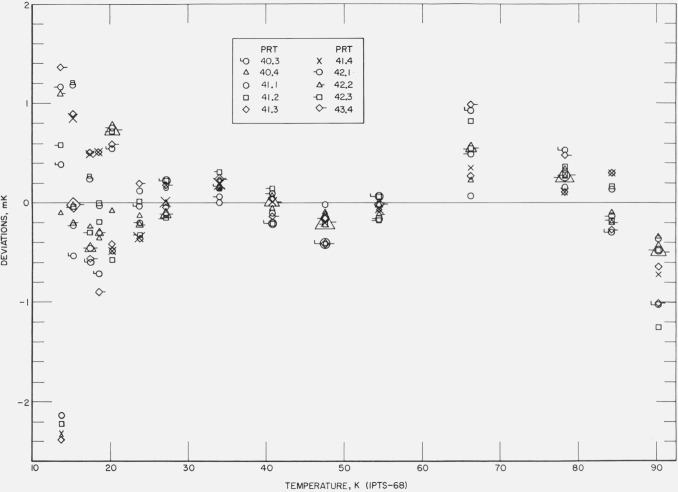
Figures 12, 13, 14, 15, and 16 show the results of the least squares treatment of the calibration data. Between about 20 and 90 K the derived coefficients of the IPTS–68 deviation functions for the prt’s yield temperature scales that generally agree within a few tenths of a mK with the NBS–IPTS–68. Between 13.8 and 20 K the differences become closer to about ±0.7 mK. A small systematic deviation is seen in the data above about 40 K. In some of the measurements a deviation as much as −1 mK is shown at 90 K; this is considered to be principally the result of relatively poor joining of the two deviation functions at 90.188 K and the relatively large deviations between 54 and 90 K in the IPTS–68 formulation of the NBS–IPTS–68 scale (see figs. 17 and 18). In section 4 (see fig. 6) an error of realization of the NBP of water is shown to be attenuated by 1/10 at 90 K. An error in α equivalent to an error of 0.01 K at the NBP of water, because of possible error of measurements at the tin point or the use of average B, is considered unlikely. Further work is in progress to reduce these relatively large differences found for some thermometers.
Figure 12. The measured deviations of the values of temperatures, given by the IPTS–68 formulations obtained for each thermometer by the least squares treatment of the calibration data, from those of the NBS–IPTS–68 scale at temperatures of intercomparison with the reference standard.
Figure 13. The measured deviations of the values of temperatures, given by the IPTS–68 formulations obtained for each thermometer by the least squares treatment of the calibration data, from those of the NBS–IPTS–68 scale at temperatures of intercomparison with the reference standard.
Figure 14. The measured deviations of the values of temperatures, given by the IPTS–68 formulations obtained for each thermometer by the least squares treatment of the calibration data, from those of the NBS–IPTS–68 scale at temperatures of intercomparison with the reference standard.
Figure 15. The measured deviations of the values of temperatures, given by the IPTS–68 formulations obtained for each thermometer by the least squares treatment of the calibration data, from those of the NBS–IPTS–68 scale at temperatures of intercomparison with the reference standard.
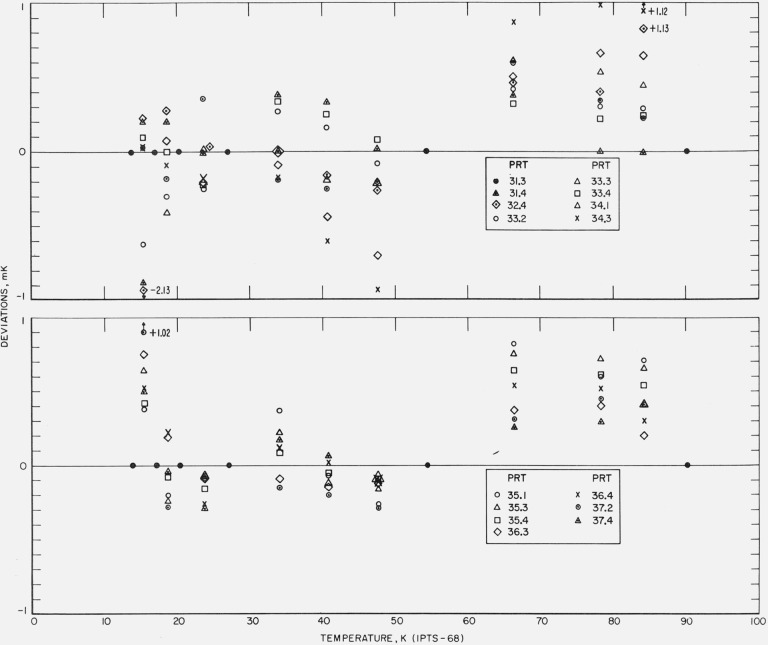
Figure 17. The measured deviations of the values of temperatures, given by the IPTS–68 formulations obtained for each thermometer by the fixed point treatment of the calibration data, from those of the NBS–IPTS–68 scale of temperatures of intercomparison with the reference standard.
Figure 18. The measured deviations of the values of temperatures, given by the IPTS–68 formulations obtained for each thermometer by the fixed point treatment of the calibration data, from those of the NBS–IPTS–68 scale at temperatures of intercomparison with the reference standard.
Although there is some experimental scatter in the data, particularly below about 20 K, definite systematic differences are shown by the results of the fixed point treatment of the data (see figs. 17 and 18). Between 20.28 and 27.102 K the deviations are in general negative, between 27.102 and 54.361 K at first positive then negative, and between 54.361 and 90.188 K positive. Similar deviations in the reproducibility of the IPTS–68 have been reported by Bedford and Ma [30] and by Tiggelman and Durieux [31]. Except for a few observations that seem to deviate considerably more, the reproducibility of the NBS–IPTS–68 scale using the IPTS–68 fixed point treatment is well within ±1 mK. The relatively large differences of the fixed point treatment (see fig. 18) are reduced by the least squares treatment (see fig. 16).
Figure 16. The measured deviations of the values of temperatures, given by the IPTS–68 formulations obtained for each thermometer by the least squares treatment of the calibration data, from those of the NBS–IPTS–68 scale at temperatures of intercomparison with the reference standard.
6. Conclusion
The calibration procedure employed at the NBS for capsule type prt’s reproduces the NBS–IPTS–68 scale maintained on reference standard prt’s within a few tenths of a mK between about 20 and 90.188 K and within about ±1 mK between 13.81 and 20 K. The results of the fixed point treatment of the same calibration data, rather than the least squares method normally employed at the National Bureau of Standards, exhibit in general larger systematic deviation from the NBS–IPTS–68 than the results of the least squares analysis. The deviations are more evenly distributed in the results of the least squares treatment. Except for cases where accidental errors apparently occurred at the fixed point temperatures, the two methods of analyses yielded deviations that are in general very similar in shape. Since the deviations of values of temperatures are very similar for all prt’s, particularly above about 40 K, the reference standard prt’s employed at the NBS appear not to be “average” prt’s. They seem to have characteristics somewhat different from the prt’s that were recently calibrated.
The survey of measurements of fixed points employing thermometers calibrated in terms of the NBS–IPTS–68 shows that the values of temperatures reported are in close agreement with the values given in the text of the IPTS–68. The values reported prior to about 1969 are expected to have influenced to some degree the final values for the IPTS–68. Nevertheless, the survey shows that the NBS–IPTS–68 scale closely approximates the defining fixed points of the IPTS–68.
The study of the effect of errors in the calibration data above 0 °C on the calibration of prt’s in the region 13 to 90 K indicates that any given error of temperature which causes an error only in the value of α is attenuated by a factor of 10 or more in the calibration between 13 and 90 K when the least squares treatment of the data is employed. In the least squares treatment of the data any error in the region 13 to 90 K is distributed both upward and downward in temperature. Since the least squares treatment minimizes the deviations in W and the derivative dT/dW is larger at the lower temperatures, the temperature deviations appear larger at the lower temperatures. To improve the present calibrations, the data at the lower temperatures should be increased in both quantity and accuracy. Work is in progress to make such improvements in the calibrations a practical reality.
Acknowledgments
The authors gratefully acknowledge the help of William J. Hall of NBS Cryogenics Division, Boulder, Colorado, who wrote the present computer program for reducing the prt calibration data for the region 13 to 90 K obtained with the cryostat.
Footnotes
Figures in brackets indicate the literature reference at the end of this paper.
Certain commercial materials are identified in this paper in order to adequately specify the experimental procedure. In no case does such identification imply recommendation or endorsement by the National Bureau of Standards, nor does it imply that the material identified is necessarily the best available for the purpose.
7. References
- [1].The International Practical Temperature Scale of 1968. Adopted by the Comité International des Poids et Mesures, Metrologia 5, No. 2, 35–44 (April 1969). [Google Scholar]
-
[2].The notations employed in the IPTS–68 document have been abbreviated as follows:
The other notations have been retained. - [3].Hoge H. J., and Brickwedde F. G., Establishment of a temperature scale for the calibration of thermometers between 14° and 83 °K, J. Res. Nat. Bur. Stand. (U.S.) 22, 351–373 (1939) RP1188. [Google Scholar]
- [4].Swindells J. F., National Bureau of Standards provisional scale of 1955, in Precision Measurement and Calibration. Temperature, Nat. Bur. Stand. (U.S.), Spec. Publ. 300, Vol. 2, 513 pages (August 1968), p. 56. [Google Scholar]
- [5].Moessen G. W., Aston J. G., and Ascah R. G., Thermodynamic temperature scale below 90 °K, the normal boiling point of normal hydrogen, J. Chem. Phys. 22, 2096–2097 (1954). [Google Scholar]
- [6].Moessen G. W., Aston J. G., and Ascah R. G., The Pennsylvania State University thermodynamic temperature scale below 90 °K and the normal boiling points of oxygen and normal hydrogen on the thermodynamic scale, in American Institute of Physics, Temperature, Its Measurement, and Control in Science and Industry, Vol. 3, Part 1, 91–102 (Reinhold Publishing Corp., New York, N.Y., 1962). [Google Scholar]
- [7].Borovik-Romanov A. S., Strelkov P. G., and Orlova M. P., Procès-Verbaux dex Séances du Comité International des Poids et Mesures, Tenth Series, 24, Annexe T18, pp. T141–T147 (Gauthier-Villars, Paris, 1955). [Google Scholar]
- [8].Borovik-Romanov A. S., Strelkov P. G., Orlova M. P., and Astrov D. N., The I.M.P.R. temperature scale for the 10 to 90 °K region, in American Institute of Physics, Temperature, Its Measurement and Control in Science and Industry, Vol. 3, Part 1, 113–128 (Reinhold Publishing Company, New York, N.Y., 1962). [Google Scholar]
- [9].Barber C. R., The establishment of a practical scale of temperature for the range 10–90 °K. Brit. J. Appl. Phys. 13, 235–241 (1962). [Google Scholar]
- [10].Barber C. R., Low-temperature scales 10 to 90 °K, in American Institute of Physics, Temperature, Its Measurement and Control in Science and Industry, Vol. 3, Part 1, 345–350 (Reinhold Publishing Corp., New York, N.Y., 1962). [Google Scholar]
- [11].Orlova M. P., Sharevskaya D. I., Astrov D. N., and Krutikova I. G., and Barber C. R., and Hayes J. G., The derivation of the provisional reference table CCT64, T = f(W) for platinum resistance thermometers for the range from 12 to 273.15 °K. Part 1. The derivation of the table for the range from 12 to 95 °K, Metrologia 2, No. 1, 6–10 (Jan. 1966). [Google Scholar]
- [12].Bedford R. E., Durieux M., Muijlwijk R., and Barber C. R., Relationships between the International Practical Temperature Scale of 1968 and the NBS–1955, NPL–61, PRMI–54, and PSU–54 temperature scales in the range from 13.81 to 90.188 K, Metrologia 5, No. 2, 47–49 (April 1969). [Google Scholar]
- [13].Hoge H. J., and Arnold R. D., Vapor pressures of hydrogen, deuterium, and hydrogen deuteride and dew-point pressure of their mixtures, J. Res. Nat. Bur. Stand. (U.S.) 47, No. 2, 63–74 (Aug. 1951) RP2228. [Google Scholar]
- [14].Barber C. R., and Horsford A., The determination of the boiling point and triple points of equilibrium hydrogen and its vapour pressure–temperature relation, Brit. J. Appl. Phys. 14, 920–923 (1963). [Google Scholar]
- [15].Compton J. P., The realization of low temperature fixed points, in American Institute of Physics, Temperature, Its Measurement and Control in Science and Industry, Vol. 4, pending. [Google Scholar]
- [16].Cataland G., and Plumb H. H., Comparison of temperature scales and the realization of low temperature fixed points, in American Institute of Physics, Temperature, Its Measurement and Control in Science and Industry, Vol. 4, pending. [Google Scholar]
- [17].Weber L. A., Diller D. E., Roder H. M., and Goodwin R. D., The Vapor Pressure of 20 °K Equilibrium Hydrogen, Cryogenics 2, No. 4, 236–238 (1962). [Google Scholar]
- [18].Grilly E. R., The vapour pressure of solid and liquid neon, Cryogenics 2, No. 4, 226–229 (1962). [Google Scholar]
- [19].Furukawa G. T., Saba W. G., Sweger D. M., and Plumb H. H., Normal boiling point and triple point temperatures of neon, Metrologia 6, No. 1, 35–37 (Jan. 1970). [Google Scholar]
- [20].Compton J. P., The realization of the normal boiling point of neon. II. Vapor pressure measurements, Metrologia 6, No. 3, 103–109 (Aug. 1970). [Google Scholar]
- [21].Muijlwijk R., Moussa M. R., and van Dijk H., The vapour pressure of liquid oxygen, Physica 32, 805–822 (1966). [Google Scholar]
- [22].Tiggelman J. L., van Rijn C., and Durieux M., Vapor pressures of liquid and solid neon between 19 K and 30 K, in American Institute of Physics, Temperature, Its Measurement and Control in Science and Industry, Vol. 4, pending. [Google Scholar]
- [23].Moussa M. R., Muijlwijk R., and van Dijk H., The vapor pressure of liquid nitrogen, Physica 32, 900–912 (1966). [Google Scholar]
- [24].Armstrong G. T., Vapor Pressure of nitrogen, J. Res. Nat. Bur. Stand. (U.S.) 53, No. 4, 263–266 (Oct. 1954) RP2543. [Google Scholar]
- [25].Lovejoy D. R., Some boiling and triple points below 0 °C, Nature 197, No. 4865, 353–354 (Jan. 1963). [Google Scholar]
- [26].Muijlwijk R., Durieux M., and van Dijk H., Comparisons of platinum resistance thermometers with the hydrogen vaporpressure thermometer, Physica 43, 622–632 (1969). [Google Scholar]
- [27].Riddle J. L., Furukawa G. T., Plumb H. H., Platinum resistance thermometry, Nat. Bur. Stand. (U.S.), Monogr. 126, 129 pages (April 1973). [Google Scholar]
- [28].Comité International des Poids et Mesures, Procès-verbaux des séances de l’année 1954, 24, T96–T121 (1955). [Google Scholar]
- [29].Berry R. J., The reproducibility of the steam point, Can. J. Phys. 36, 740–760 (1958). [Google Scholar]
- [30].Bedford R. E., and Ma C. K., A note on the reproducibility of the IPTS–68 below 273.15 K, Metrologia 6, No. 3, 89–94 (July 1970). [Google Scholar]
- [31].Tiggelman J. L., and Durieux M., Platinum resistance thermometry between 13.81 K and 373.15 K, in American Institute of Physics, Temperature, Its Measurement and Control in Science and Industry, Vol. 4, pending. [Google Scholar]
- [32].Cetas T. C., and Swenson C. A., A paramagnetic salt temperature scale, 0.9 to 18 K, Metrologia 8, No. 2, 46–64 (April 1972). [Google Scholar]


