

Abstract
Background:
Brain mitochondrial dysfunction is implicated in the pathophysiology of mood disorders. Brain cytochrome-c-oxidase (COX) activity is associated with mitochondrial function. Near-infrared spectroscopy (NIRS) non-invasively measures oxidized COX (oxCOX) and tissue oxygenation index (TOI) reflecting cerebral blood flow and oxygenation.
Methods:
oxCOX and TOI were assessed in prefrontal cortex (Fp1/2, Brodmann area 10) in patients in a major depressive episode (N=13) with major depressive disorder (MDD; N=7) and bipolar disorder (BD; N=6) compared to controls (N = 10). One MDD patient and all BD patients were taking medications. Computational modelling estimated oxCOX and TOI related indices of mitochondrial function and cerebral blood flow, respectively.
Results:
oxCOX was lower in patients than controls (p=0.014) correlating inversely with depression severity (r=−0.72, p = 0.006), driven primarily by lower oxCOX in BD compared with controls. Computationally modelled mitochondrial parameters of the electron transport chain, such as the nicotinamide adenine dinucleotide ratio (NAD+/NADH p=0.001) and the proton leak rate across the inner mitochondrial membrane (klk2 p=0.008), were also lower in patients and correlated inversely with depression severity. No such effects were found for TOI.
Conclusions:
In this pilot study, oxCOX and related mitochondrial parameters assessed by NIRS indicate an abnormal cerebral metabolic state in mood disorders proportional to depression severity, potentially providing a biomarker of antidepressant effect. Since the effect was driven by the medicated BD group, findings need to be evaluated in a larger, medication-free population.
Keywords: depression, cytochrome-c-oxidase, near-infrared spectroscopy
1. Introduction
More than 300 million people suffer from mood disorders globally. Mood disorders are projected to be the leading cause of disability-adjusted life years lost by 2030 (NIH 2018). Heterogeneity of depression is indicated by pleomorphism of its symptom and the observations that up to 60% of patients do not respond adequately to medications (Nemeroff 2007; Wiles, Thomas, and Abel A 2014). Multiple neurobiological and psychosocial factors are thought to contribute to mood disorders, yet biomarkers that can guide treatment selection have proven limited (Strawbridge, Young, and Cleare 2017).
Mitochondrial dysfunction has been proposed as a contributing factor to the pathophysiology of mood disorders (Bansal and Kuhad 2016; Kato 2017). Mitochondria are intracellular organelles that produce adenosine triphosphate (ATP), the main source of cellular energy (Picard, Wallace, and Burelle 2016). Impaired mitochondrial function results in decreased ATP production, and more apoptosis and oxidative stress (Fišar and Hroudová 2010; Hroudová and Fišar 2011). ATP deficiency and the resulting alterations in energy metabolism may explain some features of mood disorders, e.g., physiological (sleep disturbances, fatigue), psychological (depressed mood, lack of motivation) and neurocognitive (impaired concentration and memory) abnormalities (E. Streck et al. 2014; Karabatsiakis et al. 2014). Primary mitochondrial disorders are associated with higher rates of depression (Anglin et al. 2012).
Prior to generation of ATP, oxidative phosphorylation diverts electrons extracted from nutrients into a transmembrane proton gradient, a process mediated by the electron transport chain (ETC) (Li et al. 2006). Cytochrome-c-oxidase (COX) is the final enzyme in the ETC, which is responsible for the maintenance of the transmembrane proton gradient that is used for ATP synthesis (Wikstrom 1977). Based on its rate-limiting role in this oxidative process (Arnold 2012), COX is considered a key marker of mitochondrial function (Srinivasan and Avadhani 2012).
Lower COX levels have been previously reported in major depressive disorder (MDD) and bipolar disorder (BD) based on peripheral blood measures, muscle biopsies and postmortem brain samples (for review see (L. Holper, Ben-Shachar, and Mann 2018)). In MDD, lower COX enzyme activity has been reported in peripheral platelets (Ben-Shachar et al. 1999) and muscle (Gardner et al. 2003, 2008) but greater COX mRNA expression has been found in serotonergic neurons of postmortem nucleus raphe in depressed suicide decedents (Sanchez-Bahillo et al. 2008). In BD, low COX enzyme activity, mRNA and protein expression have been reported in peripheral blood (Ben-Shachar et al. 1999; de Sousa et al. 2015; Naydenov AV et al. 2007; Washizuka et al. 2005; Beech et al. 2010), postmortem hippocampus (Altar et al. 2005; Konradi C et al. 2004) and postmortem frontal cortex (Iwamoto, Bundo, and Kato 2005; H. K. Kim et al. 2016; X. Sun et al. 2006). Further, there is evidence of abnormal mitochondrial function in vivo in the brain using neuroimaging methods. Specifically, 18F-fluorodeoxyglucose positron emission tomography (18F-FDG-PET) reveals metabolic changes in glucose utilization primarily in MDD that generally involves lower glucose uptake in dorsolateral prefrontal cortical and increased uptake in subcortical and ventral prefrontal cortex (De Crescenzo et al. 2017; Su et al. 2014; Schöll, Damián, and Engler 2014). Phosphorus (31)P magnetic resonance spectroscopy (MRS) has been used to assess decreased phosphocreatine as an indicator of mitochondrial oxidative phosphorylation, for example in frontal lobe, primarily in BD (for reviews see (Kato 2017; Quiroz et al. 2008; Clay, Sillivan, and Konradi 2011; Stork and Renshaw 2005; Moretti, Gorini, and Villa 2003)). However, while these techniques can assess some aspects of mitochondrial functions, they cannot measure COX activity directly.
To investigate COX activity in the present study, we used near-infrared spectroscopy (NIRS), an optical neuroimaging method. Compared to PET and MRS, NIRS is non-invasive, relatively low-cost, does not involve radiation, and can be applied in a physically minimally demanding setting (Obrig and Villringer 2003; Ferrari and Quaresima 2012; Wolf, Ferrari, and Quaresima 2007; Ferrari, Mottola, and Quaresima 2004). In our previous work, we showed that the COX signal has adequate test-retest reliability (Lisa Holper and Mann 2018). Consequently, NIRS permits highly feasible assessment of brain COX as a marker of mitochondrial function.
NIRS measures the oxidative state of COX’s chromophore (its binuclear copper CuA center), termed oxCOX signal, as well as hemodynamic signals in terms of oxygenated (HbO2) and deoxygenated (HHb) hemoglobin. Compared to the hemodynamic signals routinely assessed using NIRS (Ferrari and Quaresima 2012), the oxCOX signal has hitherto not been routinely assessed. While HbO2 and HHb provide information on blood flow and oxygenation, oxCOX is considered a key indicator of cellular oxygen metabolism (Ilias Tachtsidis et al. 2009; Highton et al. 2014; Kolyva et al. 2013; Ghosh et al. 2013). The concentration of oxCOX is approximately 10% that of hemoglobin, which makes it harder to detect. On the other hand, oxCOX is a stable (Bale, Elwell, and Tachtsidis 2016) and reliable signal (Lisa Holper and Mann 2018) with high brain specificity (de Roever et al. 2016). Thus, alterations in oxCOX indicate a change in mitochondrial metabolic balance (Bainbridge et al. 2014).
Previously, it has been shown that the oxCOX signal is a potential marker of mitochondrial function (Caldwell, Hapuarachchi, et al. 2015). Specifically, lower oxCOX activity, as hypothesized in major depressive episodes (MDE), can be related to reductions in mitochondrial parameters derived from computational modelling (Caldwell, Hapuarachchi, et al. 2015). In the present pilot study, we hypothesized that the oxCOX signal would be lower in MDE compared with control subjects.
2. Methods and materials
2.1. Study population
Patients with either DSM-IV MDD or BD were recruited at the New York State Psychiatric Institute (NYSPI)/Columbia University Medical Center. Patients were compared with physically and psychiatrically healthy controls (HC). All participants were assessed diagnostically using the Structured Clinical Interview for Axis I disorders (SCID-I/P) (First et al. 2002), the 24-item Hamilton Depression Rating Scale (HDRS) (Hamilton 1960) and the Young Mania Rating Scale (YMRS) (Young et al. 1978). Exclusion criteria for all participants included any uncontrolled medical condition, history of head trauma, any other major psychiatric disorder such as schizophrenia, schizoaffective disorder, current psychotic depression, substance abuse within the previous three months or substance dependence within the previous six months, a history of intolerable side effects from both citalopram and fluoxetine, a first-degree family history of schizophrenia, current serious suicidal ideation or behavior, pregnancy or currently lactating women. The Institutional Review Board of NYSPI approved the study protocol, and all participants gave written informed consent. All patients were taking part in other study protocols at NYSPI, explaining the variation in medication regimens, and why the MDD group was older than the other groups.
2.2. Respiratory challenges
Quantification of the oxCOX signal demands significant changes in arterial oxygen saturation to be reliably detected in the cortex. We therefore chose two respiratory challenges to systemically manipulate cerebral oxygenation via hypo- and hypercapnia, i.e., reduced and increased carbon dioxide in the blood, with the order of the challenges counterbalanced between participants (L. Holper, Scholkmann, and Seifritz 2015; Kolyva et al. 2014). Hypocapnia was induced by hyperventilation consisting of five repetitions of alternate periods of rapidly breathing in and out with constant respiratory volume (20 seconds) and normal breathing (40 seconds). Hypercapnia was induced by breath-holding consisting of five repetitions of alternate periods of breath holding (20 seconds) and normal breathing (40 seconds). Prior to recording, participants were trained to perform the inspirational breath-holding a volume of air, similar to a normal breath cycle, in order to avoid inhaling larger volumes of air than that of a normal breath cycle. Before and after each challenge, resting-states of five minutes of data were collected, during which participants were asked to sit still in order to allow the hemodynamic cortical system to normalize. The resting-state periods were not included in the data analysis.
2.3. NIRS instrumentation
A NIRO 300 instrument (Hamamatsu Photonics) was used to measure the oxCOX, HbO2 and HHb signals based in four discrete wavelengths (775, 810, 850, and 910 nm) (Ilias Tachtsidis et al. 2009, 2004; I Tachtsidis et al. 2007). Although, more recent broadband NIRS systems may obtain a more robust oxCOX signal (Bainbridge et al. 2014; Bale et al. 2014; Arifler et al. 2015), we have reported adequate signal detection and test-retest reliability with NIRO 300 (Lisa Holper and Mann 2018). The NIRO 300 measures concentration changes of oxCOX, HbO2 and HHb based on conventional differential spectroscopy with the use of the modified Beer-Lambert law (Patterson, Chance, and Wilson 1989; Delpy et al. 1988a). In addition, the system provides the tissue oxygenation index (TOI) based on the principle of spatially resolved reflectance spectroscopy (Delpy et al. 1988b; Matcher et al. 1995), which is in essence the proportion of HbO2 relative to total hemoglobin (HbO2 + HHb) concentration (Susumu Suzuki et al. 1999; Ilias Tachtsidis et al. 2008). The system uses four light sources (pulsed laser diodes) and three detectors (photodiodes) held in a light-proof holder, set at a distance of 4.5 cm, fixed in a rubber probe to allow for direct skin contact. Two channels were positioned to cover parts of the prefrontal cortex (i.e., Fp1/2, Brodmann area 10). Data were detrended, zero-meaned, and bandpass-filtered in the range 0.005 – 0.3 Hz, using a 5th order Butterworth filter, to remove physiological noise, based on functions of the HOMER2 processing package (Huppert et al. 2009). Peripheral physiological measures were estimated using a capnometer (LifeSense LS1–9R, Nonin Medical) by means of the arterial tissue oxygen saturation (SpO2) and the partial end-tidal carbon dioxide (PetCO2) of the exhaled air. Participants wore a nasal cannula through which tidal gases were sampled at 1 Hz.
2.4. Computational modelling
The computational procedures using the BS model outlined below regarding sensitivity analysis, model fit and model parameters are described in detail in previous work (Caldwell, Hapuarachchi, et al. 2015). The modelling of the oxCOX signal was our a priori primary metabolic signal of interest, because it provides important information about mitochondrial metabolic state related to reduced COX activity (Caldwell, Hapuarachchi, et al. 2015). The modelling of the TOI signal was our a priori secondary hemodynamic signal of interest (Caldwell, Hapuarachchi, et al. 2015). All modelling was performed separately for hypo-and hypercapnia, but results are presented averaged across both conditions, since no significant differences were found, as expected.
2.4.1. BS model
The BS model, described elsewhere (Caldwell, Hapuarachchi, et al. 2015), models metabolism and cerebral blood flow in the human adult brain. Simulations were carried out using the Brain/Circulation Model Developer (Banaji et al. 2008) implemented in Python (Python Software Foundation). The model was applied with the following variables: 1) Input signals. The two model inputs were the experimentally measured PetCO2 and SpO2. 2) Output signals. The two model outputs were oxCOX and TOI. 3) Model parameters. Based on the input signals, the model simulates the behavior of the output signal based on a large parameter space (N = 139) reflecting cerebral metabolism. Simulations were run individually for each patient and control participant.
2.4.2. Sensitivity analysis and optimization
The 20 most influential model parameters for the oxCOX and TOI signals (Table 2) were selected for an exploratory sensitivity analysis using the extended Fourier Amplitude Sensitivity Test (eFAST) (Cukier et al. 1973; Schaibly and Shuler 1973). eFAST calculates the unique contribution of each model parameter in determining the model output based on variance decomposition, i.e., the first-order sensitivity index (S1) of a given parameter i, and a summed sensitivity index of the entire complementary set of parameters (all parameters except i), i.e., the total-order sensitivity indices (ST). The larger the S1, the more influential a parameter is on the output, while larger ST indicates a greater degree of interaction of a parameter i with other parameters.
Table 2. Optimized model parameters.
The 20 most influential model parameters on oxCOX and TOI included in the optimization are shown with initial values and ranges before optimization. Parameters are ordered from top to bottom according to their sensitivity to oxCOX and TOI, respectively.
| oxCOX parameters | Unit | Initial value |
Range | |
|---|---|---|---|---|
| oxCOX signal | Oxidized cytochrome-c-oxidase assessed by NIRS | |||
| CuA,o,n | Normal concentration of oxidized CuA | mM | 0.066 | 0.046–0.085 |
| Volmit | Fraction of brain tissue volume that is mitochondria | - | 0.067 | 0.054–0.080 |
| klk2 | Constant controlling depending of leak rate Llkon Δp | mV−1 | 0.038 | 0.030–0.456 |
| Δpn | Normal value of Δp (proton-motive force) | mV−1 | 168.611 | 118.028–219.194 |
| NADn/NADHn | Normal NAD+/NADH ratio | - | 9 | 0.1–20 |
| k1,n | Forward reaction rate for CuAreduction at normal Δp/NADH | s−1 | 8.3 | 5.810–10.790 |
| ck1 | Parameter controlling sensitivity of k1to Δp | mV−1 | 0.01 | 0.008–0.012 |
| Tmax,0 | Maximal muscular tension under normal regulatory stimulus | mmHg cm | 2.11 | 1.477–2.743 |
| vCO2,n | Normal filtered carbon dioxide partial pressure | mmHg | 40 | 28–52 |
| ϕ | Oxygen concentration at half-maximal saturation | mM | 0.036 | 0.029–0.043 |
| rm | Vessel radius at which muscular tension is maximal | cm | 0.027 | 0.022–0.032 |
| kunc | Parameter simulating effect of uncouplers to the system | - | 1 | 0.8–1.2 |
| COXtis | Concentration of COX in tissue | mM | 0.006 | 0.004–0.007 |
| Llk0 | Constant controlling the depending of the leak rate Llk on Δp | mM s−1 | 0.004 | 0.003–0.006 |
| ptot | Total protons moved out of mitochondrial matrix | - | 20 | 18–20 |
| Kσ | Parameter controlling sensitivity of σe to vessel radius | - | 10 | 7–13 |
| CVinh | Control parameter representing action of CCO inhibitors | - | 1 | 0.8–1.2 |
| vu,n | Normal filtered demand | - | 1 | 0.7–1.3 |
| h0 | Thickness of blood vessel walls at which radius is r0 | cm | 0.003 | 0.002–0.004 |
| Pic | Intracranial pressure | mmHg | 9.5 | 7–11 |
| TOI parameters | Unit | Initial value |
Range | |
| TOI signal | Tissue oxygenation index assessed by NIRS | |||
| Tmax,0 | Maximal muscular tension under normal regulatory stimulus | mmHg cm | 2.109 | 1.477–2.743 |
| D02 | Diffusion rate for oxygen between capillaries and mitochondria | s−1 | 0.842 | 0.589–1.094 |
| rt | Radius in the muscular tension relationship | cm | 0.018 | 0.014–0.022 |
| ϕ | Oxygen concentration at half-maximal saturation | mM | 0.036 | 0.029–0.043 |
| vCO2,n | Normal filtered carbon dioxide partial pressure | mmHg | 40 | 28–52 |
| rn | Normal effective blood vessel radius | cm | 0.019 | 0.015–0.022 |
| Kσ | Parameter controlling sensitivity of σe to vessel radius | - | 10 | 7–13 |
| Volv | Relative venous blood volume | - | 0.75 | 0.525–0.975 |
| klk2 | Constant controlling depending of leak rate Llkon Δp | mV−1 | 0.038 | 0.030–0.456 |
| vO2,n | Normal filtered capillary oxygen concentration | mM | 0.064 | 0.045–0.084 |
| kaut | Overall functioning of autoregulatory response | - | 1 | 0–1 |
| NADn/NADHn | Normal NAD+/NADH ratio | - | 9 | 0.1–20 |
| vu,n | Normal filtered demand | - | 1 | 0.7–1.3 |
| σe,0 | Parameter in elastic tension relationship | mmHg | 0.143 | 0.114–0.171 |
| RCO2 | Autoregulatory reactivity to carbon dioxide | - | 2.2 | 1.5–2.9 |
| ε0NADH | Standard redox potential for NADH | mV | −320 | −384−-256 |
| Δpn | Normal value of Δp (proton-motive force) | mV−1 | 168.611 | 118.028–219.194 |
| COXtis | Concentration of COX in tissue | mM | 0.006 | 0.004–0.007 |
| Llk0 | Constant controlling depending of leak rate Llk on Δp | mM s−1 | 0.004 | 0.003–0.006 |
| p2 | Proton cost of reaction reducing a3 | − | 4 | 2.8–5.2 |
Optimization of all 20 parameters was carried out using a Global Problem (GLP) solver (solver: de, maximum iterations 1000) to minimize the difference (Euclidean distance) between the measured and modelled signals on which the corresponding parameters were influential. Parameters for each patient and control participant were optimized at once, in order to reduce the dimensionality of the optimizations (Caldwell, Moroz, et al. 2015). The initial model values (before optimization) and their ranges used for optimization are given in Table 2.
2.4.3. Statistical analysis
Statistical analysis was carried out using Matlab (Mathworks, Verision 2017b).
Preconditions for parametric testing, such as normality using the Lilliefors test and homogeneity of variance using O’Brien’s modification of Levene’s test, were checked for both oxCOX and TOI signals and their related parameter space.
Changes in the absolute block-averaged oxCOX and TOI signals were computed from baseline, i.e., time-locked two seconds before onset of hypo-/hypercapnia, to challenge, i.e., time-locked two seconds after offset of hypo-and hypercapnia.
Changes in the model parameters were expressed as percentage change (%) of the optimized values (after optimization) for each patient and control relative to the initial model values (before optimization).
| (1) |
Linear mixed-effect regression was used to statistically assess the effect of patient versus control group (fixed effects) on the signal changes and corresponding optimized model parameters (responses), while controlling for age, PaCO2 and SaO2 (random effects) to account for normal aging and systemic effects; note that repeating the ANOVA without controlling for those covariates did not change results. ANOVA with Bonferroni correction was applied to account for multiple comparisons.
Spearman correlation coefficients were calculated to assess the relation of the signal changes and corresponding optimized model parameters to depression severity as assessed by the HDRS.
3. Results
3.1. Study population
Demographics of patients and controls are listed in Table 1. Higher HDRS scores (main effect F2 = 26.43, p < 0.0001) were seen in MDD (22.6 ± 11.6) and BD (23.5 ± 3.6) patients compared to controls (2.3 ± 2.2). In the MDD group, 6/7 of patients had late-life depression (LLD) and were thus older (64.4 ± 17.2) than the control (32.3 ± 10.06) and BD groups (40.8 ± 12.4) (main effect F2 = 16.57, p < 0.0001; post-hoc MDD vs. HC p < 0.0001; BD vs. HC p = 0.199, MDD vs. BD p = 0.007). Medication status also differed between groups. While 6/7 MDD subjects were medication-free, one MDD patient had started taking citalopram (20 mg/d) less than two weeks before scanning. All BD patients were on a consistent dose of a mood stabilizer at scanning (1 × lithium 1350mg/d, 4 × valproic acid 750–1000mg/d, 1 × lamotrigine 250mg/d) and 5/6 had started fluoxetine (20mg/d) less than two weeks prior to scanning (range 1 – 13 days).
Table 1. Demographics.
Patients with major depression disorder (MDD, N = 7) and bipolar disorder (BD, N = 6) compared to controls (N = 10). m = male, f = female. HDRS = Hamilton Depression Rating Scale. Medication: escitalopram (20mg/d), fluoxetine (20mg/d), lamotrigine (250mg/d), lithium (1350mg/d), valproic acid (750–1000mg/d).
| Subjects | Sex | Age | HDRS | Previous episodes |
Medication | Race | Education (years) |
|---|---|---|---|---|---|---|---|
| MDD | f | 30 | 1 | 0 | none | More than one race | 17 |
| MDD | f | 63 | 39 | 3 | none | Black or African American | 21 |
| MDD | f | 63 | 23 | 1 | none | Black or African American | 16 |
| MDD | f | 63 | 31 | 1 | none | Black or African American | 13 |
| MDD | f | 79 | 19 | 1 | escitalopram | White | 18 |
| MDD | f | 70 | 26 | 1 | none | White | 17 |
| MDD | m | 83 | 18 | 0 | none | White | 12 |
| BD | f | 44 | 21 | 0 | valproic acid, fluoxetine | White | 16 |
| BD | f | 29 | 23 | 0 | lamotrigine, fluoxetine | White | 15 |
| BD | m | 56 | 19 | 0 | lithium | White | 16 |
| BD | m | 45 | 23 | 1 | valproic acid, fluoxetine | Black or African American | 17 |
| BD | f | 23 | 29 | 3 | valproic acid, fluoxetine | White | 16 |
| BD | m | 48 | 26 | 0 | valproic acid, fluoxetine | White | 17 |
| Control | m | 52 | 0 | 0 | none | Black or African American | 13 |
| Control | f | 28 | 5 | 0 | none | White | 14 |
| Control | m | 41 | 0 | 0 | none | White | 16 |
| Control | f | 26 | 1 | 0 | none | Black or African American | 19 |
| Control | m | 23 | 3 | 0 | none | Asian | 17 |
| Control | f | 24 | 6 | 0 | none | White | 16 |
| Control | f | 31 | 1 | 0 | none | Black or African American | 16 |
| Control | f | 28 | 5 | 0 | none | White | - |
| Control | f | 45 | 0 | 0 | none | White | 16 |
| Control | f | 25 | 3 | 0 | none | Black or African American | 16 |
3.2. Preconditions for parametric testing
The preconditions for parametric testing were fulfilled for both oxCOX and TOI signals and their related parameter space (not reported), including normality as assessed using the Lilliefors test (oxCOX signal: BD k-stats = 0.25, p = 0.287; MDD k-stats = 0.40, p = 0.001; HC k-stats = 0.17, p = 0.500; TOI signal: BD k-stats = 0.22, p = 0.468; MDD k-stats = 0.30, p = 0.168; HC k-stats = 0.22, p = 0.195) and homogeneity of variance between groups as assessed using O’Brien’s modification of Levene’s test (oxCOX signal F = 1.62, p = 0.222; TOI signal F = 0.04, p = 0.961).
3.3. Sensitivity analysis and optimization
In line with previous work (Caldwell, Hapuarachchi, et al. 2015), only a small part of the optimized model parameter space dominated the influence on the oxCOX and TOI signals, which space we selected for optimization. All parameters optimized reflected aspects of mitochondrial function and blood flow. The names and definitions of the parameters as well as the order of their sensitivity to the corresponding signals are given in Table 2.
3.4. Signal changes in oxCOX and TOI
Results revealed typical patterns of response to the respiratory challenges with hypocapnia producing a decrease in oxCOX and TOI and hypercapnia producing an increase in oxCOX and TOI (Bale, Elwell, and Tachtsidis 2016). The absolute block-averaged signal changes across both challenges revealed smaller oxCOX responses in the MDE groups (ANOVA main effect MDE vs. HC F2,20 = 7.22, p = 0.014), indicating less efficient COX function compared to controls (Figure 1, Top). This effect correlated strongly with depression severity across the MDE groups (Spearman, r = −0.72, p = 0.006) (Figure 2). By contrast, the hemodynamic signal TOI revealed no significant differences between groups (MDE vs. HC F2,20 = 0.50, p = 0.487) and no correlation with depression severity (Table 3).
Figure 1. Signal and parameter changes.
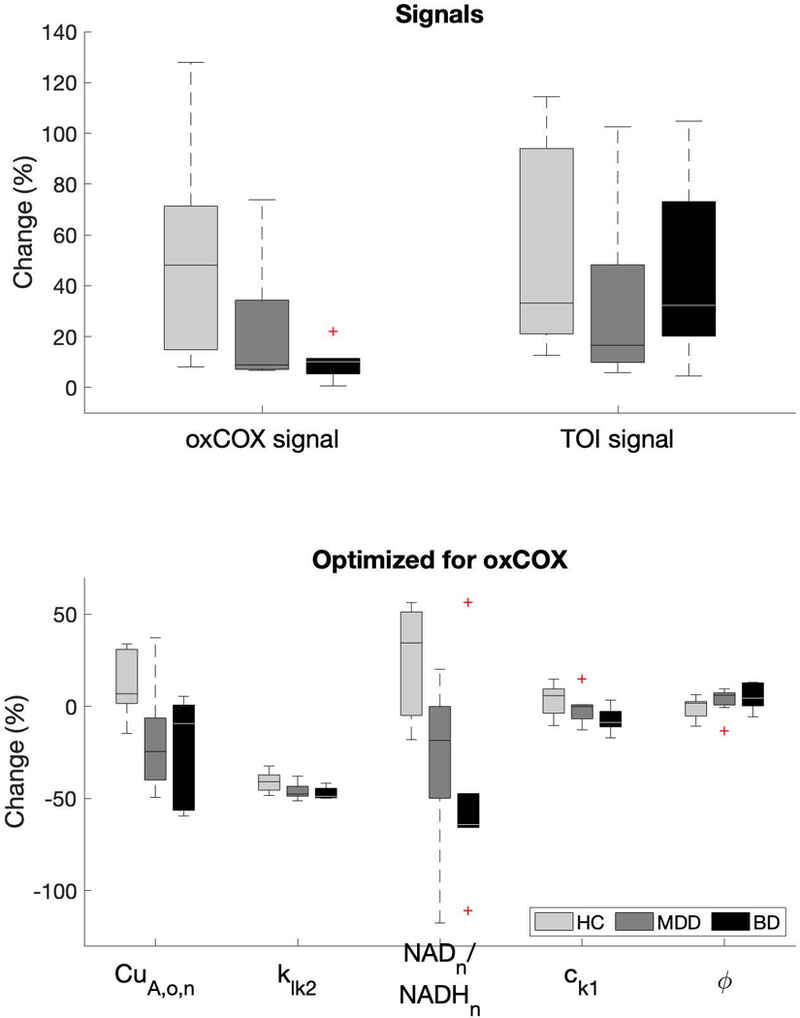
Boxplots illustrating the oxCOX and TOI signal changes and the parameters optimized for the oxCOX signals being significantly different between patients and controls as assessed using ANOVA. Note that the parameters values, and thus the percentage changes (%), are estimates and not true physical quantities. Note that the oxCOX and TOI signals on top assume an arbitrary 50% change in controls. Parameters are defined in Table 2 and statistics are reported in Table 3.
Figure 2. Correlation oxCOX parameters and HDRS.
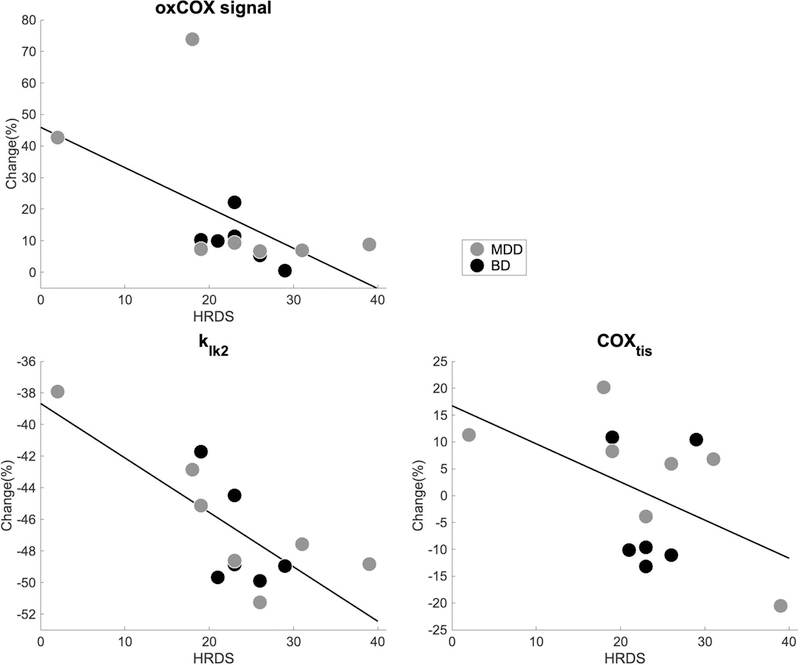
Scatter plots of the correlation between depression severity and selected parameters optimized for the oxCOX signal assessed using Spearman correlation, i.e., CuA,o,n (r = −0.72, p = 0.006), klk2 (r = −0.63, p = 0.022) and COXtis (r = −0.58, p = 0.039). These parameters correlated inversely with increasing depression severity indicating lower oxidative properties with higher symptom severity. Note that the parameters values, and thus the percentage changes (%), are estimates and not true physical quantities. Parameters are defined in Table 2 and statistics are reported in Table 3.
Table 3.
ANOVA for oxCOX and TOI and their related parameters. Main effects are shown between diagnoses within depressive episodes (MDE) versus controls, with post-hoc comparisons between major depressive disorder (MDD) and bipolar disorder (BD) versus controls; there were no significant differences between MDD and BD. A separate ANOVA tested medication effects for which main effects are shown between subjects receiving medication versus no medication, with post-hoc comparisons between mood stabilizers (MS) and antidepressants (AD) versus no medication (none). The covariate age had no significant effect. (Last two columns) Spearman correlation for oxCOX and TOI and their related parameters across MDD and BD patients with HDRS. Significant effects are highlighted (bold). Definitions of parameters can be found in Table 2.
| ANOVA diagnoses | ANOVA medication | Correlation | ||||||||
|---|---|---|---|---|---|---|---|---|---|---|
| Main effect | Post-hoc | Main effect | Post-hoc | |||||||
| MDE vs controls |
MDD vs controls |
BD vs controls |
Medication vs none |
MS vs none |
AD vs none |
MDD/BD vs HDRS | ||||
| F2,20 | p-value | p-value | p-value | F2,20 | p-value | p-value | p-value | r | p-value | |
| oxCOX signal | 7.22 | 0.014 | 1.000 | 0.028 | 2.35 | 0.121 | 1.000 | 1.000 | −0.72 | 0.006 |
| CuA,o,n | 9.86 | 0.005 | 0.435 | 0.012 | 1.36 | 0.280 | 1.000 | 1.000 | −0.22 | 0.473 |
| Volmit | 1.66 | 0.212 | 0.678 | 0.459 | 0.98 | 0.391 | 0.352 | 0.508 | 0.42 | 0.155 |
| klk2 | 8.72 | 0.008 | 0.760 | 0.017 | 1.62 | 0.224 | 1.000 | 0.685 | −0.63 | 0.022 |
| Δpn | 0.57 | 0.457 | 1.000 | 1.000 | 0.70 | 0.509 | 1.000 | 1.000 | −0.30 | 0.325 |
| NADn/NADHn | 14.18 | 0.001 | 0.627 | 0.002 | 3.68 | 0.044 | 1.000 | 0.732 | −0.19 | 0.526 |
| k1,n | 3.47 | 0.076 | 1.000 | 0.156 | 3.34 | 0.056 | 0.137 | 0.054 | −0.45 | 0.121 |
| ck1 | 5.09 | 0.035 | 1.000 | 0.055 | 3.17 | 0.064 | 1.000 | 0.586 | −0.23 | 0.444 |
| Tmax,0 | 1.12 | 0.302 | 0.265 | 0.774 | 3.47 | 0.051 | 1.000 | 0.364 | 0.13 | 0.665 |
| vCO2,n | 0.09 | 0.771 | 1.000 | 1.000 | 0.88 | 0.429 | 0.398 | 0.554 | 0.11 | 0.719 |
| ϕ | 6.03 | 0.023 | 1.000 | 0.107 | 3.75 | 0.041 | 0.708 | 1.000 | −0.01 | 0.971 |
| rm | 0.15 | 0.702 | 0.264 | 1.000 | 1.80 | 0.191 | 0.485 | 1.000 | −0.35 | 0.246 |
| kunc | 0.64 | 0.434 | 0.688 | 0.838 | 0.37 | 0.697 | 0.854 | 1.000 | −0.31 | 0.302 |
| COXtis | 3.96 | 0.060 | 1.000 | 0.101 | 2.43 | 0.113 | 1.000 | 0.243 | −0.58 | 0.039 |
| Llk0 | 0.69 | 0.417 | 0.352 | 0.895 | 1.06 | 0.364 | 0.496 | 1.000 | −0.02 | 0.957 |
| ptot | 0.82 | 0.375 | 1.000 | 0.718 | 1.81 | 0.189 | 0.540 | 1.000 | 0.49 | 0.089 |
| Kσ | 0.01 | 0.907 | 1.000 | 1.000 | 0.52 | 0.604 | 0.677 | 0.687 | 0.12 | 0.692 |
| CVinh | 0.14 | 0.712 | 0.871 | 1.000 | 0.20 | 0.818 | 1.000 | 1.000 | 0.09 | 0.766 |
| vu,n | 1.28 | 0.271 | 1.000 | 0.563 | 1.82 | 0.188 | 0.283 | 1.000 | −0.32 | 0.280 |
| h0 | 0.00 | 0.986 | 1.000 | 1.000 | 0.23 | 0.799 | 1.000 | 1.000 | 0.23 | 0.444 |
| Pic | 2.04 | 0.168 | 0.614 | 0.369 | 0.52 | 0.605 | 0.803 | 1.000 | −0.16 | 0.606 |
| TOI signal | 0.50 | 0.487 | 1.000 | 0.996 | 1.50 | 0.248 | 0.213 | 0.472 | −0.27 | 0.369 |
| Tmax,0 | 2.32 | 0.143 | 1.000 | 0.430 | 1.99 | 0.163 | 1.000 | 0.960 | −0.29 | 0.331 |
| D02 | 0.15 | 0.699 | 1.000 | 1.000 | 0.37 | 0.694 | 0.816 | 1.000 | −0.04 | 0.901 |
| rt | 0.31 | 0.582 | 1.000 | 1.000 | 2.49 | 0.108 | 0.108 | 0.460 | 0.16 | 0.613 |
| ϕ | 0.06 | 0.811 | 1.000 | 1.000 | 0.20 | 0.824 | 1.000 | 1.000 | 0.18 | 0.681 |
| vCO2,n | 1.10 | 0.306 | 0.406 | 0.661 | 0.04 | 0.960 | 1.000 | 1.000 | 0.25 | 0.403 |
| rn | 2.53 | 0.126 | 0.756 | 0.181 | 3.08 | 0.068 | 1.000 | 0.216 | −0.13 | 0.667 |
| Kσ | 5.71 | 0.026 | 1.000 | 0.074 | 2.06 | 0.154 | 1.000 | 1.000 | −0.28 | 0.349 |
| Volv | 2.29 | 0.145 | 1.000 | 0.519 | 1.62 | 0.222 | 1.000 | 1.000 | −0.09 | 0.779 |
| klk2 | 2.20 | 0.153 | 0.703 | 0.287 | 1.46 | 0.257 | 0.316 | 0.857 | 0.04 | 0.685 |
| vO2,n | 0.07 | 0.791 | 0.777 | 1.000 | 0.31 | 0.739 | 1.000 | 0.885 | 0.24 | 0.424 |
| kaut | 1.00 | 0.329 | 0.205 | 0.515 | 0.12 | 0.891 | 1.000 | 1.000 | −0.29 | 0.334 |
| NADn/NADHn | 0.52 | 0.480 | 1.000 | 0.943 | 3.11 | 0.067 | 0.091 | 0.578 | −0.29 | 0.336 |
| vu,n | 0.44 | 0.513 | 0.669 | 0.916 | 1.29 | 0.297 | 1.000 | 0.493 | 0.34 | 0.255 |
| σe,0 | 0.55 | 0.468 | 0.978 | 0.861 | 0.98 | 0.391 | 1.000 | 0.739 | 0.31 | 0.305 |
| RCO2 | 0.08 | 0.780 | 0.445 | 1.000 | 1.17 | 0.330 | 0.967 | 0.393 | 0.30 | 0.318 |
| ε0NADH | 0.00 | 0.987 | 1.000 | 1.000 | 0.77 | 0.478 | 0.652 | 1.000 | 0.20 | 0.508 |
| Δpn | 0.02 | 0.876 | 0.925 | 1.000 | 0.49 | 0.619 | 1.000 | 0.701 | 0.49 | 0.086 |
| COXtis | 0.04 | 0.846 | 1.000 | 1.000 | 0.65 | 0.534 | 0.538 | 0.701 | −0.11 | 0.729 |
| Llk0 | 0.30 | 0.592 | 0.828 | 1.000 | 0.89 | 0.427 | 1.000 | 0.655 | 0.41 | 0.163 |
| p2 | 3.00 | 0.098 | 1.000 | 0.163 | 3.19 | 0.063 | 0.177 | 0.045 | 0.40 | 0.173 |
Secondary ANOVA analyses assessing the effects of medication or age of the participants revealed no significant effects on either oxCOX or TOI (Table 3). Although the study was not powered to detect differences between MDD and BD groups, secondary analysis found no significant difference in oxCOX or TOI between MDD and BD groups. Nevertheless, the reduction in oxCOX in MDE groups compared to controls was driven primarily by lower oxCOX in the BD group, (Table 3).
3.5. Optimized model parameters for oxCOX and TOI
To provide a realistic picture of the differences in the parameters between patients and controls, the optimized values were expressed as percentage changes (%) relative to the initial value (Figure 1, Bottom). Statistical assessment using linear mixed-effect regression revealed that four model parameters optimized for the oxCOX signal were sensitive to the effects of depression. In particular, the parameters CuA,o,n (ANOVA main effect MDE vs. HC F2,20 = 9.86, p = 0.005), klk2 (F2,20 = 8.72, p = 0.007), NADn/NADHn (F2,20 = 14.18, p = 0.001), and ck1 (F2,20 = 5.09, p = 0.035) decreased in the MDE groups, whereas ϕ (F2,20 = 6.03, p = 0.023) increased in the MDE groups compared to controls, all primarily accounted for by the differences between BD and controls (Table 3). There were no significant differences detected between MDD versus BD. A separate ANOVA assessing medication effects revealed modest significant effects indicating decreasing NADn/NADHn (F2,20 = 3.68, p = 0.044) and increasing ϕ (F2,20 = 3.74, p = 0.041) with medication, however without significant differences post-hoc comparisons, which again were not powered adequately given the small number of cases (Table 3).
Some parameters also showed a moderate correlation with depression severity after adjusting for age (Figure 2). In particular, klk2 (r = −0.63, p = 0.022) and COXtis (r = −0.58, p = 0.039) were inversely correlated with increasing depression severity indicating lower oxidative properties with higher symptom severity (Table 3).
Only one of the parameters optimized for the TOI signal, Kσ, showed a difference between MDE and controls (main effect MDE vs. HC F2,20 = 5.71, p = 0.026) but without correlation with depression severity. None of the other parameters optimized for TOI showed group differences (all p > 0.05) (Figure 1) or correlations with HDRS score (all p > 0.05) (Figure 2, Table 3). ANOVA assessing medication effects revealed no significant effects on TOI parameters (Table 3).
3.6. Power analysis
Due to limitations of sample size, we performed a post-hoc power analysis using the pwr package (Champely 2018) in R (R Development Core Team 2008). Given the observed mean COX differences between HC and MDE groups of d = 1.13 (between HC and MDD d = 0.81, between HC and BD d = 1.28) with N = 23 subjects, we calculated a power of 0.73 for the comparison between HC versus MDE (0.34 for the comparison HC versus MDD, 0.64 for the comparison HC versus BD) at a significance level of 0.05 using t-test for independent samples. We asked what minimum difference between HC and MDE groups would have been detectable with our N = 23 subjects if we would have had a power of 0.8, and calculated a change of d = 1.24. Lastly, we ccomputed the number of participants that would be needed to detect a change similar in size of our observed effect (d = 1.13) with a power of 0.8, yielding at least N = 21 participants.
4. Discussion
This is the first study to evaluate oxCOX signal using NIRS in subjects experiencing major depressive episodes. The oxCOX signal is a proposed marker of mitochondrial health (Bale, Elwell, and Tachtsidis 2016). Our results indicate that both experimentally measured oxCOX signal and computationally modelled mitochondrial parameters are altered in mood disorders. There were two main findings. Firstly, experimentally measured oxCOX activity was lower in the MDE groups and correlated with depression severity (Figure 1 & 2). Secondly, optimized mitochondrial parameters for oxCOX relating to the electron transport chain detected lower activity in MDE, largely in the BD disorder group, when compared with HC, with lower activity correlating with depression severity (Figures 1 & 2). These parameters are potential mitochondrial contributors to an oxCOX marker. Combining oxCOX measurements derived from NIRS with computational modelling may therefore potentially enhance our understanding of which factors drive mitochondrial dysfunction in MDEs. Our power analysis indicated that the study was relatively underpowered, so these data should therefore be considered pilot results that require replication with a larger sample size. Confidence in the findings is thus tempered by the small sample size limiting statistical power for subgroup comparisons, such as between MDD and BD. Although the results appear to be largely driven by the BD subjects, despite the lack of a significant difference between MDD versus BD, we observed differences between MDE and controls and lack of a difference between BD and controls. Together, our results suggest that mitochondrial abnormalities that have been previously reported in the periphery (L. Holper, Ben-Shachar, and Mann 2018) may be present in the brain in mood disorders.
The computational model used here cannot prove dysfunction of the modelled mitochondrial mechanisms, because the optimized parameters are estimates and not true physical quantities. The model can, however, approximate alterations in the mitochondrial mechanisms that in principle can produce the reduced oxCOX response observed in depressed patients (Caldwell, Hapuarachchi, et al. 2015). These mechanisms may reflect disease-specific information that may together be used as a marker of mitochondrial health in MDEs. We briefly highlight the main functions of the parameters analysed here, and discuss their relevance to current literature in mood disorders.
COX (also known as complex IV) is the last enzyme of the ETC within the process of oxidative phosphorylation at the inner mitochondrial membrane. CuA,o,n represents the normal concentration of its oxidized CuA center (i.e., after the loss of electrons), indicating the portion of COX already used for electron transfer, in contrast to the concentration of reduced CuA (CuA,r,n, i.e., after the gain of electrons), whereas COXtis indicates its overall concentration in tissue. In the case of COX deficiency as part of the pathophysiology of depression, both CuA,o,n and COXtis would be expected to decrease because of less functional COX availability, as observed in the present study (Figure 1). The correlation with depression severity corroborates our results suggesting that CuA,o,n and COXtis can be related to physical quantities (Figure 2).
The NAD+/NADH ratio (nicotinamide adenine dinucleotide, NAD) is the product of complex I (NADH dehydrogenase) of the ETC. The two enzymes, complexes I and IV, are functionally closely related in that complex IV is required for the assembly and stability of complex I (Li et al. 2007; Diaz et al. 2006; Schäfer et al. 2007). Although, our model does not directly estimate complex I activity, we can use its product, the NAD+/NADH ratio, as an indicator of complex I functioning. The NAD+/NADH ratio defines the balance between oxidized NAD+ biosynthetic and reduced NADH consuming pathways, which plays a critical role in energy production and antioxidant defences. Due to its proton pumping function at the beginning of the ETC (Schäfer et al. 2007; Rich 2003; Belenky, Bogan, and Brenner 2007), the NAD+/NADH ratio can be thought of as the fuel of the ETC (Belenky, Bogan, and Brenner 2007; Houtkooper et al. 2010; Lin and Guarente 2003). A decrease of the NAD+/NADH ratio can lead to the formation of reactive oxygen species that potentially contribute to mitochondrial damage (Lin and Guarente 2003; Murphy 2009; Ben-Shachar and Karry 2008). In the case of deficient COX as part of the pathophysiology of depression, the NAD+/NADH ratio would be expected to decrease, as observed in the present study (Figure 1). The correlation of the NAD+/NADH ratio with depression severity indicates that the scenario modelled here, could be related to physical quantities (Figure 2).
The potential importance of the interplay between NADH-dehydrogenase (complex I) and COX (complex IV) (Li et al. 2007) in depression is also supported by previous studies reporting less complex I and IV activity in MDD (Gardner et al. 2003, 2008; Ben-Shachar and Karry 2008) and BD (Washizuka et al. 2005; X. Sun et al. 2006; de Sousa et al. 2015; Beech et al. 2010; H. K.Kim et al. 2016; Konradi C et al. 2004; Altar et al. 2005; Ben-Shachar and Karry 2008; Iwamoto, Bundo, and Kato 2005; Naydenov AV et al. 2007), a reduced complex I/IV enzyme-ratio in muscle mitochondria of MDD patients (Gardner et al. 2003) as well as a reduction of the NAD+/NADH ratio in patients with first-episode BD as assessed using MRS (S.-Y. Kim et al. 2017). 1
The fundamental proton pumping role of both complexes I and IV (Barney 2017) builds and maintains the transmembrane proton gradient used by ATP synthase to synthesize most of the cell’s ATP (Wikstrom 1977). The proton-motive force, Δp, resulting from that transmembrane proton gradient, promotes proton movement down the electrochemical potential across the mitochondrial membranes in two directions. The protons pumped out of the mitochondria are used by COX for electron transfer, and thus, reduction of O2 to H2O. Protons re-enter the mitochondria via two processes, either associated with ATP production or through endogenous proton leak channels (Nicholls 1977; Korzeniewski and Zoladz 2001). These proton leaks serve the important purpose of preventing dielectric membrane breakdown (in limiting Δp), and restricting leakage of single electrons from the ETC to form superoxide (Brand et al. 1994; Rolfe and Brand 1997). The parameters klk2 (the parameter controlling the sensitivity of the leak current to changes in Δp) and ck1 (a parameter controlling the sensitivity of k1 to Δp), correlated with depression severity or differed between patients and controls (Figures 1 & 2). Hence, a major endpoint of all of these processes is the maintenance of Δp, as it is key to mitochondrial survival (Storey 2004). Under conditions of deficient COX activity with insufficient proton pumping, the resultant collapse of Δp can lead to cells becoming ATP users instead of being ATP producers (Wikström et al. 2015). This ATP imbalance may be related to some of the pathophysiological manifestations of mood disorders such as fatigue, lack of motivation or working memory deficits (E. Streck et al. 2014; Karabatsiakis et al. 2014).
The current literature provides several hypotheses on the connection between mitochondrial dysfunction an mood disorders (McCann and Ross 2018), based on glucocorticoid-induced stress (Wallace 2005), oxidative stress (Bakunina, Pariante, and Zunszain 2015), and susceptibility to genetic alterations (Pei and Wallace 2018). The assumption that COX activity might be more deficient in BD compared with MDD, as our findings might suggest (Fig. 1–2), needs to be replicated in a future study. A study in a larger and medication-free sample of MDD and BD subjects would address this question. It also remains to be determined in BD whether this deficient COX activity is absent when the patient becomes euthymic and how it is impacted by a switch into mania.
Several methodological limitations should be considered when interpreting our findings. The sample size was small and the MDE groups were heterogenous with respect to diagnosis, age, and medication status. The majority (6/7) of the MDD patients were older than 60 years of age and met criteria for late-life depression (LLD). LLD differs from younger patients with MDD in both pathophysiology and clinical presentation (Glover and Srinivasan 2013). Since there is an age-dependent decline of mitochondrial functioning (N. Sun, Youle, and Finkel 2016; L. Holper, Ben-Shachar, and Mann 2018), the present results may not generalize to a younger MDD population. However, our findings of lower activity in MDE survived statistical age-adjustment and we therefore suggest that age may not be the main contributing factor for the observed reduced COX activity in MDE. The lack of effect of age on differences between MDE and HC groups may be explained by the fact that the group differences were largely driven by the BD group, and that BD did not have significant age differences from HCs. Of note, most of the patients were medicated. One of the MDD subjects was taking escitalopram, a selective serotonin reuptake inhibitor (SSRI). We note that this patient’s data were not outliers in the analysis. Escitalopram has not been shown to affect mitochondrial function in general or COX activity in particular (Gonçalves et al. 2012; Shetty et al. 2015), although other SSRIs may decrease mitochondrial function (Adzic et al. 2016; Hroudová and Fisar 2010). Further, 5/6 of BD patients had commenced antidepressant treatment with fluoxetine, another SSRI, within two weeks of scanning. Fluoxetine has so far not been reported to have a clear effect on COX but that may depend on sex (Adzic et al. 2013; Adzic, Mitic, and Radojcic 2017) and be brain region-specific (Shumake et al. 2010; Freo et al. 2000; Padilla et al. 2011). Lastly, all BD patients were receiving mood stabilizers at the time of scanning. Mood stabilizers, such as lithium or valproic acid, when given as long-term treatment have not been found to affect mitochondrial function (Kato 2017; Clay, Sillivan, and Konradi 2011), instead, they have been suggested to protect against mitochondria-targeted neurotoxicity (Bachmann et al. 2009) thereby preserving or even enhancing mitochondrial function in general (X. Sun et al. 2006) and COX activity in particular (Hroudová and Fisar 2010; Bachmann et al. 2009; E. L. Streck et al. 2015; Cancelier et al. 2017). Our results showed that these medications may had modest effects on oxCOX or related parameters (Table 3). Based on the literature and these findings, it is unlikely that the larger effects in BD are solely driven by an inhibition of COX by the small effects of SSRIs; nevertheless, our findings require further evaluation in medication-free depressed patients.
In conclusion, we found in this pilot study that the brain oxCOX signal was lower in MDE, and computational modelling identified alterations in key parameters of mitochondrial metabolism based on the impaired oxCOX signal. While this preliminary finding is consistent with measures of mitochondrial function in blood cells and muscle biopsies, and reports of less FDG uptake in dorsolateral prefrontal cortex in MDE, we cannot rule out an effect of antidepressants, or be certain that the finding is present in both MDD and BD. The small number of subjects as well as the intergroup heterogeneity is not sufficient for a robust conclusion. Future research therefore needs to replicate our findings in a larger, unmedicated mood disorder sample. Given the reported implication of mitochondrial abnormalities in BD and other psychiatric illnesses reported in blood, muscle and now here in brain, the study of mitochondrial metabolism using NIRS is an exciting, novel approach to disease etiology. Its correlation with depression severity suggests that oxCOX may be a potential biomarker of clinical response, and perhaps even a novel target of treatment.
Acknowledgments
Funding
The work was supported by a Janssen Fellowship in Translational Neuroscience and a Fellowship by the Brain & Behavior Research Foundation (formerly NARSAD) awarded to LH and NIH grants (5P50MH090964 and 5R01MH108032).
Footnotes
Conflict of Interest
Dr. Mann received royalties for commercial use of the C-SSRS from the Research Foundation of Mental Hygiene. Dr. Lan received salary support from an Independent Medical Education Grant from Sunovion Pharmaceuticals. The other authors report no conflict of interest.
Data availability statement
Authors provide the data if requested.
Notably, while MRS measures total, free and protein-bound NAD+ and NADH forms because spectroscopy cannot distinguish between subcellular (i.e., cytosolic or mitochondrial) compartments (Lu et al. 2014; Du F et al. 2014), the current BS model version (Caldwell, Hapuarachchi, et al. 2015) calculates mitochondrial NAD+ and NADH concentrations.
References
- Adzic Miroslav, Brkic Zeljka, Bulajic Sonja, Mitic Milos, and Radojcic Marija B.. 2016. “Antidepressant Action on Mitochondrial Dysfunction in Psychiatric Disorders.” Drug Development Research 77 (7): 400–406. 10.1002/ddr.21332. [DOI] [PubMed] [Google Scholar]
- Adzic Miroslav, Lukic Iva, Mitic Milos, Djordjevic Jelena, Ivana Elaković Ana Djordjevic, Marija Krstic-Demonacos Gordana Matić, and Radojcic Marija. 2013. “Brain Region-and Sex-Specific Modulation of Mitochondrial Glucocorticoid Receptor Phosphorylation in Fluoxetine Treated Stressed Rats: Effects on Energy Metabolism.” Psychoneuroendocrinology 38 (12): 2914–24. 10.1016/j.psyneuen.2013.07.019. [DOI] [PubMed] [Google Scholar]
- Adzic Miroslav, Mitic Milos, and Radojcic Marija. 2017. “Mitochondrial Estrogen Receptors as a Vulnerability Factor of Chronic Stress and Mediator of Fluoxetine Treatment in Female and Male Rat Hippocampus.” Brain Research 1671 (September): 77–84. 10.1016/j.brainres.2017.07.007. [DOI] [PubMed] [Google Scholar]
- Altar C.Anthony Jurata Linda W., Charles Vin, Lemire Andrew, Liu Peng, Bukhman Yury, Young Theresa A., et al. 2005. “Deficient Hippocampal Neuron Expression of Proteasome, Ubiquitin, and Mitochondrial Genes in Multiple Schizophrenia Cohorts.” Biological Psychiatry 58 (2): 85–96. 10.1016/j.biopsych.2005.03.031. [DOI] [PubMed] [Google Scholar]
- Anglin RE, SL Garside Tarnopolsky MA, Mazurek MF, and Rosebush PI. 2012. “The Psychiatric Manifestations of Mitochondrial Disorders: A Case and Review of the Literature.” Journal of Clinical Psychiatry 73 (4): 506–12. [DOI] [PubMed] [Google Scholar]
- Arifler Dizem, Zhu Tingting, Madaan Sara, and Tachtsidis Ilias. 2015. “Optimal Wavelength Combinations for Near-Infrared Spectroscopic Monitoring of Changes in Brain Tissue Hemoglobin and Cytochrome c Oxidase Concentrations.” Biomedical Optics Express 6 (3): 933–47. [DOI] [PMC free article] [PubMed] [Google Scholar]
- Arnold Susanne. 2012. “Cytochrome c Oxidase and Its Role in Neurodegeneration and Neuroprotection” In Mitochondrial Oxidative Phosphorylation: Nuclear-Encoded Genes, Enzyme Regulation, and Pathophysiology, edited by Kadenbach Bernhard, 305–39. New York, NY: Springer New York; 10.1007/978-1-4614-3573-0_13. [DOI] [Google Scholar]
- Bachmann, Rosilla F, Wang Yun, Yuan Peixiong, Zhou Rulun, Li Xiaoxia, Alesci Salvatore, Du Jing, and Manji Husseini K. 2009. “Common Effects of Lithium and Valproate on Mitochondrial Functions: Protection against Methamphetamine-Induced Mitochondrial Damage.” The International Journal of Neuropsychopharmacology / Official Scientific Journal of the Collegium Internationale Neuropsychopharmacologicum (CINP) 12 (6): 805–22. 10.1017/S1461145708009802. [DOI] [PMC free article] [PubMed] [Google Scholar]
- Bainbridge A, Tachtsidis I, Faulkner SD, Price D, Zhu T, Baer E, Broad KD, et al. 2014. “Brain Mitochondrial Oxidative Metabolism during and after Cerebral Hypoxia–Ischemia Studied by Simultaneous Phosphorus Magnetic-Resonance and Broadband near-Infrared Spectroscopy.” Multimodal Data Fusion 102, Part 1 (November): 173–83. [DOI] [PMC free article] [PubMed] [Google Scholar]
- Bakunina Nataliia, Pariante Carmine M, and Zunszain Patricia A. 2015. “Immune Mechanisms Linked to Depression via Oxidative Stress and Neuroprogression.” Immunology 144 (3): 365–73. 10.1111/imm.12443. [DOI] [PMC free article] [PubMed] [Google Scholar]
- Bale Gemma, Elwell CE, and Tachtsidis Ilias. 2016. “From Jöbsis to the Present Day: A Review of Clinical Near-Infrared Spectroscopy Measurements of Cerebral Cytochrome-C-Oxidase.” Journal of Biomedical Optics 21 (9): 91307. [DOI] [PubMed] [Google Scholar]
- Bale Gemma, Mitra Subhabrata, Meek Judith, Robertson Nicola, and Tachtsidis Ilias. 2014. “A New Broadband Near-Infrared Spectroscopy System for in-Vivo Measurements of Cerebral Cytochrome-c-Oxidase Changes in Neonatal Brain Injury.” Biomedical Optics Express 5 (10): 3450–66. [DOI] [PMC free article] [PubMed] [Google Scholar]
- Banaji M, Mallet A Elwell CE, Nicholls P, and Cooper CE. 2008. “A Model of Brain Circulation and Metabolism: NIRS Signal Changes during Physiological Challenges.” PlOS Computaional Biology 4 (11): e1000212. [DOI] [PMC free article] [PubMed] [Google Scholar]
- Bansal Y, and Kuhad A. 2016. “Mitochondrial Dysfunction in Depression.” Current Neuropharmacology 14 (6): 610–18. [DOI] [PMC free article] [PubMed] [Google Scholar]
- Barney L 2017. “Supercomputers Aid in Breakthrough Cytochrome C Oxidase Research.” 2017 https://www.scientificcomputing.com/article/2017/08/supercomputers-aid-breakthrough-cytochrome-c-oxidase-research.
- Beech, Robert D, Lowthert Lori, Leffert Janine J, Mason Portia N, Taylor Mary M, Umlauf Sheila, Lin Aiping, et al. 2010. “Increased Peripheral Blood Expression of Electron Transport Chain Genes in Bipolar Depression.” Bipolar Disorders 12 (8): 813–24. 10.1111/j.1399-5618.2010.00882.x. [DOI] [PMC free article] [PubMed] [Google Scholar]
- Belenky Peter, Bogan Katrina L., and Brenner Charles. 2007. “NAD+ Metabolism in Health and Disease.” Trends in Biochemical Sciences 32 (1): 12–19. 10.1016/j.tibs.2006.11.006. [DOI] [PubMed] [Google Scholar]
- Ben-Shachar Dorit, and Karry Rachel. 2008. “Neuroanatomical Pattern of Mitochondrial Complex I Pathology Varies between Schizophrenia, Bipolar Disorder and Major Depression.” Edited by Kenji Hashimoto. PLoS ONE 3 (11): e3676. [DOI] [PMC free article] [PubMed] [Google Scholar]
- Ben-Shachar Dorit, Zuk Rosa, Gazawi Haifa, Reshef Alon, Sheinkman Ala, and Klein Ehud. 1999. “Increased Mitochondrial Complex I Activity in Platelets of Schizophrenic Patients.” International Journal of Neuropsychopharmacology 2 (4): 245–53. 10.1017/S1461145799001649. [DOI] [PubMed] [Google Scholar]
- Brand Martin D., Chien Lee-Feng, Ainscow Edward K., Rolfe David F.S., and Porter Richard K.. 1994. “The Causes and Functions of Mitochondrial Proton Leak.” Biochimica et Biophysica Acta (BBA) - Bioenergetics 1187 (2): 132–39. 10.1016/0005-2728(94)90099-X. [DOI] [PubMed] [Google Scholar]
- Caldwell Matthew, Hapuarachchi Tharindi, Highton David, Elwell Clare, Smith Martin, and Tachtsidis Ilias. 2015. “BrainSignals Revisited: Simplifying a Computational Model of Cerebral Physiology.” Edited by Gennady Cymbalyuk. PLoS ONE 10 (5): e0126695. 10.1371/journal.pone.0126695. [DOI] [PMC free article] [PubMed] [Google Scholar]
- Caldwell Matthew, Moroz Tracy, Hapuarachchi Tharindi, Bainbridge Alan, Robertson Nicola J., Cooper Chris E., and Tachtsidis Ilias. 2015. “Modelling Blood Flow and Metabolism in the Preclinical Neonatal Brain during and Following Hypoxic-Ischaemia.” PLOS ONE 10 (10): e0140171. 10.1371/journal.pone.0140171. [DOI] [PMC free article] [PubMed] [Google Scholar]
- Cancelier Kizzy, Gomes Lara M., Milena Carvalho-Silva Letícia J. Teixeira, Rebelo Joyce, Mota Isabella T., Arent Camila O., et al. 2017. “Omega-3 Fatty Acids and Mood Stabilizers Alter Behavioural and Energy Metabolism Parameters in Animals Subjected to an Animal Model of Mania Induced by Fenproporex.” Molecular Neurobiology 54 (6): 3935–47. 10.1007/s12035-016-9933-z. [DOI] [PubMed] [Google Scholar]
- Champely S 2018. “Package ‘Pwr.’” https://cran.r-project.org/web/packages/pwr/pwr.pdf.
- Clay Hayley B., Sillivan Stephanie, and Konradi Christine. 2011. “Mitochondrial Dysfunction and Pathology in Bipolar Disorder and Schizophrenia.” Schizophrenia 29 (3): 311–24. [DOI] [PMC free article] [PubMed] [Google Scholar]
- Cukier RI, Fortuin CM, Shuler KE, Petschek AG, and Schaibly JH. 1973. “Study of the Sensitivity of Coupled Reaction Systems to Uncertainties in Rate Coefficients. I Theory.” The Journal of Chemical Physics 59 (8): 3873–78. 10.1063/1.1680571. [DOI] [Google Scholar]
- Crescenzo De, Franco Mario Ciliberto, Menghini Deny, Treglia Giorgio, Ebmeier Klaus P., and Janiri Luigi. 2017. “Is 18F-FDG-PET Suitable to Predict Clinical Response to the Treatment of Geriatric Depression? A Systematic Review of PET Studies.” Aging & Mental Health 21 (9): 889–94. 10.1080/13607863.2016.1247413. [DOI] [PubMed] [Google Scholar]
- Delpy DT, M Cope P Zee, Arridge S, Wray S, and Wyatt J. 1988a. “Estimation of Optical Pathlength through Tissue from Direct Time of Flight Measurement.” Physics in Medicine and Biology 33 (12): 1433–42. [DOI] [PubMed] [Google Scholar]
- Delpy DT, M Cope P Zee, Arridge S, Wray S, and Wyatt J. 1988b. “Estimation of Optical Pathlength through Tissue from Direct Time of Flight Measurement.” Physics in Medicine and Biology 33 (12): 1433 – 1442. [DOI] [PubMed] [Google Scholar]
- Diaz Francisca, Fukui Hirokazu, Garcia Sofia, and Moraes Carlos T. 2006. “Cytochrome c Oxidase Is Required for the Assembly/Stability of Respiratory Complex I in Mouse Fibroblasts.” Molecular and Cellular Biology 26 (13): 4872–81. 10.1128/MCB.01767-05. [DOI] [PMC free article] [PubMed] [Google Scholar]
- Du F, Cooper AJ, Thida T, and et al. 2014. “In Vivo Evidence for Cerebral Bioenergetic Abnormalities in Schizophrenia Measured Using 31p Magnetization Transfer Spectroscopy.” JAMA Psychiatry 71 (1): 19–27. 10.1001/jamapsychiatry.2013.2287. [DOI] [PMC free article] [PubMed] [Google Scholar]
- Ferrari Marco, Mottola Leonardo, and Quaresima Valentina. 2004. “Principles, Techniques, and Limitations of Near Infrared Spectroscopy.” Canadian Journal of Applied Physiology 29 (4): 463–87. 10.1139/h04-031. [DOI] [PubMed] [Google Scholar]
- Ferrari Marco, and Quaresima Valentina. 2012. “A Brief Review on the History of Human Functional Near-Infrared Spectroscopy (FNIRS) Development and Fields of Application.” NeuroImage 63 (2): 921–35. [DOI] [PubMed] [Google Scholar]
- First MB, R Spitzer,Gibbon M , and Williams JBW. 2002. Structured Clinical Interview for DSM-IV-TR Axis I Disorders. New York: Biometrics Research, New York State Psychiatric Institute. [Google Scholar]
- Fišar Z, and Hroudová J. 2010. “Common Aspects of Neuroplasticity, Mood Disorders and Mitochondrial Functions.” Act Nerv Super Rediviva 52 (1): 3–20. [Google Scholar]
- Freo Ulderico, Ori Carlo, Dam Mauro, Merico Antonio, and Pizzolato Gilberto. 2000. “Effects of Acute and Chronic Treatment with Fluoxetine on Regional Glucose Cerebral Metabolism in Rats: Implications for Clinical Therapies.” Brain Research 854 (1): 35–41. 10.1016/S0006-8993(99)02261-1. [DOI] [PubMed] [Google Scholar]
- Gardner Ann, Johansson Anna, Wibom Rolf, Nennesmo Inger, Ulrika von Döbeln Lars Hagenfeldt, and Hällström Tore. 2003. “Alterations of Mitochondrial Function and Correlations with Personality Traits in Selected Major Depressive Disorder Patients.” Journal of Affective Disorders 76 (1): 55–68. [DOI] [PubMed] [Google Scholar]
- Gardner Ann, Salmaso Dario, Nardo Davide, Micucci Federica, Nobili Flavio, Alejandro Sanchez-Crespo Hans Jacobsson, Larsson Stig A., and Pagani Marco. 2008. “Mitochondrial Function Is Related to Alterations at Brain SPECT in Depressed Patients.” CNS Spectrums 13 (9): 805–14. 10.1017/S1092852900013936. [DOI] [PubMed] [Google Scholar]
- Ghosh Arnab, Kolyva Christina, Tachtsidis Ilias, Highton David, Elwell Clare E, and Smith Martin. 2013. “Reduction of Cytochrome c Oxidase During Vasovagal Hypoxia-Ischemia in Human Adult Brain: A Case Study.” Advances in Experimental Medicine and Biology 789: 21–27. [DOI] [PMC free article] [PubMed] [Google Scholar]
- Glover Juliet, and Srinivasan Shilpa. 2013. “Assessment of the Person with Late-Life Depression.” Late Life Depression 36 (4): 545–60. 10.1016/j.psc.2013.08.004. [DOI] [PubMed] [Google Scholar]
- Gonçalves Cinara L., Rezin Gislaine T., Ferreira Gabriela K., Jeremias Isabela C., Cardoso Mariane R., Milena Carvalho-Silva Alexandra I. Zugno, Quevedo João, and Streck Emilio L.. 2012. “Differential Effects of Escitalopram Administration on Metabolic Parameters of Cortical and Subcortical Brain Regions of Wistar Rats.” Acta Neuropsychiatrica 24 (3): 147–54. 10.1111/j.1601-5215.2011.00592.x. [DOI] [PubMed] [Google Scholar]
- Hamilton M 1960. “A Rating Scale for Depression.” Journal of Neurology, Neurosurgery & Psychiatry 23 (1): 56–62. [DOI] [PMC free article] [PubMed] [Google Scholar]
- Highton David, Ghosh Arnab, Tachtsidis Ilias, Elwell Clare, and Smith Martin. 2014. “Analysis of Slow Wave Oscillations in Cerebral Haemodynamics and Metabolism Following Subarachnoid Haemorrhage.” Advances in Experimental Medicine and Biology 812: 195–201. [DOI] [PMC free article] [PubMed] [Google Scholar]
- Holper L, Ben-Shachar D, and Mann JJ. 2018. “Multivariate Meta-Analyses of Mitochondrial Complex I and IV in Major Depressive Disorder, Bipolar Disorder, Schizophrenia, Alzheimer Disease, and Parkinson Disease.” Neuropsychopharmacology, May 10.1038/s41386-018-0090-0. [DOI] [PMC free article] [PubMed] [Google Scholar]
- Holper L, Scholkmann F, and Seifritz E. 2015. “Time-Frequency Dynamics of the Sum of Intra-and Extracerebral Hemodynamic Functional Connectivity during Resting-State and Respiratory Challenges Assessed by Multimodal Functional near-Infrared Spectroscopy.” NeuroImage 120: 481–92. [DOI] [PubMed] [Google Scholar]
- Holper Lisa, and Mann J. John. 2018. “Test–Retest Reliability of Brain Mitochondrial Cytochrome-c-Oxidase Assessed by Functional near-Infrared Spectroscopy.” Journal of Biomedical Optics 23 (5): 1–9. [DOI] [PubMed] [Google Scholar]
- Houtkooper, Riekelt H, Cantó Carles, Wanders Ronald J., and Auwerx Johan. 2010. “The Secret Life of NAD+: An Old Metabolite Controlling New Metabolic Signaling Pathways.” Endocrine Reviews 31 (2): 194–223. 10.1210/er.2009-0026. [DOI] [PMC free article] [PubMed] [Google Scholar]
- Hroudová J, and Fisar Z. 2010. “Activities of Respiratory Chain Complexes and Citrate Synthase Influenced by Pharmacologically Different Antidepressants and Mood Stabilizers.” Neuroendocrinology Letters 31 (3): 336–42. [PubMed] [Google Scholar]
- Hroudová J, and Fišar Z. 2011. “Connectivity between Mitochondrial Functions and Psychiatric Disorders.” Psychiatry Clin Neurosci 65 (2): 130–41. [DOI] [PubMed] [Google Scholar]
- Huppert TJ, Diamond SG Franceschini MA, and Boas DA. 2009. “HomER: A Review of Time-Series Analysis Methods for near-Infrared Spectroscopy of the Brain.” Applied Optics 48 (10): D280–98. [DOI] [PMC free article] [PubMed] [Google Scholar]
- Iwamoto Kazuya, Bundo Miki, and Kato Tadafumi. 2005. “Altered Expression of Mitochondria-Related Genes in Postmortem Brains of Patients with Bipolar Disorder or Schizophrenia, as Revealed by Large-Scale DNA Microarray Analysis.” Human Molecular Genetics 14 (2): 241–53. 10.1093/hmg/ddi022. [DOI] [PubMed] [Google Scholar]
- Karabatsiakis A, Bock C Salinas-Manrique J, Kolassa S, Calzia E, Dietrich DE, and Kolassa I-T. 2014. “Mitochondrial Respiration in Peripheral Blood Mononuclear Cells Correlates with Depressive Subsymptoms and Severity of Major Depression.” Transl Psychiatry 4: e397. [DOI] [PMC free article] [PubMed] [Google Scholar]
- Kato Tadafumi. 2017. “Neurobiological Basis of Bipolar Disorder: Mitochondrial Dysfunction Hypothesis and Beyond.” Schizophrenia Research 187: 62–66. [DOI] [PubMed] [Google Scholar]
- Kim Helena Kyunghee, Cristina Andreazza Ana , Elmi Nika, Chen Wenjun, and Young L. Trevor. 2016. “Nod-like Receptor Pyrin Containing 3 (NLRP3) in the Post-Mortem Frontal Cortex from Patients with Bipolar Disorder: A Potential Mediator between Mitochondria and Immune-Activation.” Journal of Psychiatric Research 72 (January): 43–50. 10.1016/j.jpsychires.2015.10.015. [DOI] [PubMed] [Google Scholar]
- Kim Sang-Young, Cohen Bruce M., Chen Xi, Lukas Scott E., Shinn Ann K., Yuksel A. Cagri, Li Tao, Du Fei, and Öngür Dost. 2017. “Redox Dysregulation in Schizophrenia Revealed by in Vivo NAD+/NADH Measurement.” Schizophrenia Bulletin 43 (1): 197–204. 10.1093/schbul/sbw129. [DOI] [PMC free article] [PubMed] [Google Scholar]
- Kolyva Christina, Ghosh Arnab, Tachtsidis Ilias, Highton David, Chris E Cooper Martin Smith, and Elwell Clare E. 2014. “Cytochrome c Oxidase Response to Changes in Cerebral Oxygen Delivery in the Adult Brain Shows Higher Brain-Specificity than Haemoglobin.” Neuroimage 85 (Pt 1): 234–44. [DOI] [PMC free article] [PubMed] [Google Scholar]
- Kolyva Christina, Ghosh Arnab, Tachtsidis Ilias, Highton David, Smith Martin, and Elwell Clare E. 2013. “Dependence on NIRS Source-Detector Spacing of Cytochrome c Oxidase Response to Hypoxia and Hypercapnia in the Adult Brain.” Advances in Experimental Medicine and Biology 789: 353–59. [DOI] [PMC free article] [PubMed] [Google Scholar]
- Konradi C, Eaton M, MacDonald ML, Walsh J, Benes FM, and Heckers S. 2004. “Molecular Evidence for Mitochondrial Dysfunction in Bipolar Disorder.” Archives of General Psychiatry 61 (3): 300–308. 10.1001/archpsyc.61.3.300. [DOI] [PubMed] [Google Scholar]
- Korzeniewski Bernard, and Zoladz Jerzy A.. 2001. “A Model of Oxidative Phosphorylation in Mammalian Skeletal Muscle.” Biophysical Chemistry 92 (1): 17–34. 10.1016/S0301-4622(01)00184-3. [DOI] [PubMed] [Google Scholar]
- Li Youfen, Marilena D’Aurelio Jian-Hong Deng, Park Jeong-Soon, Manfredi Giovanni, Hu Peiqing, Lu Jianxin, and Bai Yidong. 2007. “An Assembled Complex IV Maintains the Stability and Activity of Complex I in Mammalian Mitochondria.” Journal of Biological Chemistry 282 (24): 17557–62. 10.1074/jbc.M701056200. [DOI] [PubMed] [Google Scholar]
- Li Youfen, Park Jeong-Soon, Deng Jian-Hong, and Bai Yidong. 2006. “Cytochrome c Oxidase Subunit IV Is Essential for Assembly and Respiratory Function of the Enzyme Complex.” Journal of Bioenergetics and Biomembranes 38 (5–6): 283–91. 10.1007/s10863-006-9052-z. [DOI] [PMC free article] [PubMed] [Google Scholar]
- Lin Su-Ju, and Guarente Leonard. 2003. “Nicotinamide Adenine Dinucleotide, a Metabolic Regulator of Transcription, Longevity and Disease.” Current Opinion in Cell Biology 15 (2): 241–46. 10.1016/S0955-0674(03)00006-1. [DOI] [PubMed] [Google Scholar]
- Lu Ming, Zhu Xiao-Hong, Zhang Yi, and Chen Wei. 2014. “Intracellular Redox State Revealed by in Vivo 31P MRS Measurement of NAD+ and NADH Contents in Brains.” Magnetic Resonance in Medicine 71 (6): 1959–72. 10.1002/mrm.24859. [DOI] [PMC free article] [PubMed] [Google Scholar]
- Matcher SJ, Kirkpatrick PJ Nahid K, Cope M, and Delpy DT. 1995. “Absolute Quantification Methods in Tissue Near-Infrared Spectroscopy.” Proc SPIE 2389: 486–495. [Google Scholar]
- McCann Ruth F., and Ross David A.. 2018. “So Happy Together: The Storied Marriage Between Mitochondria and the Mind.” Biological Psychiatry 83 (9): e47–49. 10.1016/j.biopsych.2018.03.006. [DOI] [PMC free article] [PubMed] [Google Scholar]
- Moretti A, Gorini A, and Villa RF. 2003. “Affective Disorders, Antidepressant Drugs and Brain Metabolism.” Mol Psychiatry 8 (9): 773–85. [DOI] [PubMed] [Google Scholar]
- Murphy, Michael P. 2009. “How Mitochondria Produce Reactive Oxygen Species.” Biochemical Journal 417 (1): 1 10.1042/BJ20081386. [DOI] [PMC free article] [PubMed] [Google Scholar]
- Naydenov AV, MacDonald ML, Ongur D, and Konradi C. 2007. “Differences in Lymphocyte Electron Transport Gene Expression Levels between Subjects with Bipolar Disorder and Normal Controls in Response to Glucose Deprivation Stress.” Archives of General Psychiatry 64 (5): 555–64. 10.1001/archpsyc.64.5.555. [DOI] [PubMed] [Google Scholar]
- Nemeroff CB. 2007. “Prevalence and Management of Treatment-Resistant Depression.” Journal of Clinical Psychiatry 68 (suppl 8): 17–25. [PubMed] [Google Scholar]
- Nicholls David G. 1977. “The Effective Proton Conductance of the Inner Membrane of Mitochondria from Brown Adipose Tissue.” European Journal of Biochemistry 77 (2): 349–56. 10.1111/j.1432-1033.1977.tb11674.x. [DOI] [PubMed] [Google Scholar]
- NIH. 2018. “Mood Disorder.” 2018. https://www.nimh.nih.gov/health/statistics/any-mood-disorder.shtml.
- Obrig Hellmuth, and Villringer Arno. 2003. “Beyond the Visible - Imaging the Human Brain With Light.” Journal of Cerebral Blood Flow and Metabolism 23 (1): 1–18. [DOI] [PubMed] [Google Scholar]
- Padilla Eimeira, Shumake Jason, Barrett Douglas W, Sheridan Eva C, and Gonzalez-Lima F. 2011. “Mesolimbic Effects of the Antidepressant Fluoxetine in Holtzman Rats, a Genetic Strain with Increased Vulnerability to Stress.” Brain Research 1387 (April): 71–84. 10.1016/j.brainres.2011.02.080. [DOI] [PMC free article] [PubMed] [Google Scholar]
- Patterson Michael S., Chance B, and Wilson BC. 1989. “Time Resolved Reflectance and Transmittance for the Noninvasive Measurement of Tissue Optical Properties.” Applied Optics 28 (12): 2331–36. 10.1364/AO.28.002331. [DOI] [PubMed] [Google Scholar]
- Pei Liming, and Wallace Douglas C.. 2018. “Mitochondrial Etiology of Neuropsychiatric Disorders.” Biological Psychiatry 83 (9): 722–30. 10.1016/j.biopsych.2017.11.018. [DOI] [PMC free article] [PubMed] [Google Scholar]
- Picard Martin, Wallace Douglas C., and Burelle Yan. 2016. “The Rise of Mitochondria in Medicine.” Mitochondrion 30 (September): 105–16. 10.1016/j.mito.2016.07.003. [DOI] [PMC free article] [PubMed] [Google Scholar]
- Quiroz Jorge A, Gray Neil A, Kato Tadafumi, and Manji Husseini K. 2008. “Mitochondrially Mediated Plasticity in the Pathophysiology and Treatment of Bipolar Disorder.” Neuropsychopharmacology 33 (January): 2551. [DOI] [PubMed] [Google Scholar]
- R Development Core Team. 2008. “R: A Language and Environment for Statistical Computing. R Foundation for Statistical Computing, Vienna, Austria.” [Google Scholar]
- Rich PR 2003. “The Molecular Machinery of Keilin’s Respiratory Chain.” Biochemical Society Transactions 31 (6): 1095 10.1042/bst0311095. [DOI] [PubMed] [Google Scholar]
- Roever I de , Bale Gemma, Cooper RJ, and Tachtsidis Ilias. 2016. “Cytochrome-c-Oxidase Exhibits Higher Brain-Specificity than Haemoglobin in Functional Activation.” In OSA, The Optical Scociety. [Google Scholar]
- Rolfe David F. S., and Brand Martin D.. 1997. “The Physiological Significance of Mitochondrial Proton Leak in Animal Cells and Tissues.” Bioscience Reports 17 (1): 9 10.1023/A:1027327015957. [DOI] [PubMed] [Google Scholar]
- Sanchez-Bahillo A, Bautista-Hernandez V, Gonzalez Carlos Barcia, Bañon R, Luna A, Hirsch EC, and Herrero Maria-Trinidad. 2008. “Increased MRNA Expression of Cytochrome Oxidase in Dorsal Raphe Nucleus of Depressive Suicide Victims.” Neuropsychiatric Disease and Treatment 4 (2): 413–16. [DOI] [PMC free article] [PubMed] [Google Scholar]
- Schäfer Eva, Dencher Norbert A., Vonck Janet, and Parcej David N.. 2007. “Three-Dimensional Structure of the Respiratory Chain Supercomplex I1III2IV1 from Bovine Heart Mitochondria,.” Biochemistry 46 (44): 12579–85. 10.1021/bi700983h. [DOI] [PubMed] [Google Scholar]
- Schaibly John H., and Shuler Kurt E.. 1973. “Study of the Sensitivity of Coupled Reaction Systems to Uncertainties in Rate Coefficients. II Applications.” The Journal of Chemical Physics 59 (8): 3879–88. 10.1063/1.1680572. [DOI] [Google Scholar]
- Schöll Michael, Damián Andrés, and Engler Henry. 2014. “Fluorodeoxyglucose PET in Neurology and Psychiatry.” PET Clinics 9 (4): 371–90. 10.1016/j.cpet.2014.07.005. [DOI] [PubMed] [Google Scholar]
- Shetty Shruthi, Hariharan Ashwini, Shirole Trupti, and Jagtap Aarti G. 2015. “Neuroprotective Potential of Escitalopram against Behavioral, Mitochondrial and Oxidative Dysfunction Induced by 3-Nitropropionic Acid.” Annals of Neurosciences 22 (1): 11–18. 10.5214/ans.0972.7531.220104. [DOI] [PMC free article] [PubMed] [Google Scholar]
- Shumake Jason, Colorado Rene A, Barrett Douglas W, and Gonzalez-Lima F. 2010. “Metabolic Mapping of the Effects of the Antidepressant Fluoxetine on the Brains of Congenitally Helpless Rats.” Brain Research 1343 (July): 218–25. 10.1016/j.brainres.2010.05.015. [DOI] [PMC free article] [PubMed] [Google Scholar]
- Sousa, de Rafael T., Streck Emilio L., Zanetti Marcus V., Ferreira Gabriela K., Diniz Breno S., Brunoni Andre R., Busatto Geraldo F., Gattaz Wagner F., and Machado-Vieira Rodrigo. 2015. “Lithium Increases Leukocyte Mitochondrial Complex I Activity in Bipolar Disorder during Depressive Episodes.” Psychopharmacology 232 (1): 245–50. 10.1007/s00213-014-3655-6. [DOI] [PubMed] [Google Scholar]
- Srinivasan Satish, and Avadhani Narayan G. 2012. “Cytochrome c Oxidase Dysfunction in Oxidative Stress.” Free Radical Biology & Medicine 53 (6): 1252–63. 10.1016/j.freeradbiomed.2012.07.021. [DOI] [PMC free article] [PubMed] [Google Scholar]
- Storey KB. 2004. Functional Metabolism: Regulation and Adaptation. Wiley-Liss. [Google Scholar]
- Stork C, and Renshaw PF. 2005. “Mitochondrial Dysfunction in Bipolar Disorder: Evidence from Magnetic Resonance Spectroscopy Research.” Mol Psychiatry 10 (10): 900–919. [DOI] [PubMed] [Google Scholar]
- Strawbridge R, Young AH, and Cleare AJ. 2017. “Biomarkers for Depression: Recent Insights, Current Challenges and Future Prospects.” Neuropsychiatric Disease and Treatment 13: 1245–62. [DOI] [PMC free article] [PubMed] [Google Scholar]
- Streck EL, CL Goncalves CB Furlanetto, Scaini G, Dal-Pizzol F, and Quevedo João. 2014. “Mitochondria and the Central Nervous System: Searching for a Pathophysiological Basis of Psychiatric Disorders.” Revista Brasileira de Psiquiatria 36 (2). [DOI] [PubMed] [Google Scholar]
- Streck Emilio L., Scaini Giselli, Jeremias Gabriela C., Rezin Gislaine T., Gonçalves Cinara L., Ferreira Gabriela K., Réus Gislaine Z., et al. 2015. “Effects of Mood Stabilizers on Brain Energy Metabolism in Mice Submitted to an Animal Model of Mania Induced by Paradoxical Sleep Deprivation.” Neurochemical Research 40 (6): 1144–52. 10.1007/s11064-015-1575-4. [DOI] [PubMed] [Google Scholar]
- Su Liang, Cai Yiyun, Xu Yifeng, Dutt Anirban, Shi Shenxun, and Bramon Elvira. 2014. “Cerebral Metabolism in Major Depressive Disorder: A Voxel-Based Meta-Analysis of Positron Emission Tomography Studies.” BMC Psychiatry 14: 321 10.1186/s12888-014-0321-9. [DOI] [PMC free article] [PubMed] [Google Scholar]
- Sun Nuo, Youle Richard J, and Finkel Toren. 2016. “The Mitochondrial Basis of Aging.” Molecular Cell 61 (5): 654–66. 10.1016/j.molcel.2016.01.028. [DOI] [PMC free article] [PubMed] [Google Scholar]
- Sun Xiujun, Wang Jun-Feng, Tseng Michael, and Young L Trevor. 2006. “Downregulation in Components of the Mitochondrial Electron Transport Chain in the Postmortem Frontal Cortex of Subjects with Bipolar Disorder.” Journal of Psychiatry and Neuroscience 31 (3): 189–96. [PMC free article] [PubMed] [Google Scholar]
- Suzuki Susumu, Takasaki Sumio, Ozaki Takeo, and Kobayashi Yukio. 1999. “Tissue Oxygenation Monitor Using NIR Spatially Resolved Spectroscopy.” In , 3597:3597–11. 10.1117/12.356862. [DOI] [Google Scholar]
- Tachtsidis I, M Tisdall TS Leung, Cooper CE, Delpy DT, Smith M, and Elwell CE. 2007. “Investigation of in Vivo Measurement of Cerebral Cytochrome- c -Oxidase Redox Changes Using near-Infrared Spectroscopy in Patients with Orthostatic Hypotension.” Physiological Measurement 28 (2): 199. [DOI] [PubMed] [Google Scholar]
- Tachtsidis Ilias, Cooper Chris E., McGown Anne D., Makker Himender, Delpy David T., and Elwell Clare E.. 2004. “Changes in Cerebral Total Haemoglobin Volume and Cytochrome Oxidase Redox State during Deep Apnoeas in Patients with Obstructive Sleep Apnoea.” In Biomedical Topical Meeting, WF6. OSA Technical Digest. Optical Society of America. 10.1364/BIO.2004.WF6. [DOI] [Google Scholar]
- Tachtsidis Ilias, Tisdall Martin, Delpy David T., Smith Martin, and Elwell Clare E.. 2008. “Measurement of Cerebral Tissue Oxygenation in Young Healthy Volunteers During Acetazolamide Provocation: A Transcranial Doppler and Near-Infrared Spectroscopy Investigation” In Oxygen Transport to Tissue XXIX, edited by Kang Kyung A., Harrison David K., and Bruley Duane F., 389–96. Boston, MA: Springer US; 10.1007/978-0-387-74911-2_43. [DOI] [PubMed] [Google Scholar]
- Tachtsidis Ilias, Tisdall Martin M., Leung Terence S., Pritchard Caroline, Cooper Christopher E., Smith Martin, and Elwell Clare E.. 2009. “Relationship Between Brain Tissue Haemodynamics, Oxygenation And Metabolism In The Healthy Human Adult Brain During Hyperoxia And Hypercapnea” In Oxygen Transport to Tissue XXX, 645:315–20. Advances in Experimental Medicine and Biology. Springer US. [DOI] [PubMed] [Google Scholar]
- Wallace Douglas C. 2005. “A Mitochondrial Paradigm of Metabolic and Degenerative Diseases, Aging, and Cancer: A Dawn for Evolutionary Medicine.” Annual Review of Genetics 39 (1): 359–407. 10.1146/annurev.genet.39.110304.095751. [DOI] [PMC free article] [PubMed] [Google Scholar]
- Washizuka Shinsuke, Kakiuchi Chihiro, Mori Kanako, Tajima Osamu, Akiyama Tsuyoshi, and Kato Tadafumi. 2005. “Expression of Mitochondria-Related Genes in Lymphoblastoid Cells from Patients with Bipolar Disorder.” Bipolar Disorders 7 (2): 146–52. 10.1111/j.1399-5618.2005.00184.x. [DOI] [PubMed] [Google Scholar]
- Wikström Mårten, Sharma Vivek, Kaila Ville R. I., Hosler Jonathan P., and Hummer Gerhard. 2015. “New Perspectives on Proton Pumping in Cellular Respiration.” Chemical Reviews 115 (5): 2196–2221. 10.1021/cr500448t. [DOI] [PubMed] [Google Scholar]
- Wikstrom MKF. 1977. “Proton Pump Coupled to Cytochrome c Oxidase in Mitochondria.” Nature 266 (March): 271. [DOI] [PubMed] [Google Scholar]
- Wiles N, Thomas L, and Abel A. 2014. “The Prevalence of Treatment-Resistant Depression in Primary Care.” In Clinical Effectiveness and Cost-Effectiveness of Cognitive Behavioural Therapy as an Adjunct to Pharmacotherapy for Treatment-Resistant Depression in Primary Care: The CoBalT Randomised Controlled Trial, 18.31. Health Technology Assessment. [DOI] [PMC free article] [PubMed] [Google Scholar]
- Wolf M, Ferrari M, and Quaresima V. 2007. “Progress of Near-Infrared Spectroscopy and Topography for Brain and Muscle Clinical Applications.” Journal of Biomedical Optics 12 (6): 062104. [DOI] [PubMed] [Google Scholar]
- Young RC, Biggs JT, Ziegler VE , and Meyer DA. 1978. “A Rating Scale for Mania: Reliability, Validity and Sensitivity.” British Journal of Psychiatry 133: 429–35. [DOI] [PubMed] [Google Scholar]