Abstract
Background
Preliminary studies have shown that MR fingerprinting–based relaxometry combined with apparent diffusion coefficient (ADC) mapping can be used to differentiate normal peripheral zone from prostate cancer and prostatitis. The utility of relaxometry and ADC mapping for the transition zone (TZ) is unknown.
Purpose
To evaluate the utility of MR fingerprinting combined with ADC mapping for characterizing TZ lesions.
Materials and Methods
TZ lesions that were suspicious for cancer in men who underwent MRI with T2-weighted imaging and ADC mapping (b values, 50–1400 sec/mm2), MR fingerprinting with steady-state free precession, and targeted biopsy (60 in-gantry and 15 cognitive targeting) between September 2014 and August 2018 in a single university hospital were retrospectively analyzed. Two radiologists blinded to Prostate Imaging Reporting and Data System (PI-RADS) scores and pathologic diagnosis drew regions of interest on cancer-suspicious lesions and contralateral visually normal TZs (NTZs) on MR fingerprinting and ADC maps. Linear mixed models compared two-reader means of T1, T2, and ADC. Generalized estimating equations logistic regression analysis was used to evaluate both MR fingerprinting and ADC in differentiating NTZ, cancers and noncancers, clinically significant (Gleason score ≥ 7) cancers from clinically insignificant lesions (noncancers and Gleason 6 cancers), and characterizing PI-RADS version 2 category 3 lesions.
Results
In 67 men (mean age, 66 years ± 8 [standard deviation]) with 75 lesions, targeted biopsy revealed 37 cancers (six PI-RADS category 3 cancers and 31 PI-RADS category 4 or 5 cancers) and 38 noncancers (31 PI-RADS category 3 lesions and seven PI-RADS category 4 or 5 lesions). The T1, T2, and ADC of NTZ (1800 msec ± 150, 65 msec ± 22, and [1.13 ± 0.19] × 10−3 mm2/sec, respectively) were higher than those in cancers (1450 msec ± 110, 36 msec ± 11, and [0.57 ± 0.13] × 10−3 mm2/sec, respectively; P < .001 for all). The T1, T2, and ADC in cancers were lower than those in noncancers (1620 msec ± 120, 47 msec ± 16, and [0.82 ± 0.13] × 10−3 mm2/sec, respectively; P = .001 for T1 and ADC and P = .03 for T2). The area under the receiver operating characteristic curve (AUC) for T1 plus ADC was 0.94 for separation. T1 and ADC in clinically significant cancers (1440 msec ± 140 and [0.58 ± 0.14] × 10−3 mm2/sec, respectively) were lower than those in clinically insignificant lesions (1580 msec ± 120 and [0.75 ± 0.17] × 10−3 mm2/sec, respectively; P = .001 for all). The AUC for T1 plus ADC was 0.81 for separation. Within PI-RADS category 3 lesions, T1 and ADC of cancers (1430 msec ± 220 and [0.60 ± 0.17] × 10−3 mm2/sec, respectively) were lower than those of noncancers (1630 msec ± 120 and [0.81 ± 0.13] × 10−3 mm2/sec, respectively; P = .006 for T1 and P = .004 for ADC). The AUC for T1 was 0.79 for differentiating category 3 lesions.
Conclusion
MR fingerprinting–based relaxometry combined with apparent diffusion coefficient mapping may improve transition zone lesion characterization.
© RSNA, 2019
Summary
In the transition zone, prostate cancer T1 and T2 relaxation times obtained from MR fingerprinting and apparent diffusion coefficients obtained from diffusion MRI are lower than those in noncancers and normal transition zone tissue.
Key Points
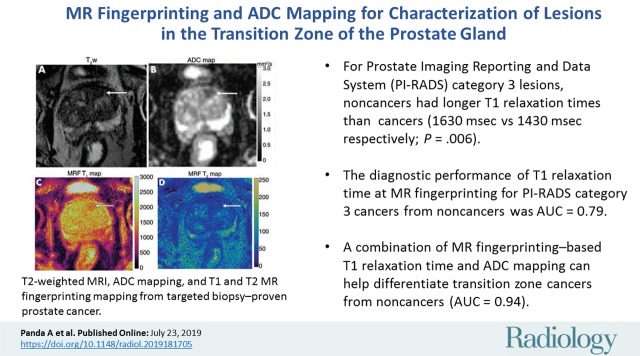
■ A combination of MR fingerprinting–based T1 relaxation time and apparent diffusion coefficient mapping can help differentiate transition zone cancers from noncancers (area under the receiver operating characteristic curve [AUC], 0.94).
■ For Prostate Imaging Reporting and Data System (PI-RADS) category 3 lesions, noncancers had longer T1 relaxation times than PI-RADS category 3 cancers (1630 msec ± 120 for noncancers vs 1430 msec ± 220 for cancers, P = .006).
■ T1 relaxation time from MR fingerprinting can distinguish PI-RADS category 3 cancers from noncancers (AUC, 0.79).
Introduction
The peripheral zone is the most common site of prostate cancer. However, 25%–40% of prostate cancers arise from the transition and central zones (1–3). Because of their anterior and apical involvement, transition zone cancers are often missed at digital rectal examination and transrectal US–guided systematic biopsy but are detected with MRI-guided targeted biopsies and template saturation biopsies (4–7).
At MRI, the transition zone has a heterogeneous appearance because of varying degrees of glandular and stromal hyperplasia and foci of prostatitis. The Prostate Imaging Reporting and Data System (PI-RADS) version 2 considers T2-weighted imaging as the most important sequence for detection and characterization of transition zone lesions, followed by diffusion-weighted (DW) imaging for upgrading certain category 3 lesions to category 4 (8). While some morphologic characteristics on T2-weighted images are predictors of malignancy (9–11), stromal hyperplastic nodules and prostatitis can also mimic cancer (9,11,12). This leads to poorer performance for characterization of transition zone cancer compared with peripheral zone cancer (13). Thus, it is desirable to develop additional objective criteria that may be useful in differentiating transition zone cancers from noncancerous tissue.
Studies have explored quantitative criteria for evaluation of transition zone lesions (14–16). Logistic regression models incorporating normalized T2-weighted signal intensity and apparent diffusion coefficient (ADC) have shown improved diagnostic performance compared with subjective interpretation alone (14,15). Normalized T2-weighted signal intensity has been used as a semiquantitative marker, but signal intensity does not carry physical meaning. However, measurement of tissue relaxation times is directly quantitative. T2 mapping may be useful in partially differentiating transition zone cancers from normal tissue and false-positive lesions (16). Owing to overlap in T2 values between transition zone cancers and normal tissue, a multiproperty quantitative approach combining relaxometry and ADC mapping is likely to have added value. To our knowledge, such a study has not yet been reported.
MR fingerprinting allows simultaneous measurement of T1 and T2 in a time-efficient manner (17,18). It has been used in various clinical applications including prostate imaging (19,20). Preliminary work shows that MR fingerprinting–based relaxometry in combination with ADC mapping could help differentiate normal peripheral zone from prostate cancer and prostatitis (19). However, the utility of relaxometry and ADC mapping for evaluation of transition zone lesions is unknown. The purpose of this study was to evaluate the utility of quantitative MR fingerprinting–based relaxometry combined with ADC mapping in the characterization of transition zone lesions, using targeted biopsy as the pathologic standard.
Materials and Methods
This retrospective study was approved by the institutional review board and was compliant with the Health Insurance Portability and Accountability Act. Written informed consent was obtained from all participants. Siemens Healthineers (Erlangen, Germany) provided research funding to the institution. The authors had control of the data and information submitted for publication. MR fingerprinting technology has been licensed by Siemens.
Patients
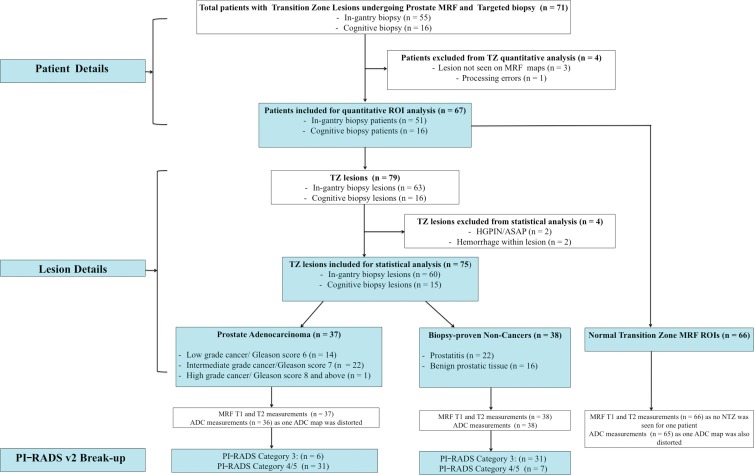
We retrospectively evaluated focal transition zone lesions in randomly selected patients who prospectively had MR fingerprinting appended to either their prebiopsy diagnostic MRI or in-gantry biopsy MRI protocols before they underwent targeted biopsy (cognitive or in-gantry targeted biopsy) between September 2014 and August 2018 in a single teaching hospital (University Hospitals Cleveland Medical Center). The indication for diagnostic MRI was suspicion of prostate cancer on the basis of elevated serum prostate-specific antigen level and/or abnormal digital rectal examination results. On the basis of MRI study readings, patients with suspicious lesions (PI-RADS version 2 category 3–5) underwent either cognitive targeting in addition to a systematic 12-core transrectal US–guided biopsy or in-gantry biopsy per urology department referral. Patients with a history of prostatectomy, pelvic radiation, chemotherapy, or hormonal therapy did not undergo MR fingerprinting and were thus not a part of our retrospective review. Of 71 eligible patients, four were excluded from analysis because of technical limitations (lesion not well identified on MR fingerprinting maps [n = 3] and failed MR fingerprinting reconstruction [n = 1]). In the remaining 67 patients with 79 lesions, 63 lesions in 51 patients were targeted with in-gantry biopsy, and 16 lesions in 16 patients were targeted with cognitive biopsy. Lesions with hemorrhage (n = 2) or a diagnosis of atypical small acinar proliferation (n = 1) or high-grade prostatic intraepithelial neoplasia (n = 1) were excluded. The final analysis included 75 lesions in 67 patients (Fig 1).
Figure 1:
Flowchart of patient and lesion characteristics. ADC = apparent diffusion coefficient, ASAP = atypical small acinar proliferation, HGPIN = high-grade intraepithelial neoplasia, MRF = MR fingerprinting, NTZ = normal TZ, PI-RADS = Prostate Imaging Reporting and Data System, ROI = region of interest, TZ = transition zone, v2 = version 2.
MRI Examinations
All diagnostic MRI studies, as well as in-gantry biopsies, were performed with a 3.0-T MRI unit (Verio/Skyra; Siemens Healthineers). The diagnostic protocol consisted of either an abbreviated noncontrast biparametric protocol with axial high-resolution T2-weighted images, DW imaging, or a full clinical protocol including dynamic contrast material–enhanced MRI. The sequence parameters are detailed in Table 1. The choice of performing the full versus the abbreviated protocol in individual patients was based on referring urologists’ and patients’ preferences. MR fingerprinting was added after DW imaging and before contrast material administration. Cognitive biopsies were performed by one of the two urologists (L.E.P. or I.J., with 4 and 2 years of cognitive biopsy experience and 250 and 100 biopsies, respectively). For cognitive targeting, all lesions were marked according to a prostate sector map (8) by a fellowship-trained body radiologist (V.G., with 18 years of radiology experience). All in-gantry biopsies were performed by fellowship-trained body interventional radiologists (V.G. and D.N. and I.E.P. [with 30 and 9 years of radiology experience, respectively]) using a commercially available biopsy device (DynaTRIM system, Gainesville, Fla). The protocol for in-gantry biopsy is shown in Table E1 (online). DW imaging and MR fingerprinting were added after biopsy-planning T2-weighted images and prior to the biopsy. After needle path confirmation, multiple cores were obtained (one to six cores per lesion; median, three cores), and the biopsy procedure was completed. For all patients imaged during the study period, the parameters for MR fingerprinting and the b values for ADC mapping were kept constant.
Table 1:
Sequence Parameters for Diagnostic MRI
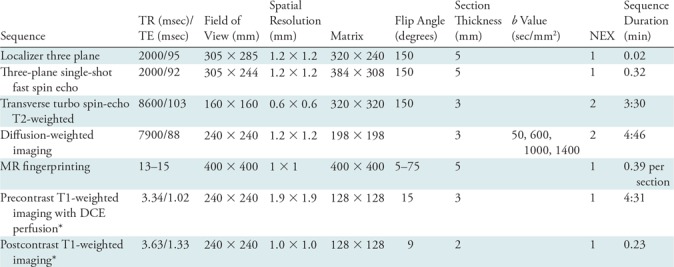
Note.—DCE = dynamic contrast enhanced, NEX = no. of averages, TE = echo time, TR = repetition time.
*DCE MRI was performed only if patients underwent the full prostate protocol. Only biparametric noncontrast MRI was performed in patients opting for the abbreviated protocol.
MR Fingerprinting Acquisition and Processing
The MR fingerprinting acquisition was as described previously (see Table 1 and Appendix E1 [online]) (18). For patients imaged between September 2014 and August 2017, the MR fingerprinting raw data were processed offline by using commercially available software (Matlab 2014a; MathWorks, Natick, Mass). For patients imaged from September 2017 onwards, rapid online reconstruction of MR fingerprinting data was enabled by using an open-source Gadgetron-based framework (NIH, Bethesda, Md) (21), and quantitative T1 and T2 maps were available on the MRI unit in Digital Imaging and Communications in Medicine (DICOM) format. Previous phantom and in vivo assessments have shown that MR fingerprinting numbers from both Matlab and Gadgetron reconstructions are identical and unaffected by the choice of reconstruction pipeline (22).
Clinical MRI Interpretation and Quantitative ROI Analysis
For all patients, cancer-suspicious transition zone lesions were identified and assigned an independent PI-RADS version 2 score as part of clinical readings by one radiologist (V.G.) before targeted biopsies were performed.
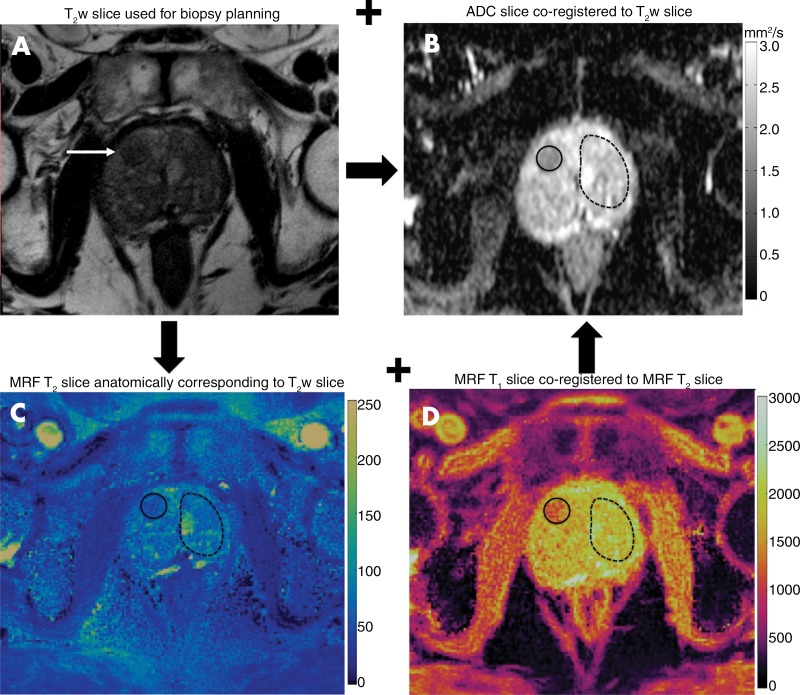
On the basis of clinical MRI readings, two fellowship-trained radiologists (reader 1: A.P., with 8 years of radiology experience; and reader 2: V.C.O., with 6 years of radiology experience) who were blinded to the previously assigned PI-RADS version 2 score and final pathologic diagnosis but who were aware of the lesion locations on diagnostic and in-gantry MRI images drew regions of interest (ROIs) in two independent sessions, 1–3 months apart. ROIs were drawn on T2 maps and ADC maps for suspicious transition zone lesions identified on T2-weighted images and in the contralateral visually normal transition zone (NTZ). As a part of acquisition, clinical T2-weighted and ADC sections were co-registered and MR fingerprinting T1 and T2 maps were co-registered. By using the axial T2-weighted section used for biopsy planning as a reference, corresponding T1 and T2 maps were identified by using anatomic and internal landmarks. Single-section ROIs were drawn on the MR fingerprinting map for the lesion and contralateral NTZ covering the entire visible NTZ. Again by using the T2-weighted section and T2 map as the references, lesion and NTZ ROIs were replicated at the corresponding locations on the ADC maps. The image analysis workflow is depicted in Figure 2. For each lesion and NTZ, mean T1, T2, and ADC were recorded. For markedly distorted ADC maps, no ROIs were drawn. Disagreements between readers were handled by consensus. The final pathologic diagnosis for each lesion obtained from targeted-core biopsy reports was considered to be the reference standard. Diagnosis was recorded as cancer, prostatitis, or negative biopsy/benign prostate tissue. For cancers, the highest reported Gleason score for each lesion was also recorded. If more than one pathologic diagnosis was reported from the same lesion, the pathologic diagnosis from the core most centered in the lesion based on correlation with biopsy images was documented. Histopathologic correlation was performed by V.G. For T1 and T2 maps reconstructed offline, the ROI annotations were performed in Matlab. For maps reconstructed online and available in the DICOM format, annotations were performed by using the open-source segmentation software ITK-SNAP (version 3.6 2015; available at www.itksnap.org) (23).
Figure 2:
Region of interest (ROI) analysis. Cancer-suspicious lesions (arrow) were identified on, A, axial T2-weighted (T2w) MRI section and, B, apparent diffusion coefficient (ADC) map. C, D, The anatomically corresponding MR fingerprinting (MRF) sections were aligned with the T2-weighted section, and lesion ROIs (solid circles) were drawn on the MR fingerprinting map. Because MR fingerprinting maps were co-registered, both T1 and T2 values were simultaneously obtained from a single MR fingerprinting ROI. Independent ROIs were drawn on the ADC map (in B) co-registered to the T2-weighted section. ROIs were also drawn on the visually normal transition zone (NTZ) (dashed circles) covering the whole contralateral NTZ.
Statistical Analysis
Targeted lesions were grouped as biopsy-proven prostate cancers and noncancers (prostatitis and negative biopsy results). Visually NTZ was a third independent group. Interreader reliability was examined for T1, T2, and ADC for prostate cancers, noncancers, and NTZ by using the intraclass correlation coefficient (ICC) method, treating readers as a random effect (ICC [2,1]) (24). Reliability was considered poor (ICC < 0.5), moderate (ICC, 0.5–0.75), good (ICC, 0.75–0.90), or excellent (ICC > 0.90) (25).
For groupwise comparisons, the means of the two-reader numbers were used for statistical analysis. The means of T1, T2, and ADC were compared between prostate cancers, noncancers, and NTZ by using linear mixed models. Generalized estimating equation logistic regression was used to assess the utility of MR fingerprinting–derived T1, T2, and ADC in the differentiation of prostate cancers from NTZ, prostate cancers from noncancers, and clinically significant prostate cancers (Gleason score ≥ 7) from clinically insignificant lesions (cancers with Gleason score = 6 and noncancers). The third distinction was made to assess if quantitative mapping could help differentiate between clinically significant lesions that need treatment from clinically insignificant lesions that do not need active intervention. Group comparisons were adjusted for 12 multiple tests (four comparisons times three measures) using adjusted P values based on the Holm-Bonferroni method (26). Adjusted P < .05 was considered to indicate a statistically significant difference. Receiver operating characteristic (ROC) curves and areas under the ROC curve (AUCs) were obtained from ordinary logistic regression of the binary outcome on the linear predictor obtained from the generalized estimating equation regressions. AUCs were estimated by using one-step leave-one-out cross validation (27), with confidence intervals calculated with the bootstrap percentile approach. Sensitivity and specificity are presented at the threshold cutpoint maximizing the Youden J index, defined as sensitivity plus specificity minus 1 (28), with estimates and confidence intervals calculated by using generalized estimating equation logistic regression. Cross-validated AUCs of different models were compared by using the bootstrap.
T1, T2, and ADC were also compared between PI-RADS version 2 category 3 noncancers and cancers by using similar methods with logistic regression/receiver operating characteristic analysis. Multivariable logistic or generalized estimating equation logistic analyses with two or three predictor variables were performed only if there were at least 20 and 30 patients, respectively, in each group. Statistical analyses were performed by using commercially available statistical software (SAS 9.4, SAS Institute, Cary, NC).
Results
Patient Characteristics and Lesion Characteristics
Patient characteristics, including age, prostate-specific antigen (PSA)/PSA density, and time between transrectal US and targeted biopsy and lesion characteristics are summarized in Table 2 and detailed in Appendix E1 (online).
Table 2:
Characteristics of 67 Patients and 75 Lesions Included in the Analysis
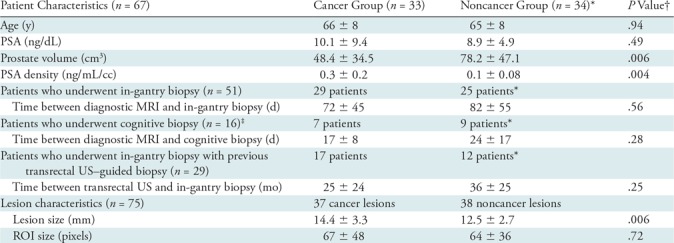
Note.—Data are means ± standard deviations. PSA = prostate-specific antigen, ROI = region of interest.
*Includes patients in whom all targeted lesions were noncancers.
†P < .05 was considered to indicate a significant difference.
‡All patients who underwent cognitive biopsy were biopsy naive.
Interreader Reliability
ICCs ranged from 0.70 to 0.87 for T1, from 0.87 to 0.92 for T2, and from 0.70 to 0.75 for ADC. Interreader reliability was moderate-to-good for T1, good-to-excellent for T2, and moderate for ADC for the different groups compared (Table 3). Reliability was better for NTZ and cancer MR fingerprinting and ADC measurements compared with noncancers.
Table 3:
Results of Two-Reader Reliability Analysis

Note.—Reliability was considered poor (intraclass correlation coefficient [ICC] < 0.5), moderate (ICC, 0.5–0.75), good (ICC, 0.75–0.90), or excellent (ICC > 0.90) (25). ADC = apparent diffusion coefficient.
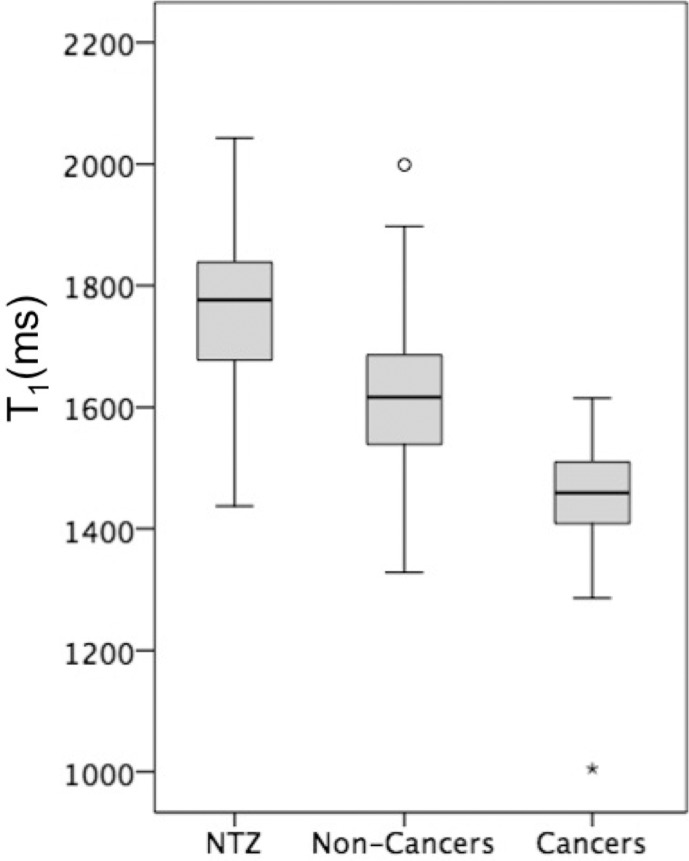
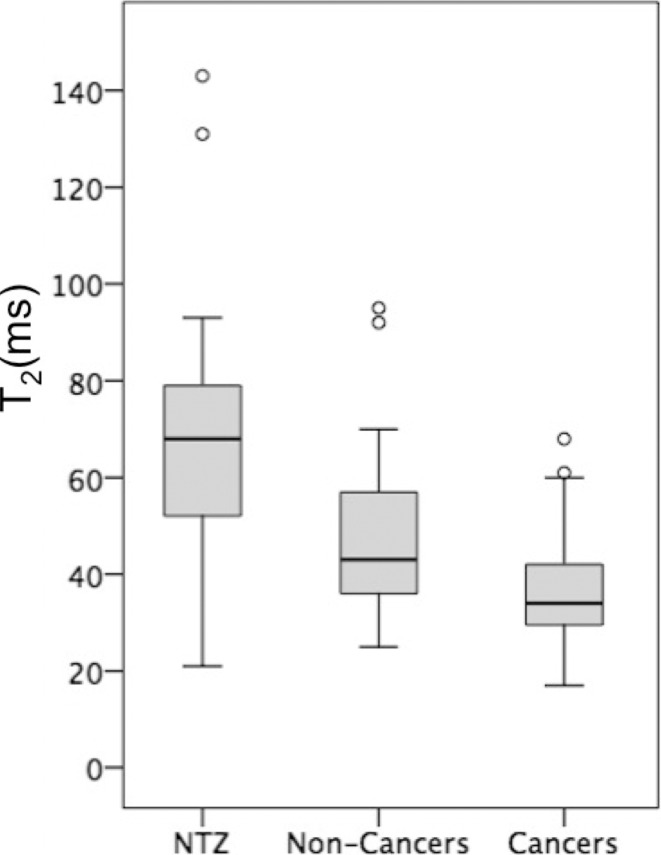
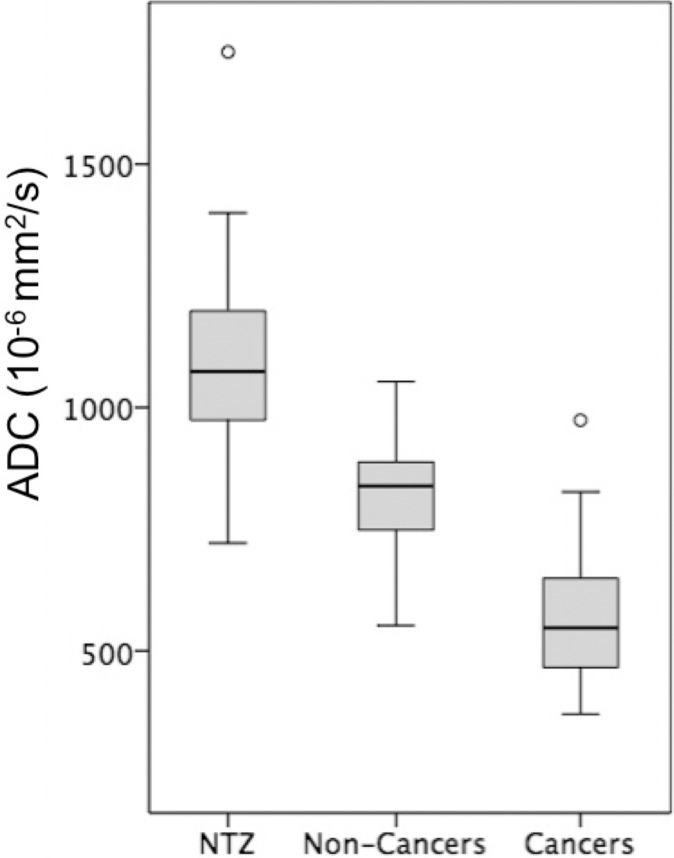
The means of T1, T2, and ADC measurements for NTZ, cancers and noncancers are summarized in Table E2 (online), and the distributions are depicted as box-and-whisker plots in Figure 3. Table 4 summarizes the AUCs for regression models, and the best diagnostic performance cutoff values are summarized in Table E3 (online). Independent AUCs for both readers are provided in Table E4 (online).
Figure 3a:
Box-and-whisker plots of (a) T1, (b) T2, and (c) apparent diffusion coefficient (ADC) measurements for normal transition zone (NTZ), noncancers, and cancers. Boxes = interquartile (IQ) range between the 25th and 75th percentiles, lines within boxes = medians, and whiskers = range of measurements. For plots with outliers (ie, b, c), the whiskers extend to measurements up to 1.5 times the IQ range, and the circles = outliers beyond 1.5 times the IQ range.
Table 4:
Differentiation of Various Groups with T1, T2, and ADC and Their Combinations

Note.—One thousand bootstrap resamples with replacement from the data and leave-one-out cross validation were performed. Numbers in parentheses are bootstrap 95% confidence intervals. ADC = apparent diffusion coefficient, AUC = area under the receiver operating characteristic curve, NTZ = normal transition zone, PI-RADS = Prostate Imaging Reporting and Data System. Clinically significant cancers were those with a Gleason score of 7 or greater; clinically insignificant lesions were low-grade/Gleason 6 cancers, prostatitis, and lesions with a diagnosis of benign prostatic tissue at biopsy.
*Multivariable regression models were not tested for PI-RADS version 2 category 3 lesions because of the small numbers of category 3 cancers.
Figure 3b:
Box-and-whisker plots of (a) T1, (b) T2, and (c) apparent diffusion coefficient (ADC) measurements for normal transition zone (NTZ), noncancers, and cancers. Boxes = interquartile (IQ) range between the 25th and 75th percentiles, lines within boxes = medians, and whiskers = range of measurements. For plots with outliers (ie, b, c), the whiskers extend to measurements up to 1.5 times the IQ range, and the circles = outliers beyond 1.5 times the IQ range.
Figure 3c:
Box-and-whisker plots of (a) T1, (b) T2, and (c) apparent diffusion coefficient (ADC) measurements for normal transition zone (NTZ), noncancers, and cancers. Boxes = interquartile (IQ) range between the 25th and 75th percentiles, lines within boxes = medians, and whiskers = range of measurements. For plots with outliers (ie, b, c), the whiskers extend to measurements up to 1.5 times the IQ range, and the circles = outliers beyond 1.5 times the IQ range.
Prostate Cancer versus NTZ
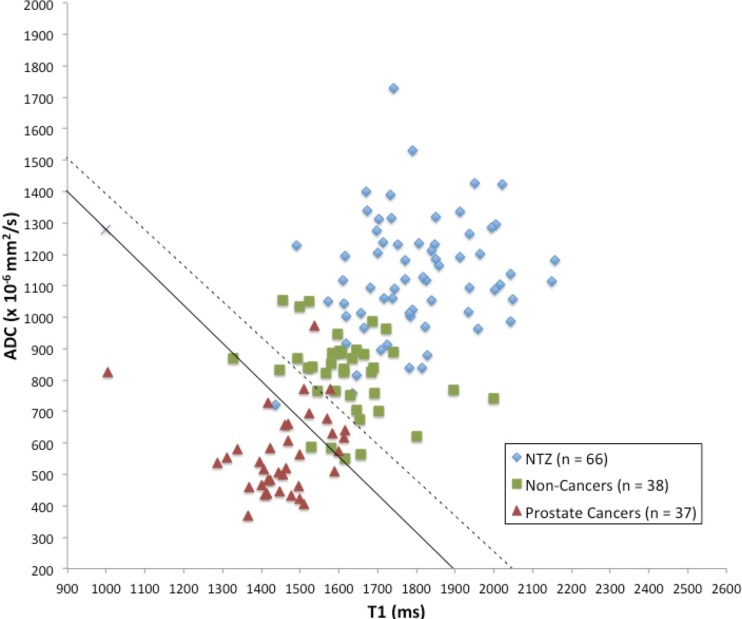
T1, T2, and ADC in prostate cancer (mean, 1450 msec ± 110 [standard deviation], 36 msec ± 11, and [0.57 ± 0.13] × 10−3 mm2/sec, respectively) were lower than those in NTZ (mean, 1800 msec ± 150, 65 msec ± 22, and [1.13 ± 0.19] × 10−3 mm2/sec, respectively) (P < .001 for each), and the best separation was provided by the combination of T2 and ADC, with an AUC of 0.99 (Table 4). The sensitivity and specificity for a T1 of 1610 msec, a T2 of 43 msec, and an ADC of 0.83 × 10⁻³ mm2/sec were 100% (37 of 37) and 91% (60 of 66), 86% (32 of 37) and 88% (58 of 66), and 97% (35 of 36) and 95% (62 of 65), respectively, for separating cancers from NTZ (Fig 4) (Table E3 [online]).
Figure 4:
Scatterplot of apparent diffusion coefficient (ADC) versus T1 for normal transition zone (NTZ) (n = 66), biopsy-proven noncancers (n = 38), and prostate cancers (n = 37) shows that cancers are well separated from biopsy-proven noncancers and NTZ in a quantitative space. Regions defined by the optimal model are denoted by the solid line (prostate cancers vs noncancers) and the dashed line (prostate cancers vs NTZ).
Prostate Cancers versus Noncancers
T1, T2, and ADC in prostate cancer (mean, 1450 msec ± 110, 36 msec ± 11, and [0.57 ± 0.13] × 10−3 mm2/sec, respectively) were lower than those in noncancers (mean, 1620 msec ± 120, 47 msec ±16, and [0.82 ± 0.13] × 10−3 mm2/sec, respectively) (P = .001 for T1 and ADC, P = .03 for T2). The best separation was provided by the combination of T1 and ADC. The AUC for T1 plus ADC (0.94) was higher than that for ADC (0.89) (P < .001) (Table 4). The sensitivity and specificity for a T1 of 1510 msec, a T2 of 35 msec, and an ADC of 0.70 × 10⁻³ mm2/sec were 76% (28 of 37) and 87% (33 of 38), 54% (20 of 37) and 82% (31 of 38), and 86% (31 of 36) and 84% (32 of 38), respectively (Fig 5).
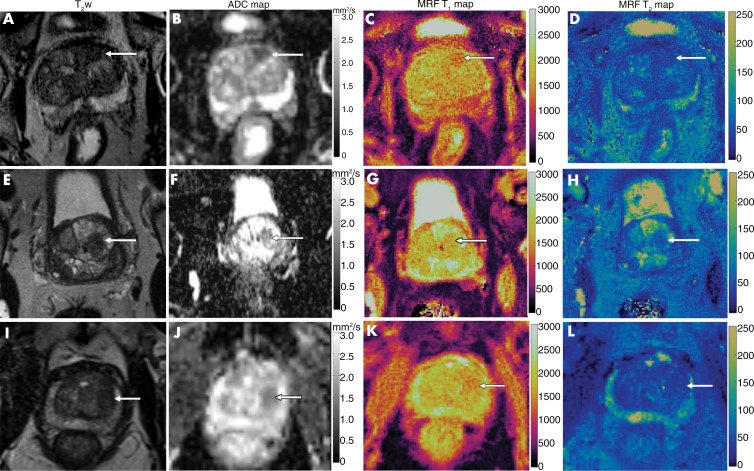
Figure 5:
Comparison of images from (left to right) axial T2-weighted MRI, apparent diffusion coefficient (ADC) mapping, and T1 and T2 MR fingerprinting mapping for targeted biopsy-proven prostate cancer, prostatitis, and a benign prostatic hyperplasia (BPH) nodule. A–D, Biopsy-proven prostate cancer (arrow). Mean T1, T2, and ADC were 1450 msec, 43 msec, and 0.51 × 10⁻³ mm2/sec, respectively. E–H, Biopsy-proven prostatitis (arrow). Mean T1, T2, and ADC were 1615 msec, 63 msec, and 0.83 × 10⁻³ mm2/sec, respectively. I–L, For the BPH nodule (arrow), mean T1, T2, and ADC were 1600 msec, 43 msec, and 0. 87 × 10−3 mm2/sec, respectively. Note the difference in T1 relaxation times between transition zone cancer and noncancers despite the lesions having similar hypointense signal intensity on T2-weighted images.
Clinically Significant Prostate Cancers (Gleason Score ≥ 7) versus Clinically Insignificant Lesions (Low-Grade Cancers Plus Noncancers)
T1 and ADC in clinically significant prostate cancer (mean, 1440 msec ± 130 and [0.58 ± 0.14] × 10-3 mm2/sec, respectively) were lower than those in clinically insignificant lesions (mean, 1580 msec ± 120 and [0.75 ± 0.17] × 10−3 mm2/sec, respectively) (P = .001 for T1 and ADC), but T2 did not differ (P = .15) (Table E2 [online]). The best separation was provided by the combination of T1 and ADC. The AUC for T1 plus ADC (0.81) was higher than that for ADC (0.75) (P = .002) (Table 4). The sensitivity and specificity for a T1 of 1500 msec and an ADC of 0.66 × 10⁻³ mm2/sec were 70% (16 of 23) and 77% (40 of 52) and 87% (20 of 23) and 71% (36 of 51), respectively.
PI-RADS Version 2 Category 3 Noncancers versus Category 3 Cancers
PI-RADS version 2 category 3 biopsy-proven noncancers had a higher T1 and ADC (mean, 1630 msec ± 120 and [0.81 ± 0.13] × 10−3 mm2/sec, respectively) than category 3 cancers (mean, 1430 msec ± 220 and [0.60 ± 0.17] × 10−3 mm2/sec, respectively) (P = .006 for T1 and P = .004 for ADC), while T2 did not differ (mean, 42 msec ± 8 for cancers and 47 msec ± 17 for noncancers; P = .66). For separation between PI-RADS category 3 cancers and noncancers, the AUC for T1 (0.79) was higher than the AUC for ADC (0.72), but the difference between the two AUCs was not significant (P = .8).
Discussion
The feasibility and the utility of a quantitative protocol consisting of MR fingerprinting–derived T1 and T2 mapping combined with apparent diffusion coefficient (ADC) mapping was evaluated for further characterization of transition zone lesions suspicious for cancer on T2-weighted images. T1, T2, and ADC were lower for cancers than for noncancers (P = .001 for T1 and ADC; P = .03 for T2). Models combining T1 with ADC showed the best performance in separating cancers from noncancers (area under the receiver operating characteristic curve [AUC], 0.94) as well as in separating clinically significant cancers (Gleason score ≥ 7) from clinically insignificant lesions (AUC, 0.81). T1 and ADC had different but complementary roles in lesion characterization. ADCs less than 0 0.70 × 10⁻³ mm2/sec had higher sensitivity and T1 values less than 1510 msec had improved specificity for differentiating cancers from noncancers. T2 showed a greater overlap between groups, as reported previously. There was good-to-excellent interreader agreement for MR fingerprinting T1 and T2 relaxation times, and the AUCs from independent two-reader measurements were also similar, which is encouraging for reducing subjectivity.
While the utility of ADC in the transition zone has been described (5,12,29–31), the differences for both T1 and T2 relaxation times in the transition zone are new findings, to our knowledge. In PI-RADS category 3 lesions, T1 may also be used to further distinguish cancers from noncancers. Subject to further prospective investigation, we hypothesize that suspicious lesions with an overall PI-RADS version 2 score of 3 but with low T1 and low ADCs could be upgraded in suspicion and consideration for biopsy, as these are more likely to be malignant. Conversely, biopsy may be potentially deferred for lesions with both high T1 and high ADCs, as these are less likely to represent clinically significant cancers. Previous studies have explored the utility of quantitative multiparametric models in improving radiologists’ interpretation of PI-RADS 3 lesions in the transition zone (14,32). However, the models in our study incorporate quantitative measurements of T1 and T2 relaxation times, as compared with normalized T2-weighted signal intensity and pharmacokinetic perfusion parameters (14,15,32,33).
This study had several limitations. First, this was a retrospective analysis from a single-institution study for initial exploration of the utility of combining MR fingerprinting–derived relaxometry with ADC to assess lesions in the transition zone. Second, the section thickness for T2-weighted/ADC and MR fingerprinting maps was different, and independent ROIs were drawn on T1/ T2 and ADC maps. Third, small sample size limited multivariable analysis for PI-RADS version 2 category 3 lesions. Fourth, although cross validation was used to partially correct for optimistic bias in AUC estimates, we did not use cross validation for the sensitivity and specificity estimates presented here. External validation on an external data set is needed for more accurate estimates of all measures of prediction accuracy. Fifth, we pooled lesions targeted with cognitive and in-gantry biopsy because the number of lesions targeted cognitively was small. Sixth, PI-RADS version 2 scores were assigned during clinical readings and were not reassigned for study purposes. However, both readers were blinded to original PI-RADS version 2 scores and thus quantitative analysis was not affected.
Our preliminary results regarding the use of quantitative MR fingerprinting for characterizing transition zone lesions holds promise for larger prospective validation studies. The demonstrated utility of T1 differs from conventional imaging, where T1-weighted images are used for detecting hemorrhage or for dynamic contrast-enhanced imaging. Cancers, noncancers, and NTZ have long T1s (>1000 msec), with a relatively small difference of 200–300 msec between NTZ, cancers, and noncancers. Conventional T1-weighted images obtained by using gradient-echo sequences with short repetition and echo times and low flip angles may not be optimally “weighted” to provide contrast for tissues with long T1 relaxation times and capture these differences for various tissues in the transition zone (34). Further work is needed to explore this question. Validation against whole-mount prostatectomy specimens will help in further understanding the histologic basis for both T1 and T2 relaxation times for the transition zone. Future studies could also incorporate multi-institution data sets and explore utility in complementing readings from radiologists with varying levels of experience and expertise.
In summary, MR fingerprinting–based relaxometry combined with apparent diffusion coefficient mapping may improve transition zone lesion characterization. Future optimization with volumetric region of interest evaluation and advanced MR fingerprinting sequences with higher resolution and co-registered relaxometry and diffusion maps may help in further refining this approach.
APPENDIX
Supported by the National Institutes of Health (1R01CA208236, 1R01DK098503, 1R01EB016728, 1R01EB017219, 1R01EB015898) and Siemens Healthineers.
Disclosures of Conflicts of Interest: A.P. Activities related to the present article: Siemens Healthineers paid money to Case Western Reserve University during time of employment as a postdoctorate research fellow from 2016 to June 2018. Activities not related to the present article: disclosed no relevant relationships. Other relationships: disclosed no relevant relationships. V.C.O. disclosed no relevant relationships. W.C.L. disclosed no relevant relationships. S.M. disclosed no relevant relationships. Y.J. Activities related to the present article: institution received a grant from Siemens Healthineers. Activities not related to the present article: institution has grants or grants pending with Siemens Healthineers; along with institution, has licensed patents related to MR fingerprinting to Siemens Healthineers and receives royalties from these patents. Other relationships: disclosed no relevant relationships. M.S. disclosed no relevant relationships. I.J.P. disclosed no relevant relationships. D.N. Activities related to the present article: disclosed no relevant relationships. Activities not related to the present article: has research agreements with but receives no remuneration from Canon Medical and GE Medical Systems. C.B. Activities related to the present article: disclosed no relevant relationships. Activities not related to the present article: has licensed patents with Siemens Healthineers and receives royalties from these patents. Other relationships: disclosed no relevant relationships. M.A.G. Activities related to the present article: institution received a grant from Siemens Healthineers. Activities not related to the present article: institution has grants or grants pending with Siemens Healthineers; has patents with Siemens Healthineers; receives royalties from Siemens Healthineers and GE Healthcare; has received travel expenses from Siemens Healthineers. Other relationships: disclosed no relevant relationships. I.J. disclosed no relevant relationships. L.E.P. disclosed no relevant relationships. V.G. Activities related to the present article: institution received a grant from Siemens Healthineers. Activities not related to the present article: institution has grants or grants pending with Siemens Healthineers; along with institution, has licensed patents related to MR fingerprinting to Siemens Healthineers and receives royalties from these patents; has received travel expenses from Siemens Healthineers. Other relationships: disclosed no relevant relationships.
Abbreviations:
- ADC
- apparent diffusion coefficient
- AUC
- area under the ROC curve
- DICOM
- Digital Imaging and Communications in Medicine
- DW
- diffusion weighted
- ICC
- intraclass correlation coefficient
- NTZ
- normal transition zone
- PI-RADS
- Prostate Imaging Reporting and Data System
- ROI
- region of interest
References
- 1.Noguchi M, Stamey TA, Neal JE, Yemoto CE. An analysis of 148 consecutive transition zone cancers: clinical and histological characteristics. J Urol 2000;163(6):1751–1755. [PubMed] [Google Scholar]
- 2.Patel V, Merrick GS, Allen ZA, et al. The incidence of transition zone prostate cancer diagnosed by transperineal template-guided mapping biopsy: implications for treatment planning. Urology 2011;77(5):1148–1152. [DOI] [PubMed] [Google Scholar]
- 3.McNeal JE, Redwine EA, Freiha FS, Stamey TA. Zonal distribution of prostatic adenocarcinoma. Correlation with histologic pattern and direction of spread. Am J Surg Pathol 1988;12(12):897–906. [DOI] [PubMed] [Google Scholar]
- 4.Hambrock T, Somford DM, Hoeks C, et al. Magnetic resonance imaging guided prostate biopsy in men with repeat negative biopsies and increased prostate specific antigen. J Urol 2010;183(2):520–527. [DOI] [PubMed] [Google Scholar]
- 5.Hoeks CMA, Vos EK, Bomers JGR, Barentsz JO, Hulsbergen-van de Kaa CA, Scheenen TW. Diffusion-weighted magnetic resonance imaging in the prostate transition zone: histopathological validation using magnetic resonance-guided biopsy specimens. Invest Radiol 2013;48(10):693–701. [DOI] [PubMed] [Google Scholar]
- 6.Ouzzane A, Puech P, Lemaitre L, et al. Combined multiparametric MRI and targeted biopsies improve anterior prostate cancer detection, staging, and grading. Urology 2011;78(6):1356–1362. [DOI] [PubMed] [Google Scholar]
- 7.Huang S, Reeves F, Preece J, Satasivam P, Royce P, Grummet JP. Significant impact of transperineal template biopsy of the prostate at a single tertiary institution. Urol Ann 2015;7(4):428–432. [DOI] [PMC free article] [PubMed] [Google Scholar]
- 8.Barentsz JO, Weinreb JC, Verma S, et al. Synopsis of the PI-RADS v2 Guidelines for Multiparametric Prostate Magnetic Resonance Imaging and Recommendations for Use. Eur Urol 2016;69(1):41–49. [DOI] [PMC free article] [PubMed] [Google Scholar]
- 9.Akin O, Sala E, Moskowitz CS, et al. Transition zone prostate cancers: features, detection, localization, and staging at endorectal MR imaging. Radiology 2006;239(3):784–792. [DOI] [PubMed] [Google Scholar]
- 10.Hoeks CMA, Hambrock T, Yakar D, et al. Transition zone prostate cancer: detection and localization with 3-T multiparametric MR imaging. Radiology 2013;266(1):207–217. [DOI] [PubMed] [Google Scholar]
- 11.Chesnais AL, Niaf E, Bratan F, et al. Differentiation of transitional zone prostate cancer from benign hyperplasia nodules: evaluation of discriminant criteria at multiparametric MRI. Clin Radiol 2013;68(6):e323–e330. [DOI] [PubMed] [Google Scholar]
- 12.Oto A, Kayhan A, Jiang Y, et al. Prostate cancer: differentiation of central gland cancer from benign prostatic hyperplasia by using diffusion-weighted and dynamic contrast-enhanced MR imaging. Radiology 2010;257(3):715–723. [DOI] [PMC free article] [PubMed] [Google Scholar]
- 13.Polanec S, Helbich TH, Bickel H, et al. Head-to-head comparison of PI-RADS v2 and PI-RADS v1. Eur J Radiol 2016;85(6):1125–1131. [DOI] [PubMed] [Google Scholar]
- 14.Dikaios N, Alkalbani J, Sidhu HS, et al. Logistic regression model for diagnosis of transition zone prostate cancer on multi-parametric MRI. Eur Radiol 2015;25(2):523–532. [DOI] [PMC free article] [PubMed] [Google Scholar]
- 15.Iyama Y, Nakaura T, Katahira K, et al. Development and validation of a logistic regression model to distinguish transition zone cancers from benign prostatic hyperplasia on multi-parametric prostate MRI. Eur Radiol 2017;27(9):3600–3608. [DOI] [PubMed] [Google Scholar]
- 16.Hoang Dinh A, Souchon R, Melodelima C, et al. Characterization of prostate cancer using T2 mapping at 3T: a multi-scanner study. Diagn Interv Imaging 2015;96(4):365–372. [DOI] [PubMed] [Google Scholar]
- 17.Ma D, Gulani V, Seiberlich N, et al. Magnetic resonance fingerprinting. Nature 2013;495(7440):187–192. [DOI] [PMC free article] [PubMed] [Google Scholar]
- 18.Jiang Y, Ma D, Seiberlich N, Gulani V, Griswold MA. MR fingerprinting using fast imaging with steady state precession (FISP) with spiral readout. Magn Reson Med 2015;74(6):1621–1631. [DOI] [PMC free article] [PubMed] [Google Scholar]
- 19.Yu AC, Badve C, Ponsky LE, et al. Development of a Combined MR Fingerprinting and Diffusion Examination for Prostate Cancer. Radiology 2017;283(3):729–738. [DOI] [PMC free article] [PubMed] [Google Scholar]
- 20.Panda A, Mehta BB, Coppo S, et al. Magnetic Resonance Fingerprinting-An Overview. Curr Opin Biomed Eng 2017;3:56–66. [DOI] [PMC free article] [PubMed] [Google Scholar]
- 21.Hansen MS, Sørensen TS. Gadgetron: an open source framework for medical image reconstruction. Magn Reson Med 2013;69(6):1768–1776. [DOI] [PubMed] [Google Scholar]
- 22.Lo WC, Jiang Y, Franson D, Griswold M, Gulani V, Seiberlich N. MR Fingerprinting using a Gadgetron-based reconstruction [abstr]. In: Proceedings of the Twenty-Sixth Meeting of the International Society for Magnetic Resonance in Medicine. Berkeley, Calif: International Society for Magnetic Resonance in Medicine, 2018; 3525. http://archive.ismrm.org/2018/3525.html. [Google Scholar]
- 23.Yushkevich PA, Piven J, Hazlett HC, et al. User-guided 3D active contour segmentation of anatomical structures: significantly improved efficiency and reliability. Neuroimage 2006;31(3):1116–1128. [DOI] [PubMed] [Google Scholar]
- 24.Shrout PE, Fleiss JL. Intraclass correlations: uses in assessing rater reliability. Psychol Bull 1979;86(2):420–428. [DOI] [PubMed] [Google Scholar]
- 25.Koo TK, Li MY. A Guideline of Selecting and Reporting Intraclass Correlation Coefficients for Reliability Research. J Chiropr Med 2016;15(2):155–163 [Published correction appears in J Chiropr Med 2017;16(4):346.] 10.1016/j.jcm.2016.02.012. [DOI] [PMC free article] [PubMed] [Google Scholar]
- 26.Holm S. A Simple Sequentially Rejective Multiple Test Procedure. Scand J Stat 1979;6(2):65–70. https://www.jstor.org/stable/4615733. [Google Scholar]
- 27.Pregibon D. Logistic Regression Diagnostics. Ann Stat 1981;9(4):705–724. [Google Scholar]
- 28.Youden WJ. Index for rating diagnostic tests. Cancer 1950;3(1):32–35. [DOI] [PubMed] [Google Scholar]
- 29.Jung SI, Donati OF, Vargas HA, Goldman D, Hricak H, Akin O. Transition zone prostate cancer: incremental value of diffusion-weighted endorectal MR imaging in tumor detection and assessment of aggressiveness. Radiology 2013;269(2):493–503. [DOI] [PubMed] [Google Scholar]
- 30.Yoshizako T, Wada A, Hayashi T, et al. Usefulness of diffusion-weighted imaging and dynamic contrast-enhanced magnetic resonance imaging in the diagnosis of prostate transition-zone cancer. Acta Radiol Stockh Swed 1987. 2008;49(10):1207–1213. [DOI] [PubMed] [Google Scholar]
- 31.Costa DN, Xi Y, Aziz M, et al. Prospective Inclusion of Apparent Diffusion Coefficients in Multiparametric Prostate MRI Structured Reports: Discrimination of Clinically Insignificant and Significant Cancers. AJR Am J Roentgenol 2019;212(1):109–116. [DOI] [PubMed] [Google Scholar]
- 32.Hambrock T, Vos PC, Hulsbergen-van de Kaa CA, Barentsz JO, Huisman HJ. Prostate cancer: computer-aided diagnosis with multiparametric 3-T MR imaging--effect on observer performance. Radiology 2013;266(2):521–530. [DOI] [PubMed] [Google Scholar]
- 33.Kershaw LE, Hutchinson CE, Buckley DL. Benign prostatic hyperplasia: evaluation of T1, T2, and microvascular characteristics with T1-weighted dynamic contrast-enhanced MRI. J Magn Reson Imaging 2009;29(3):641–648. [DOI] [PubMed] [Google Scholar]
- 34.Yokoo T, Bae WC, Hamilton G, et al. A quantitative approach to sequence and image weighting. J Comput Assist Tomogr 2010;34(3):317–331. [DOI] [PubMed] [Google Scholar]
Associated Data
This section collects any data citations, data availability statements, or supplementary materials included in this article.


