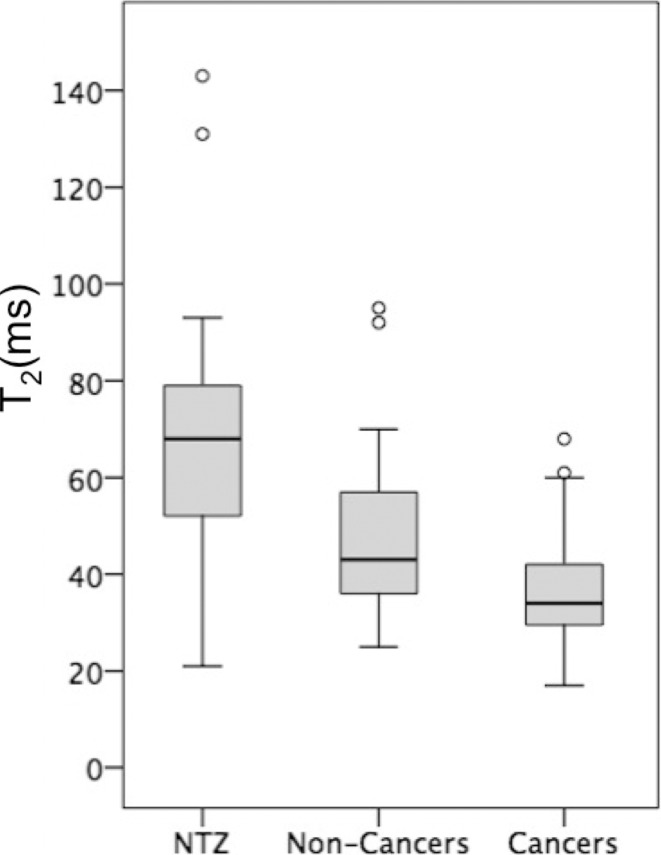
Figure 3b:
Box-and-whisker plots of (a) T1, (b) T2, and (c) apparent diffusion coefficient (ADC) measurements for normal transition zone (NTZ), noncancers, and cancers. Boxes = interquartile (IQ) range between the 25th and 75th percentiles, lines within boxes = medians, and whiskers = range of measurements. For plots with outliers (ie, b, c), the whiskers extend to measurements up to 1.5 times the IQ range, and the circles = outliers beyond 1.5 times the IQ range.

