Abstract
The erythrocyte sedimentation rate (ESR) is a routine test for inflammation. Few studies have investigated the potential influence of lifestyle factors and common metabolic abnormalities on the ESR. This study investigates the influence of demographic factors, alcohol consumption, smoking, physical activity, obesity, and metabolic syndrome on the ESR in adults.
This cross-sectional study covered 1472 individuals (44.5% males; age range, 18–91 years) randomly selected from the population of a Spanish municipality. The ESR was measured using a standardized method. We assessed habitual alcohol consumption in standard drinking units, along with tobacco smoking, regular physical exercise (by questionnaire), body mass index, and variables defining metabolic syndrome. Multivariate analyses were performed, including mean corpuscular volume and hemoglobin concentration in the models.
The ESR was higher in females than in males, and increased steadily with age. Median ESR of females was 2-fold higher than that of males, and median ESR of individuals aged >65 years was 2-fold higher than that of individuals in the youngest category (ages 18–35 years). Body mass index, presence of metabolic syndrome, and smoking were independently and positively associated with higher ESR values. Light alcohol drinkers and individuals with high regular physical activity displayed lower ESR values than did alcohol abstainers and individuals with low physical activity, respectively.
ESR varies greatly with age and sex, and corresponding reference values are proposed. Lifestyle factors (physical activity, smoking, and alcohol consumption) and common metabolic abnormalities (obesity and related metabolic syndrome) may also influence ESR values.
Keywords: age, alcohol, erythrocyte sedimentation rate, gender, metabolic syndrome, obesity, physical exercise, smoking
1. Introduction
The erythrocyte sedimentation rate (ESR) is an inflammation marker used in routine clinical practice. Although it was 1st described more than a century ago,[1] its clinical utility remains unaltered.[2] The ESR measures the rate (mm/h) at which red blood cells form aggregates (or rouleaux) that sediment when anticoagulated fresh blood is left in a vertical tube.[3] It is therefore not the measure of an analyte but of a physical phenomenon.[3–5] It has been suggested that the term “ESR” should be changed to “length of sedimentation reaction in blood,”[4,6,7] though this denomination is not widely accepted. The ESR is an estimator of overall inflammation because it depends on the concentration of acute-phase proteins circulating in the blood, particularly fibrinogen; these proteins increase the dielectric constant in the blood and neutralize the negative charges on the surface of red blood cells, which repel one another and physiologically oppose aggregation.[3,5] Despite its limitations and the introduction of more specific inflammation markers, the ESR is still widely used for diagnosis and monitoring of a variety of conditions, particularly infections and rheumatic diseases.[2] ESR sensitivity and specificity are not high but the test has the advantages of familiarity, simplicity, speed, low cost, and extensive coverage in the literature.[4,5,7,8]
Determining the ESR in general populations is important for interpreting reference values. The guidelines for definition and determination of reference intervals indicate that partitioning should be considered when there are significant differences among subgroups defined by age, sex, and common exposures.[9,10] The ESR increases with age in adults,[5,6,11–14] and at a given age is higher in females than in males.[5,6,12–14] Common metabolic abnormalities, such as obesity and the related metabolic syndrome, are proinflammatory states which can be associated with increased ESR.[15–17] With regard to lifestyle factors, previous studies have reported lower ESRs in relation with physical activity in a selected elderly population.[18] Previous studies have also shown that smoking increases ESR in females[19] and in selected samples of patients with arthritis.[20] The potential effect of additional lifestyle factors, such as alcohol consumption, on ESR has been not fully explored. Heavy drinking has proinflammatory effects; in fact, alcoholic liver disease is a paradigm of inflammatory disorder.[21] Hence, the ESR is increased in patients with complications of alcohol abuse[22] and in those with alcoholic hepatitis.[21] However, moderate alcohol consumption is associated with lower ESR values in selected samples of patients with inflammatory diseases, both high grade (chronic arthritis)[20] and low grade (coronary disease).[23] Lastly, the ESR may be influenced by the number, volume, and shape of erythrocytes, tending to be higher in patients with anemia or high red blood cell volume.[2,5,24]
To the best of our knowledge, there are no studies that have comprehensively assessed the potential effect of demographic (age and sex), metabolic (obesity and metabolic syndrome), and lifestyle factors (alcohol consumption, smoking, and physical activity) on ESR in a general adult population. The present study sought to investigate the potential effect of these factors on ESR. The results were further adjusted for mean corpuscular volume (MCV) and hemoglobin concentration. An approach to determining ESR reference values was developed.
2. Methods
2.1. Design
We conducted a cross-sectional study in the municipality of A-Estrada (Northwestern Spain, location 42°41′21″N, 8°29′14″W). An outline of the study (AEGIS, A-Estrada Glycation and Inflammation Study) is available at www.clinicaltrials.gov, code NCT01796184. The municipality had an adult population (age >18 years) of 18,474 when the study started in 2012. A flowchart of the study profile is shown in Figure 1. An age-stratified random sample of the population aged 18 years and older was drawn from Spain's National Health System Registry, which covers more than 95% of the population and contains the name, date of birth, and address of every person entitled to primary care. The sample was stratified into the following age groups: 18 to 29 years; 30 to 39 years; 40 to 49 years; 50 to 59 years; 60 to 69 years; 70 to 79 years; and 80 years and older. A computer program generated a random sample of an equal number (n = 500) of subjects in each age group. Of this initial sample of 3500 individuals, 2230 could be assessed for eligibility and displayed no exclusion criteria (Fig. 1); of these, 1516 individuals agreed to participate (overall participation rate, 68%). Participation was lower in males than in females (65% vs 71%). There were no significant differences in terms of age or residence (rural vs urban) between participants and nonparticipants. From November 2012 through March 2015, all subjects were successively contacted and asked to attend the Primary Care Center for evaluation, which included an interviewer-administered structured questionnaire and fasting venous blood sampling. The ESR was unavailable for technical reasons in 27 individuals. In addition, 17 individuals were excluded from this specific study, due to chronic inflammatory diseases that could influence the ESR. The final study population thus included 1472 individuals, 655 (45%) of whom were males. Median age was 52 years (range, 18–91 years).
Figure 1.
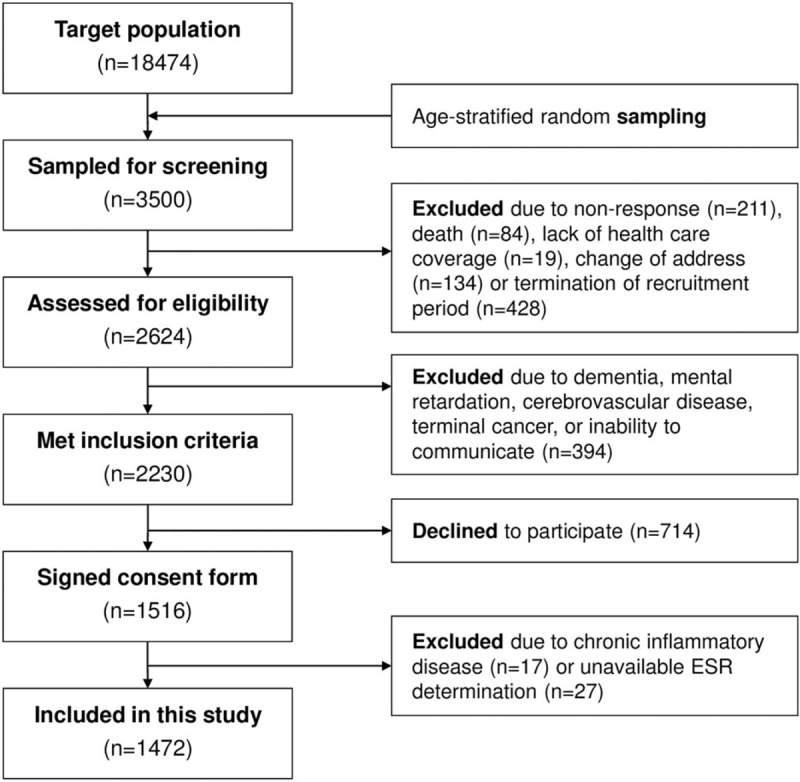
Flowchart showing study profile. ESR = erythrocyte sedimentation rate.
2.2. Ethical issues
Written informed consent was obtained from all participants. The study was approved by the Regional Ethics Committee (code 2010-315) and conformed to the current Helsinki Declaration.
2.3. Assessment of alcohol consumption
Alcohol consumption was evaluated in standard drinking units,[25] by summing the number of glasses of wine (∼10 g), bottles of beer (∼10 g), and units of spirits (∼20 g) regularly consumed per week. Individuals with an alcohol consumption of 1 to 140 g/wk were defined as light drinkers, those with an alcohol consumption of 141 to 279 g/wk were defined as moderate drinkers, and those with an alcohol consumption ≥280 g/wk were defined as heavy drinkers. Median alcohol consumption in heavy drinkers was 350 g/wk (range, 280–1100 g/wk). The remainder, comprising alcohol abstainers and occasional alcohol drinkers, were included in the same group.
2.4. Assessment of smoking
Consumers of at least 1 cigarette per day were deemed to be smokers. Individuals who had quit smoking during the preceding year were still considered smokers, while those who had quit more than 1 year prior to the study were considered ex-smokers.
2.4.1. Definition of metabolic abnormalities
Body mass index (BMI) was calculated as weight (in kilogram) divided by the square of height (in meters). Following standard criteria, individuals were classified as normal weight (<25 kg/m2), overweight (25–30 kg/m2), or obese (>30 kg/m2).
Metabolic syndrome was defined according to Adult Treatment Panel III criteria,[26] namely: abdominal obesity (waist circumference >102 cm in males or >88 cm in females); hypertriglyceridemia (fasting serum triglycerides ≥150 mg/dL); low high-density lipoprotein (HDL)-cholesterol levels (fasting HDL-cholesterol <40 mg/dL in males or <50 mg/dL in females); increased blood pressure (arterial blood pressure ≥130/≥85 mm Hg or current antihypertensive medication use); and hyperglycemia (fasting serum glucose ≥110 mg/dL or current antidiabetic therapy). Individuals who met at least 3 of these criteria were classified as having metabolic syndrome.
2.5. Assessment of physical activity
All study participants completed the International Physical Activity Questionnaire (short version). The questionnaire is freely available at https://sites.google.com/site/theipaq/home and has been validated in Spain.[27] The questionnaire allows for the calculation of Metabolic Equivalents of Task (MET) and for stratification of habitual physical activity as low, moderate, or high.[28] Individuals were considered to display moderate physical activity when they met any one of the following 3 criteria: 3 or more days of vigorous activity of at least 20 minutes per day or 5 or more days of moderate-intensity activity or walking of at least 30 minutes per day or 5 or more days of any combination of walking, moderate-intensity or vigorous intensity activities achieving a minimum of at least 600 MET-min/wk. Individuals were considered to display high physical activity when they met any one of the following 2 criteria: vigorous-intensity activity on at least 3 days and accumulating at least 1500 MET-min/wk, or 7 days of any combination of walking, moderate-intensity or vigorous intensity activities achieving a minimum of at least 3000 MET-min/wk. Those individuals who did not meet criteria for moderate or high physical activity were considered low/inactive.
2.6. Erythrocyte sedimentation rate assay
The ESR was measured in an automated TEST-1 device (Alifax, Padua, Italy), which uses microsedimentation and quantitative capillary photometry technology. The system uses an infrared ray microphotometer with a light wave length of 950 nm. The electrical impulses are collected by a photodiode detector and are correlated to the concentration of red blood cells at that capillary level. The impulses measured per unit of time are then used to delineate a sedimentation curve for each sample.[7] The test was designed to overcome some drawbacks of the Westergren method; it allows for calculation of ESR in low blood volumes (150 μL) and detects the formation of rouleaux in 20 seconds. Determination of ESR by this method appears to be less affected by hemoglobin and corpuscular volume.[6,29] The TEST-1 has been validated in relation to the reference Westergren method[4,6] following the International Council for Standardization in Hematology criteria.[2] Similar devices are currently used for ESR determination in most clinical laboratories around the world.[2] According to the manufacturer's instructions, the coefficient of variation is 4.8% for samples with normal ESR and 5.0% for samples with high ESR. For this study, blood was drawn in vacuum tubes containing K3EDTA (Becton Dickinson, Franklin Lakes, NJ). Determination of ESR was performed within the following 4 hours. The same blood sample was used for measuring hemoglobin concentration and MCV. The method, devices, and personnel for ESR determination were the same as those routinely used at our hospital for clinical purposes. The hospital's reference ESR values are 0 to 20 mm/h for males and 0 to 30 mm/h for females.
2.7. Statistical analyses
The Mann–Whitney test was used to compare numerical variables. Different distributions were fitted using Generalized Additive Models for Location Scale and Shape (GAMLSS).[30] GAMLSS provide a flexible modeling framework for responses from a large class of distributions, including the normal distribution, as well as highly skewed and kurtotic continuous distributions. GAMLSS allows for the modeling, not only of the mean response μ (i.e., location), but also of other distribution parameters, such as standard deviation σ (i.e., scale) or skewness and kurtosis (i.e., shape parameters), as a function of a set of explanatory variables. The following GAMLSS formulation was used for modeling their corresponding mean and scale parameters:
 |
 |
where Xj (j = 1,...,p) are the set of p covariates and gk (k = 1,2) are monotonic link functions relating the parameters μ and σ to the covariates. The influence of age and all other continuous covariates on parameters of the distributions considered were modeled, either as a constant, a linear function, or a penalized spline of the covariate.[31] Goodness-of-fit was assessed by the Bayesian Information Criterion and Q-Q plots, to select best fitting distribution model (Generalized Inverse Gaussian [GIG], which is appropriate for highly positive skewed data) and the influence of covariates on the distribution parameters. Worm plots were used as a diagnostic tool to assess whether adjustment for kurtosis and/or skewness was required.[32] Percentile curves of ESR as a function of covariates (age and sex) were calculated on the basis of the GAMLSS regression models that displayed the best goodness-of-fit. To facilitate the clinical use of percentile curve data, we defined cut points for ESR at the 90th, 95th, and 97.5th percentiles. All statistical analyses were performed using the R statistical software environment (version 3.0.2; R Foundation, http://www.r-project.org) with the “gamlss” package.[33]
3. Results
3.1. Descriptive results and influence of demographics on the ESR
Overall, ESR values for the study population as a whole ranged from 1 to 120 mm/h (median value, 9 mm/h). A histogram of ESR results is depicted in Figure 2. The ESR was significantly higher in females (median 12 mm/h and interquartile range 7–21 mm/h) than in males (median 6 mm/h and interquartile range 3–12 mm/h; P < .001). For that reason, the ESR values in males and females are shown separately (Table 1). The ESR significantly increased with age in both males and females (Table 1). The association between ESR and sex and age was maintained after adjustment for additional covariates, including alcohol consumption, smoking, physical activity, BMI, metabolic syndrome, hemoglobin concentration, and MCV (Table 2). Moreover, age and sex were the strongest factors associated with ESR in that model, along with blood hemoglobin concentration (Table 2). The relation between age, hemoglobin, MCV, and ESR in males and females is further depicted in Figure 3.
Figure 2.
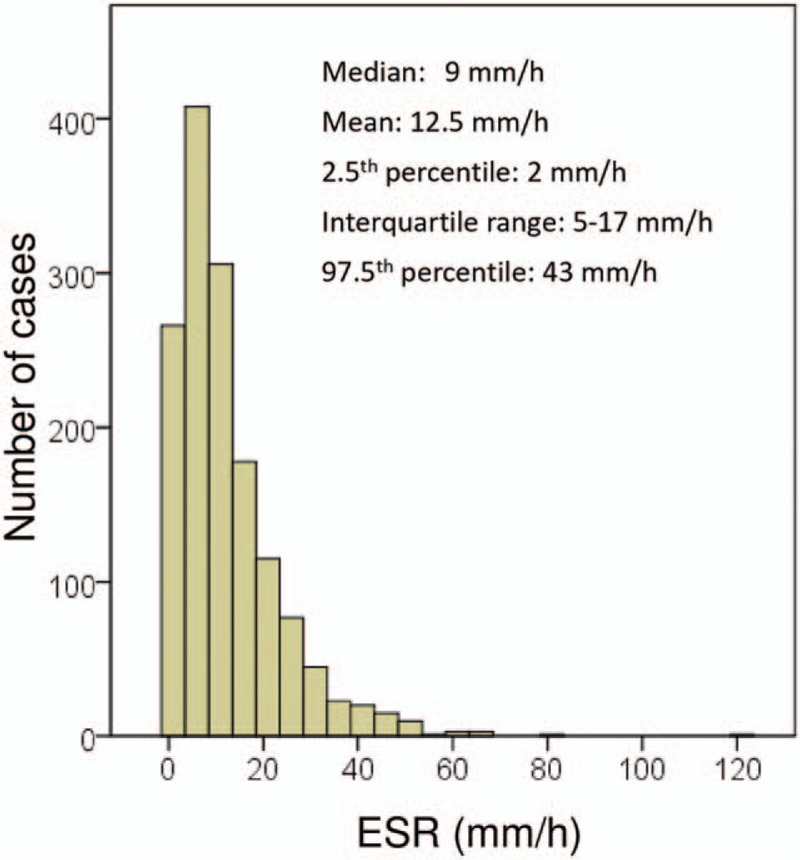
Histogram of erythrocyte sedimentation rate (ESR) distribution in the study population.
Table 1.
ESR in relation to age, lifestyle factors, and metabolic abnormalities in males and females.
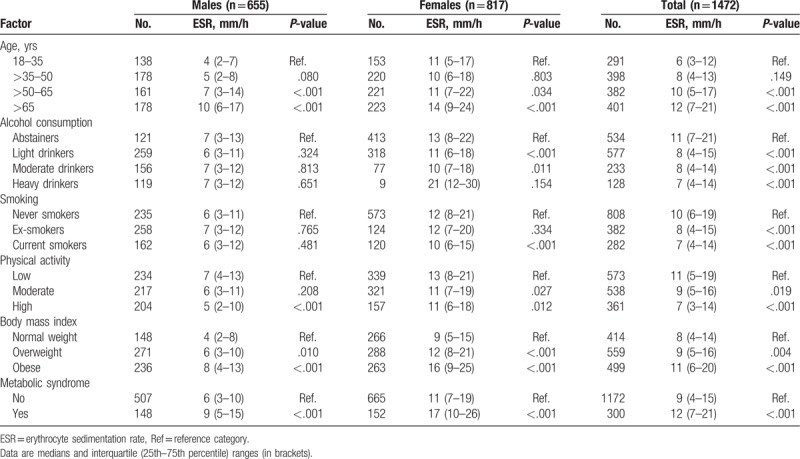
Table 2.
Multivariate analyses.
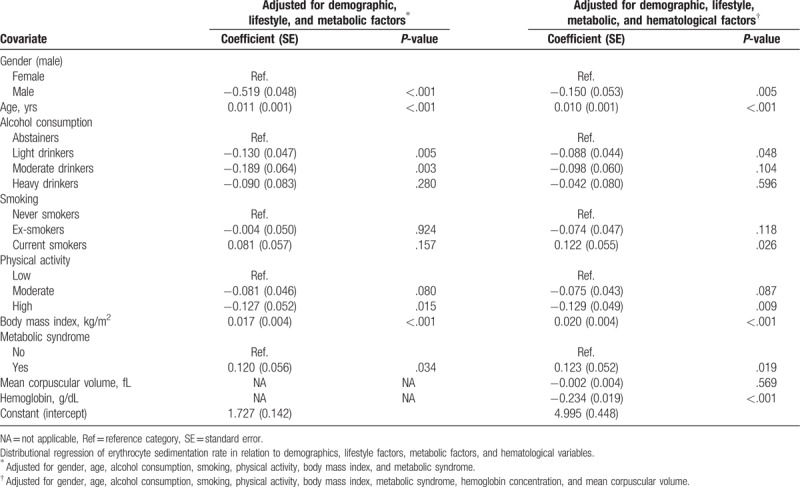
Figure 3.
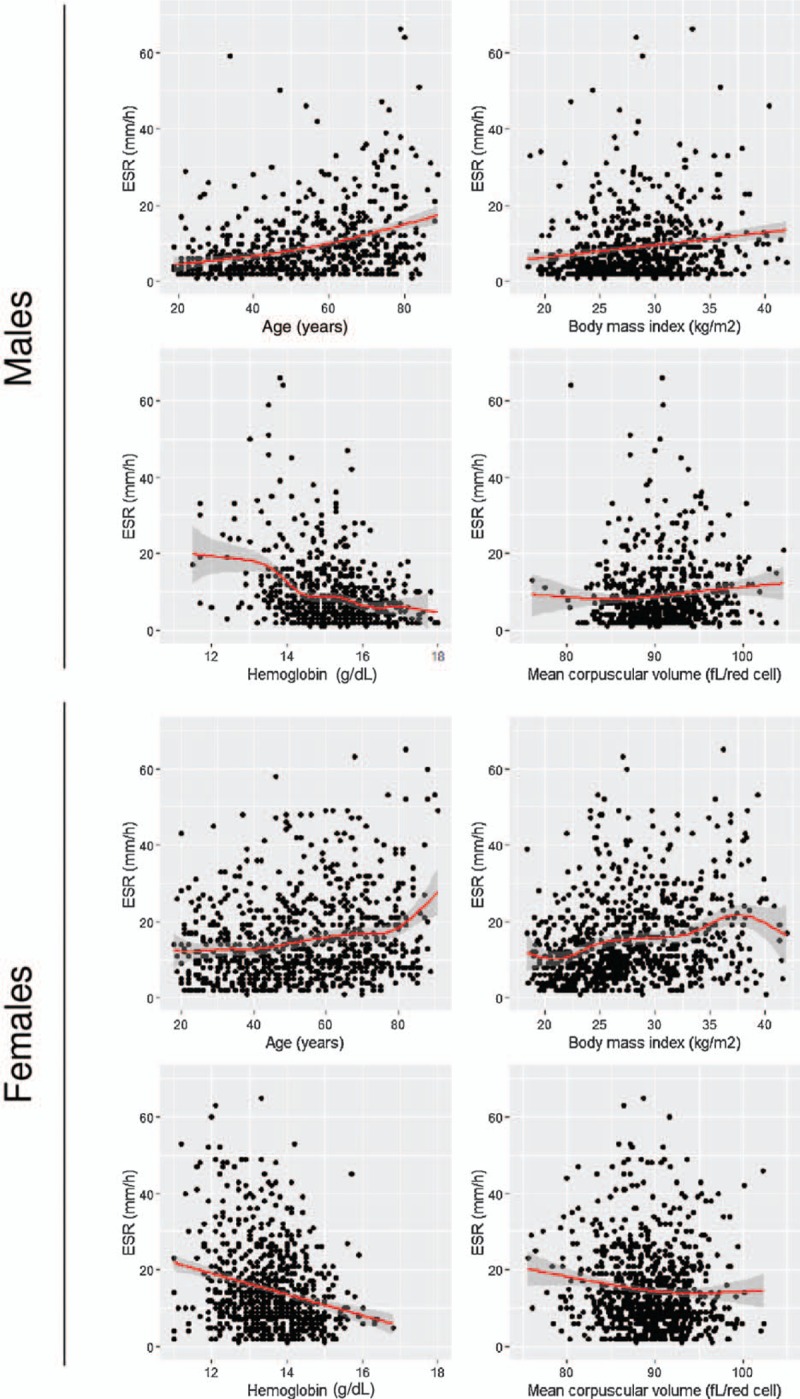
Relationship between erythrocyte sedimentation rate (ESR) and age, body mass index, blood hemoglobin concentration, and red blood cell mean corpuscular volume in males and females.
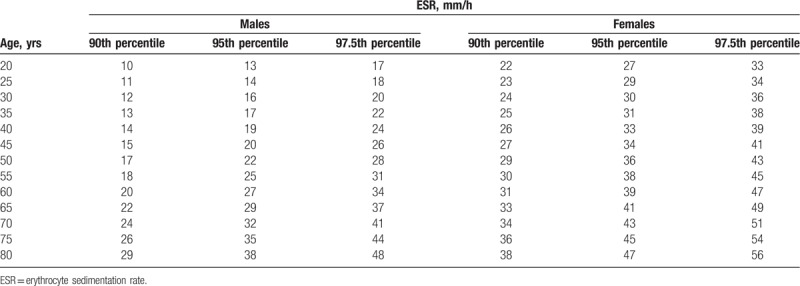
A total of 141 individuals (9.6%) registered ESRs higher than the laboratory threshold for normality in males and females (20 and 30 mm/h, respectively). Suggested ESR reference values based on the average predicted value for different ages in males and females are shown in Table 3.
Table 3.
Suggested ESR reference points based on the average predicted value within each age-and-sex group, showing the 90th, 95th, and 97.5th percentiles in each category.
3.2. Influence of alcohol consumption on the ESR
Alcohol consumption was negatively associated with the ESR, that is, regular drinkers of low, moderate, and high quantities of alcohol registered a lower ESR than did abstainers/occasional drinkers in the univariate analysis (Table 1). This negative association was particularly evident among females (Table 1). The relationship between light and moderate alcohol consumption and a lower ESR was still present after adjustment for age, sex, smoking, physical activity, BMI, and metabolic syndrome (Table 2). However, the association became attenuated after adjusting for hematologic covariates (hemoglobin concentration and MCV), with the result that only the association between light alcohol consumption and lower ESR values remained statistically significant (Table 2).
3.3. Influence of smoking on the ESR
Smokers displayed a lower ESR than did never smokers in the univariate analysis, particularly among females (Table 1). However, this association became attenuated and even tended to become inverse after adjusting for covariates (Table 2). In these models, current smokers registered higher ESR values than did never smokers.
3.4. Influence of physical activity on the ESR
Moderate and high regular physical exercises were negatively associated with ESR in the univariate analysis (Table 1). High regular physical exercise was associated with lower ESR after adjustment for covariates (Table 2).
3.5. Influence of metabolic factors on the ESR
Overweight, obesity, and the metabolic syndrome were positively associated with ESR in both males and females (Table 1). The association between BMI and metabolic syndrome, and higher ESR values was still present after adjusting for covariates (Table 2). The relationship between BMI and ESR in males and females is further depicted in Figure 3.
4. Discussion
The results of our study show that ESR values in a general adult population are strongly influenced by age and sex. Moreover, lifestyle variables (regular physical exercise, alcohol consumption, and smoking) and common metabolic abnormalities (metabolic syndrome and high BMI) can influence ESR values in this population. Importantly, these associations remain after adjustment for covariates as well as for MCV and hemoglobin concentration, which is also a strong determinant of ESR. To the best of our knowledge, this is the 1st study to have comprehensively examined the influence of all these variables in a large general adult population sample.
The effect of age and gender on ESR has previously been described. It is known that the ESR increases with age[5,6,11–14] and is higher in females than in males.[5,6,12–14] According to our results, these differences are large enough to propose different reference values. Simplistic approaches which only establish an average reference value for males and females may therefore be inaccurate.
The effect of alcohol consumption on ESR has not been fully investigated to date. Anecdotally, Sykes[34] reported that contamination of blood with small ethanol doses induced lower ESR. Bain concluded that alcohol consumption had no significant influence on the ESR but his sample was highly selected (386 healthy workers from a hospital staff aged 18–59 years); moreover, classification of alcohol consumption was very simplistic[12] and therefore nondifferential misclassification could have biased the results to the null. More recent studies have mentioned alcohol consumption but have not analyzed its relationship with ESR in depth.[13] In our experience, light and moderate alcohol consumption is associated with lower ESR. In univariate analyses, this association was only evident among females. In multivariate analyses, light and moderate alcohol consumption was associated with lower ESR after adjustment for age, sex, smoking, physical activity, BMI, and metabolic syndrome. However, the association became largely attenuated after adjustment for hemoglobin concentration and MCV, suggesting that alcohol-induced hematological alterations partly mediate the apparent effects of alcohol on ESR. Light alcohol consumption remained significantly associated with lower ESR values, a finding that is in agreement with studies in selected populations of patients with specific inflammatory diseases.[22,23] Furthermore, these results would be in agreement with studies showing that light-to-moderate alcohol drinking has antiinflammatory effects, as revealed by lower serum concentrations of C-reactive protein (CRP).[35,36] These antiinflammatory effects could underlie part of the well-known benefit of low-to-moderate alcohol consumption on overall mortality.[37,38] Our study failed to find any significant association between heavy (≥280 g/wk) alcohol drinking and ESR. Previous studies have reported increased ESR in patients with complications of alcohol abuse.[21,22] It should be noted that median alcohol intake among heavy drinkers in our study was 50 g/d, and median intake in a series of 138 alcoholics admitted to the hospital in the same area was 120 g/wk.[39] These alcoholic patients had elevated inflammation markers,[39] including ESR, which was abnormally high in 59% of them (median ESR 27 mm/h, range 8–88 mm/h, unpublished observation). Taken together, these results are consistent with an antiinflammatory effect of light-to-moderate alcohol consumption and a proinflammatory effect of excessive alcohol consumption. A similar J- or U-shaped relationship between alcohol consumption and inflammatory markers has been described for CRP and tumor necrosis factor-alpha[35,36] but has not been described for the ESR. Intriguingly, the relationship between the quantity of alcohol consumption and mortality is also J-shaped.[37,38]
The potential effect of smoking on ESR is of interest. The univariate analyses showed that smoking is associated with lower ESR values, particularly among females. However, given that smoking is associated with male gender, alcohol consumption, and age, adjustment for these variables was followed by a change in the direction of association, that is, smoking was found to be associated with higher ESR values in the multivariate analyses. Previous studies have also shown that smoking increases ESR in selected samples of females[19] and patients with arthritis.[20,40]
Regular physical exercise, particularly of a high level, was associated with lower ESR values, as compared to individuals with low physical activity. Likewise, previous studies reported lower ERS in relation with physical activity in a selected sample of elderly people.[18] Furthermore, physical activity was observed to be negatively correlated with acute phase reactants such as CRP,[41] a finding that is in agreement with an overall antiinflammatory effect of physical exercise.[42] The relationship between regular exercise and ESR values in the general population has not been previously investigated. Prospective studies are required to confirm this association.
The univariate analyses showed that the ESR was higher in individuals with metabolic abnormalities, including overweight, obesity, and metabolic syndrome. In the multivariate analyses, BMI and the presence of metabolic syndrome maintained the association with higher ESR values. This finding has already been reported and is consistent with a proinflammatory state in these disorders.[15–17]
The study has some limitations that warrant mention. The cross-sectional design has inherent temporal ambiguity, which limits any inference of causality. The study participation rate was adequate, and there is no reason to suspect that selection might have biased the results; indeed, the fact that the study was population based and that the participants were randomly selected can be considered strengths. The authors acknowledge that confounding is a limitation of the study (as with other observational studies). Age and gender are associated with alcohol consumption, physical activity, and metabolic abnormalities. To disentangle their potential confounding effects, multivariate analyses were performed. The sample size afforded sufficient power to adjust for covariates. The ESR was determined using a commercial method that has been validated with the reference method and is widely used for clinical purposes.[2,4,6,7,29] This method appears to be less affected by anemia and size of erythrocytes than is the traditional Westergren method,[6,29] and the results were further adjusted for MCV and blood hemoglobin concentration.
Despite being old and unspecific, ESR remains a routine test in clinical practice. From a mechanistic stance, our findings are consistent with a proinflammatory effect of metabolic abnormalities and smoking, as well as with an antiinflammatory effect of light-to-moderate alcohol consumption and physical exercise. From a clinical standpoint, our results highlight the importance of adjusting for age, gender, alcohol consumption, smoking, physical activity, and metabolic abnormalities in studies investigating ESR-related factors in the population. Furthermore, demographic factors are strong enough to define age-and-gender reference ESR values, as proposed by this study.
Author contributions
Conceptualization: Bernardo Sopeña, Francisco Gude, Arturo Gonzalez-Quintela.
Data curation: Vanessa Alende-Castro, Manuela Alonso-Sampedro, Nuria Vazquez-Temprano, Carmen Tuñez, Daniel Rey, Carmen García-Iglesias.
Funding acquisition: Francisco Gude, Arturo Gonzalez-Quintela.
Investigation: Vanessa Alende-Castro, Manuela Alonso-Sampedro, Carmen Tuñez, Daniel Rey, Carmen García-Iglesias.
Methodology: Bernardo Sopeña, Francisco Gude, Arturo Gonzalez-Quintela.
Project administration: Manuela Alonso-Sampedro, Arturo Gonzalez-Quintela.
Supervision: Francisco Gude, Arturo Gonzalez-Quintela.
Writing – original draft: Vanessa Alende-Castro, Nuria Vazquez-Temprano, Arturo Gonzalez-Quintela.
Writing – review & editing: Manuela Alonso-Sampedro, Bernardo Sopeña, Francisco Gude.
Arturo Gonzalez-Quintela orcid: 0000-0002-6909-1807.
Footnotes
Abbreviations: BMI = body mass index, ESR = erythrocyte sedimentation rate, GAMLSS = generalized additive models for location scale and shape, MCV = mean corpuscular volume, MET = metabolic equivalents of task.
The study was supported by a grant from the Carlos III Institute of Health (Instituto de Salud Carlos III, PI16/01404 and PI16/01395), the Spanish Network for Additive Disorders (Red de Trastornos Adictivos, RD16/0017/0018, Spanish Ministry of Health), the Spanish Network for Preventive Activity & Health Promotion Research in Primary Care (Red de Actividades Preventivas y de Promocion de Salud en Atención Primaria, RD16/0007/0006), and the European Regional Development Fund (FEDER).
The authors have no conflicts of interest to disclose.
References
- [1].Grzybowski A, Sak J. A short history of the discovery of the erythrocyte sedimentation rate. Int J Lab Hematol 2012;34:442–4. [DOI] [PubMed] [Google Scholar]
- [2].Jou JM, Lewis SM, Briggs C, et al. ICSH review of the measurement of the erythocyte sedimentation rate. Int J Lab Hematol 2011;33:125–32. [DOI] [PubMed] [Google Scholar]
- [3].Fabry TL. Mechanism of erythrocyte aggregation and sedimentation. Blood 1987;70:1572–6. [PubMed] [Google Scholar]
- [4].Romero A, Muñoz M, Ramírez G. Length of sedimentation reaction in blood: a comparison of the test 1 ESR system with the ICSH reference method and the sedisystem 15. Clin Chem Lab Med 2003;41:232–7. [DOI] [PubMed] [Google Scholar]
- [5].Sox HC, Jr, Liang MH. The erythrocyte sedimentation rate. Guidelines for rational use. Ann Intern Med 1986;104:515–23. [DOI] [PubMed] [Google Scholar]
- [6].Piva E, Sanzari MC, Servidio G, et al. Length of sedimentation reaction in undiluted blood (erythrocyte sedimentation rate): variations with sex and age and reference limits. Clin Chem Lab Med 2001;39:451–4. [DOI] [PubMed] [Google Scholar]
- [7].Plebani M, De Toni S, Sanzari MC, et al. The TEST 1 automated system: a new method for measuring the erythrocyte sedimentation rate. Am J Clin Pathol 1998;110:334–40. [DOI] [PubMed] [Google Scholar]
- [8].Zlonis M. The mystique of the erythrocyte sedimentation rate. A reappraisal of one of the oldest laboratory tests still in use. Clin Lab Med 1993;13:787–800. [PubMed] [Google Scholar]
- [9].Horn PS, Pesce AJ. Reference intervals: an update. Clin Chim Acta 2003;334:5–23. [DOI] [PubMed] [Google Scholar]
- [10].Sasse EA. Determination of reference intervals in the clinical laboratory using the proposed guideline National Committee for Clinical Laboratory Standards C28-P. Arch Pathol Lab Med 1992;116:710–3. [PubMed] [Google Scholar]
- [11].Hilder FM, Gunz FW. The effect of age on normal values of the Westergren sedimentation rate. J Clin Pathol 1964;17:292–3. [DOI] [PMC free article] [PubMed] [Google Scholar]
- [12].Bain BJ. Some influences on the ESR and the fibrinogen level in healthy subjects. Clin Lab Haematol 1983;5:45–54. [DOI] [PubMed] [Google Scholar]
- [13].Steinvil A, Shapira I, Arbel Y, et al. Determinants of the erythrocyte sedimentation rate in the era of microinflammation: excluding subjects with elevated C-reactive protein levels. Am J Clin Pathol 2008;129:486–91. [DOI] [PubMed] [Google Scholar]
- [14].Shearn M, Kang I. Effect of age and sex on the erythrocyte sedimentation rate. J Rheumatol 1986;13:297–8. [PubMed] [Google Scholar]
- [15].Bonora E, Kiechl S, Willeit J, et al. Metabolic syndrome: epidemiology and more extensive phenotypic description. Cross-sectional data from the Bruneck study. Int J Obes Relat Metab Disord 2003;27:1283–9. [DOI] [PubMed] [Google Scholar]
- [16].De Silva DA, Woon FP, Chen C, et al. Serum erythrocyte sedimentation rate is higher among ethnic South Asian compared to ethnic Chinese ischemic stroke patients. Is this attributable to metabolic syndrome or central obesity? J Neurol Sci 2009;276:126–9. [DOI] [PubMed] [Google Scholar]
- [17].Vallianou NG, Evangelopoulos AA, Panagiotakos DB, et al. Associations of acute-phase reactants with metabolic syndrome in middle-aged overweight or obese people. Med Sci Monit 2010;16:56–60. [PubMed] [Google Scholar]
- [18].Geffken DF, Cushman M, Burke GL, et al. Association between physical activity and markers of inflammation in a healthy elderly population. Am J Epidemiol 2001;153:242–50. [DOI] [PubMed] [Google Scholar]
- [19].Bermudez EA, Rifai N, Buring JE, et al. Relation between markers of systemic vascular inflammation and smoking in women. Am J Cardiol 2002;89:1117–9. [DOI] [PubMed] [Google Scholar]
- [20].Roseman C, Truedsson L, Kapetanovic MC. The effect of smoking and alcohol consumption on markers of systemic inflammation, immunoglobulin levels and immune response following pneumococcal vaccination in patients with arthritis. Arthritis Res Ther 2012;14:R170. [DOI] [PMC free article] [PubMed] [Google Scholar]
- [21].Das SK, Mukherjee S, Vasudevan DM, et al. Comparison of haematological parameters in patients with non-alcoholic fatty liver disease and alcoholic liver disease. Singapore Med J 2011;52:175–81. [PubMed] [Google Scholar]
- [22].Myrhed M, Berglund L, Böttiger LE. Alcohol consumption and hematology. Acta Med Scand 1977;202:11–5. [DOI] [PubMed] [Google Scholar]
- [23].Natali A, Abbate AL, Ferrannini E. Erythrocyte sedimentation rate, coronary atherosclerosis, and cardiac mortality. Eur Heart J 2003;24:639–48. [DOI] [PubMed] [Google Scholar]
- [24].Siemons L, Ten Klooster PM, Vonkeman HE, et al. How age and sex affect the erythrocyte sedimentation rate and C-reactive protein in early rheumatoid arthritis. BMC Musculoskelet Disord 2014;15:368–74. [DOI] [PMC free article] [PubMed] [Google Scholar]
- [25].Gual A, Martos AR, Lligona A, et al. Does the concept of a standard drink apply to viticultural societies? Alcohol Alcohol 1999;34:153–60. [DOI] [PubMed] [Google Scholar]
- [26].Expert Panel on Detection, Evaluation and Treatment of High Blood Cholesterol in Adults. Executive Summary of Third Report of the National Cholesterol Education Program (NCEP) Expert Panel on Detection, Evaluation, and Treatment of High Blood Cholesterol in Adults (Adult Treatment Panel III). JAMA 2001;285:2486–97. [DOI] [PubMed] [Google Scholar]
- [27].Román-Viñas B, Lourdes Ribas-Barba L, Ngo J, et al. Validity of the international physical activity questionnaire in the Catalan population (Spain) [in Spanish]. Gac Sanit 2013;27:254–7. [DOI] [PubMed] [Google Scholar]
- [28].Craig CL, Marshall AL, Sjostrom M, et al. International physical activity questionnaire: 12-country reliability and validity. Med Sci Sports Exerc 2003;35:1381–95. [DOI] [PubMed] [Google Scholar]
- [29].Ajubi NE, Bakker AJ, van den Berg GA. Determination of the length of sedimentation reaction in blood using the TEST 1 system: comparison with the Sedimatic 100 method, turbidimetric fibrinogen levels, and the influence of M-proteins. Clin Chem Lab Med 2006;44:904–6. [DOI] [PubMed] [Google Scholar]
- [30].Rigby RA, Stasinopoulos DM. Generalized additive models for location, scale and shape (with discussion). Appl Statist 2005;54:507–54. [Google Scholar]
- [31].Eiler P, Marx B. Flexible smoothing with B-splines and penalties (with comments and rejoinder). Stat Sci 1996;11:89–121. [Google Scholar]
- [32].van Buuren S, Fredriks M. Worm plot: a simple diagnostic device for modelling growth reference curves. Stat Med 2001;20:1259–77. [DOI] [PubMed] [Google Scholar]
- [33].Stasinopoulos DM, Rigby RA. Generalized additive models for location scale and shape (GAMLSS) in R. J Stat Softw 2007;23:1–43. [Google Scholar]
- [34].Sykes WO. Erythrocyte sedimentation rate: the effect of alcohol as contaminant. BMJ 1948;1:393–4. [DOI] [PMC free article] [PubMed] [Google Scholar]
- [35].Albert MA, Glynn RJ, Ridker PM. Alcohol consumption and plasma concentration of C-reactive protein. Circulation 2003;107:443–7. [DOI] [PubMed] [Google Scholar]
- [36].Imhof A, Froehlich M, Brenner H, et al. Effect of alcohol consumption on systemic markers of inflammation. Lancet 2001;357:763–7. [DOI] [PubMed] [Google Scholar]
- [37].Kloner RA, Rezkalla SH. To drink or not to drink? That is the question. Circulation 2007;116:1306–17. [DOI] [PubMed] [Google Scholar]
- [38].Mukamal KJ, Jensen MK, Grønbaek M, et al. Drinking frequency, mediating biomarkers, and risk of myocardial infarction in women and men. Circulation 2005;112:1406–13. [DOI] [PubMed] [Google Scholar]
- [39].Campos J, Gonzalez-Quintela A, Quinteiro C, et al. The -159C/T polymorphism in the promoter region of the CD14 gene is associated with advanced liver disease and higher serum levels of acute-phase proteins in heavy drinkers. Alcohol Clin Exp Res 2005;29:1206–13. [DOI] [PubMed] [Google Scholar]
- [40].Naranjo A, Toloza S, Guimaraes da Silveira I, et al. Smokers and non smokers with rheumatoid arthritis have similar clinical status: data from the multinational QUEST-RA database. Clin Exp Rheumatol 2010;28:820–7. [PubMed] [Google Scholar]
- [41].Rawson ES, Freedson PS, Osganian SK, et al. Body mass index, but not physical activity, is associated with C-reactive protein. Med Sci Sports Exerc 2003;35:1160–6. [DOI] [PubMed] [Google Scholar]
- [42].Pinto A, Di Raimondo D, Tuttolomondo A, et al. Effects of physical exercise on inflammatory markers of atherosclerosis. Curr Pharm Des 2012;18:4326–49. [DOI] [PubMed] [Google Scholar]


