

Abstract
The development and normal function of prostate tissue depends on signalling interactions between stromal and epithelial compartments. Development of a prostate microtissue composed of these two components can help identify substance exposures that could cause adverse effects in humans as part of a non-animal risk assessment. In this study, prostate microtissues composed of human derived stromal (WPMY-1) and epithelial (RWPE-1) cell lines grown in scaffold-free hydrogels were developed and characterized using immunohistochemistry, light microscopy, and qRT-PCR. Within 5 days after seeding, the microtissues self-organized into spheroids consisting of a core of stromal WPMY-1 cells surrounded by epithelial RWPE-1 cells. The RWPE-1 layer is reflective of intermediate prostatic epithelium, expressing both characteristics of the luminal (high expression of PSA) and basal (high expression of cytokeratins 5/6 and 14) epithelial cells. The response of the microtissues to an androgen (dihydrotestosterone, DHT) and an anti-androgen (flutamide) was also investigated. Treatment with DHT, flutamide or a mixture of DHT and flutamide indicated that the morphology and self-organization of the microtissues is androgen dependent. qRT-PCR data showed that a saturating concentration of DHT increased the expression of genes coding for the estrogen receptors (ESR1 and ESR2) and decreased the expression of CYP1B1 without affecting the expression of the androgen receptor. With further development and optimization RWPE-1/WPMY-1 microtissues can play an important role in non-animal risk assessments.
1. INTRODUCTION
The risk assessment of endocrine active chemicals (EACs) relies heavily on the use of in vitro screening tests for endocrine activity. Most in vitro tests for endocrine activity are based on detecting a biological response (e.g. transcriptional activation) that may or may not lead to an adverse response in vivo. Assays that provide a functional response to endocrine active chemicals (e.g. inhibition of steroidogenesis) most often use two-dimensional (2D) culture systems that are not necessarily representative of the biology of normal endocrine sensitive tissues in vivo. These in vitro data are used to prioritize chemicals for subsequent in vivo testing, with the aim of identifying whether the observed endocrine activity gives rise to any adverse effects, and to characterize the dose-response of any effects seen. The need to generate these confirmatory animal data is therefore driven in part by limitations of the existing reductionist in vitro systems, which cannot differentiate between endocrine activity and adversity in a physiologically-relevant way (Dent et al., 2015).
The desire to reduce and to ultimately end the use of animal safety assessments has placed increased emphasis on the development of in vitro systems that are more representative of in vivo biology. It has long been accepted that three-dimensional (3D) cultures have the potential to improve the physiological relevance of in vitro experiments and to provide data that are more reflective of tissue responses in whole organisms (Pampaloni, Reynaud and Stelzer, 2007). The development of a non-animal approach to the risk assessment of EACs therefore requires the development of 3D cell cultures of endocrine-sensitive tissues and identification of molecular and morphological biomarkers that are reflective of perturbed functioning of that tissue in the whole organism. Our ambition is to use these tools in an exposure-led safety assessment to enable robust safety decision making for EACs without use of animals.
The development of the prostate is under influence of the hypothalamus-pituitary-gonadal axis that may be affected by exposure to androgens and anti-androgens, and development of an in vivo-like microtissue model representing the normal prostate microenvironment would greatly advance our ability to perform non-animal risk assessments for EACs. Because the development and function of the prostate is dependent on the close interaction between stromal and epithelial cells (Hayward, Rosen and Cunha, 1997), physiologically-relevant 3D cultures of prostate cells require both cell types to be present. Furthermore, androgenic stimulation of the stroma is an important trigger for development of the epithelium during organogenesis (Cunha, Donjacour and Sugimura, 1986; Peng and Joyner, 2015). We therefore developed a 3D co-culture prostate microtissue model composed of commercially-available epithelial (RWPE-1) and stromal (WPMY-1) cell lines. The RWPE-1 cell line was established from normal human prostate epithelial cells which were immortalized with human papillomavirus 18, and expresses both androgen receptor (AR) and prostate specific antigen (PSA) (Bello et al., 1997). The WPMY-1 myofibroblast cell line was derived from the same prostate, and immortalized with the SV40 large-T antigen (Webber et al., 1999). The objectives of this work are to: 1) assess whether RWPE-1 and WPMY-1 cells form microtissues when grown in scaffold-free hydrogels, 2) investigate the characteristics and function of the resulting microtissues using different molecular and imaging techniques, and 3) evaluate the response of this prostate co-culture model to androgenic and anti-androgenic responses.
2. MATERIALS AND METHODS
2.1. Cell Culture
RWPE-1 and WPMY-1 cells were obtained from ATCC (CRL-11609 and CRL-2854 respectively). RWPE-1 cells were maintained in keratinocyte serum free medium (K-SFM) supplemented with 0.05 mg/ml bovine pituitary extract (BPE) and 5 ng/ml epidermal growth factor (EGF). WPMY-1 cells were maintained in Dulbecco’s Modified Eagle’s Medium (DMEM) supplemented with 5% fetal bovine serum (FBS), 1 mM sodium pyruvate, 4 mM L-glutamine and 1% penicillin streptomycin. Medium was changed every 2-3 days. Co-cultures were seeded at an equal ratio of the cell types and grown in a 1:1 mixture of K-SFM andDMEM, containing 2.5% FBS, 0.025 mg/ml BPE and 2.5 ng/ml EGF, 0.5 mM sodium pyruvate, 2 mM L-glutamine, and 0.5% penicillin streptomycin. A lower level of serum (1.25%) which was charcoal stripped was used in experiments where androgenic (DHT) or anti-androgenic (flutamide) test substances were administered to reduce interference from background hormonal stimulation. Cells were grown in an incubator at a temperature of 37°C at 5% CO2.
2.2. 3D culture methods
Hydrogels containing 2% agarose were cast from a 12-256 Small Spheroid mould from Microtissues Inc., RI, USA and placed into 12-well tissue culture plates. In the initial characterization, cells were seeded at a total density of 3×10⁵ cells/ml (approx. 222 cells/microtissue, 1:1 ratio of each cell type) and cultured for 7-days. Medium was changed every 2-3 days. Cells were seeded at a total density of 6×10⁵ cells/ml (approx. 445 cells/microtissue, 1:1 ratio of cell type) for 4-days.
2.3. Treatment with dihydrotestosterone (DHT) and flutamide
The response of microtissues to exposure to (anti-)androgenic substances was assessed by exposing the microtissues to DHT (Sigma, A8380) or flutamide (Sigma, F9397) in DMSO to achieve final concentrations in media of 10 nM or 10 μM respectively, and to a 1:1 mixture of these treatments for 4-days. Control microtissues were cultured for the same duration in plain medium containing the same concentration of DMSO (0.1%) as the treated microtissues. The treatment concentrations were selected to represent a saturating concentration of the ligand and the antagonist. Furthermore, 10 nM DHT is similar to the tissue concentration of DHT in cases of benign prostatic hypertrophy (Titus et al., 2005)
2.4. Live cell imaging
Cell imaging was performed using a Perkin Elmer Opera Phenix™ high content imaging system. To enable the organization of the microtissue to be monitored over time, each cell line was tagged with a different fluorescent tracer. WPMY-1 cells were tagged with a green tracer (Life Technologies C7025) and RWPE-1 cells with a red tracer (Life Technologies C34552). Confocal images were collected following treatment with DHT, flutamide or DHT+flutamide over consecutive days.
2.5. Immunohistochemistry
Immunohistochemistry (IHC) was performed to see if the proteins expressed in the microtissues reflected their expression in normal prostate tissue. To characterize protein expression agarose hydrogels containing microtissues were fixed in 70% ethanol for at least 24-hours. The gels were then embedded in paraffin, sectioned at 5 μm and mounted on glass slides. Slides were stained with hematoxylin and eosin (H&E) or subjected to immunohistochemical staining. After sections were de-paraffinized and hydrated antigen retrieval was performed for cytokeratins (CK) by steaming for 20 minutes in Tris/EDTA buffer composed of 1.21 g Trizma® base (Sigma T1503) and 0.37g EDTA (Sigma E5134) in 1L purified water. Sections were then incubated with an Avidin/Biotin Block Kit (Vector Laboratories SP-2100) according to the manufacturer’s instructions and blocked in 10% goat serum (Sigma G9023), 1% bovine serum albumin (BSA) (Sigma A2153) in a solution of 0.05% Tween 20 (Sigma P9416) in physiologically buffered saline (PBS-T) for 20-minutes. Slides were incubated for 1-hour at room temperature with the appropriate antibody diluted in blocking solution at the following concentrations: Anti-CK5/6 (Dako M7237 at 1:100); Anti-CK8 (Sigma SAB5500133 at 1:50); Anti-CK14 (Sigma SAB5500124 at 1:250); Anti-CK18 (Dako M7010 at 1:50); Anti-CK19 (Dako M0888 at 1:100); Anti-vimentin (Sigma V6630 at 1:40). Following washes in PBS-T, samples were incubated with the appropriate biotinylated secondary antibody (either goat anti-mouse IgG (Sigma B0529) or goat anti-rabbit (Sigma B8895)) for 1-hour at room temperature and subsequent incubation with Avidin/Biotin Peroxidase Complex Kit (Vector Laboratories PK-6100) as per manufacturer’s instructions. Antibody expression was detected using the DAB Kit (Vector Laboratories SK-4100), sections were counterstained with hematoxylin, cleared and coverslipped. Where timepoints or treatments are compared, staining was conducted under the same conditions at on the same day. For interpretation of morphology, an estimate of the ratio of epithelium to stromal cells was used.
2.6. Gene expression
The expression of selected genes was evaluated in the microtissues over time, and the effect of treatment with DHT, flutamide or a mixture of DHT and flutamide on their relative expression was explored. These included genes coding for the androgen receptor (AR), estrogen receptor 1 and 2 (ER-α and ER-β) and cytochrome p450 1B1 (CYP1B1), a potential biomarker for the development of prostate cancer (Ragavan et al., 2004; Chang et al., 2017). Each quantitative real-time PCR (qRT-PCR) experiment consisted of 4 biological replicates (independent experiments) to ensure data reproducibility. Microtissues were co-cultured at a 1:1 ratio at an initial density of 6×10⁵ cells/ml in medium containing unstripped serum for 3, 5 or 7 days to assess gene expression over time. To assess the effects of treatment with DHT or flutamide, microtissues were co-cultured at a 1:1 ratio at an initial density of 6×10⁵ cells/ml in medium containing stripped serum and either DHT (10 nM), flutamide (10 μM), DHT+flutamide or control medium for 4 days. Microtissues were collected from hydrogels, pelleted and homogenized in Buffer RLT using 0.15 mm Zirconium Oxide Beads in the Bullet Blender Storm (Next Advance). RNA was then isolated using the RNeasy Mini Kit (Qiagen) per manufacturer’s instructions. For use in qRT-PCR, cDNA was made using the RT2 First Strand Kit (Qiagen) per manufacturer’s instructions. qRT-PCR was performed using RT2 SYBR Green Rox qPCR Mastermix with RT2 qPCR Primer Assays (Qiagen) to determine expression levels of AR (PPH01016A), estrogen receptor 1 (ESR1, PPH01001A), estrogen receptor 2 (ESR2, PPH00992C), and CYP1B1 (PPH00435F) and normalized to ribosomal protein, large, P0 (RPLP0, PPH21138F) and β-actin (ACTB, PPH00073G) using RT2 qPCR Primer Assay (Qiagen). Plates were run on an Applied Biosystems ViiA 7 machine using cycling conditions recommended by the manufacturer. The mean CT for the target (ESR1, ESR2, AR CYP1B1) genes and the geometric mean CT for the endogenous control (RPLP0 and ACTB) genes was calculated for each of the 4 independent experiments and the meanCT for the endogenous controls was subtracted from the mean CT for each target gene within each experiment to give the Δ Mean. For timecourse experiments, the ΔCt Mean at days 5 or 7 were subtracted from the ΔCt Mean at day 3 to provide the ΔΔCt for that gene at each timepoint. For the experiments using DHT and flutamide, the ΔCt Mean at each treatment (DHT, flutamide, or DHT+flutamide) was subtracted from the control (untreated) ΔCt Mean to provide the ΔΔCt for each treatment. Finally, the ΔΔCt values were raised to the power of 2 (2-ΔΔCt) to provide the fold change in the target gene at eachtimepoint relative to day 3, or each treatment relative to control. The mean of the 4 experiments was presented. Data were analysed in GraphPad Prism using an ordinary one-way analysis of variance (ANOVA) followed by a multiple comparison test. Tukey’s multiple comparison test was performed for the timecourse experiment (every timepoint vs. every other timepoint). For the DHT and flutamide experiment, Dunnett’s multiple comparison test (each treatment vs. control) was performed.
3. RESULTS
Time-course experiments were conducted using medium containing normal (unstripped) FBS, to monitor the development of the microtissues at 3, 5 and 7 days after seeding. Assessments on days 3, 5 and 7 included morphology by confocal imaging and light microscopy, the expression of selected proteins using IHC, and qRT-PCRto monitor the expression of selected genes over time. Following this initial characterization, a set of further experiments was conducted in which microtissues were grown in medium containing charcoal stripped FBS to remove background androgenic signals, and the response of the microtissues to treatment for 4 days with an androgen (DHT), an anti-androgen (flutamide) or a mixture of DHT+flutamide was assessed using the same evaluations.
3.1. Morphology of untreated RWPE-1/WPMY-1 prostate microtissues
After seeding in either medium containing standard or stripped FBS, the cells settled to the bottom of the recesses in the agarose gels (256 recesses per well) and self-assembled into spheroids over the course of 24-hours. Confocal imaging showed untreated spheroids at early timepoints (up to 3 days) comprised a core of epithelial RWPE-1 cells adjacent to or surrounded by stromal WPMY-1 cells (Figure 1A). By Day 5 after seeding, the untreated microtissues self-organized with a high proportion of spheroids consisting of an inner core of WPMY-1 cells surrounded by RWPE-1 cells (Figure 1B). As the microtissues develop there is persistent arrangement of the epithelium on the surface of the mesothelium, with increased squamous metaplasia as the specimen ages (Figure 2). The epithelium:stroma ratio of 1:1 was maintained throughout the culture period. By day 5 scattered pyknotic nuclei were apparent in the stromal cells at the core of the microtissue, indicating cell death in this population of cells (Figure 2B). By day 7 after seeding microtissues were approximately 200 μm in diameter with a stromal core composed of both viable cells and nuclear debris indicative of cell loss (Figure 2C). At day 7, in some instances, clusters of stromal cells not surrounded by epithelial cells were present and appeared viable (see Supplementary Figure S2 for representative micrographs).
Figure 1.
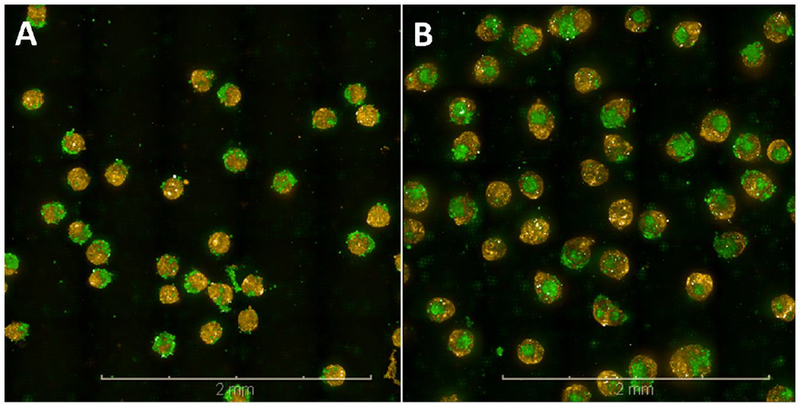
Confocal images of prostate co-culture microtissues. The co-cultures of epithelial RWPE-1 cells (yellow) and stromal WPMY-1 cells (green) were grown in medium containing charcoal-stripped serumfor 3 (A) or 5 (B) days and undergo a spontaneous re-arrangement so that by day 5 most microtissues consist of acore of WPMY-1 cells surrounded by RWPE-1 cells. Scale bar = 2 mm.
Figure 2.
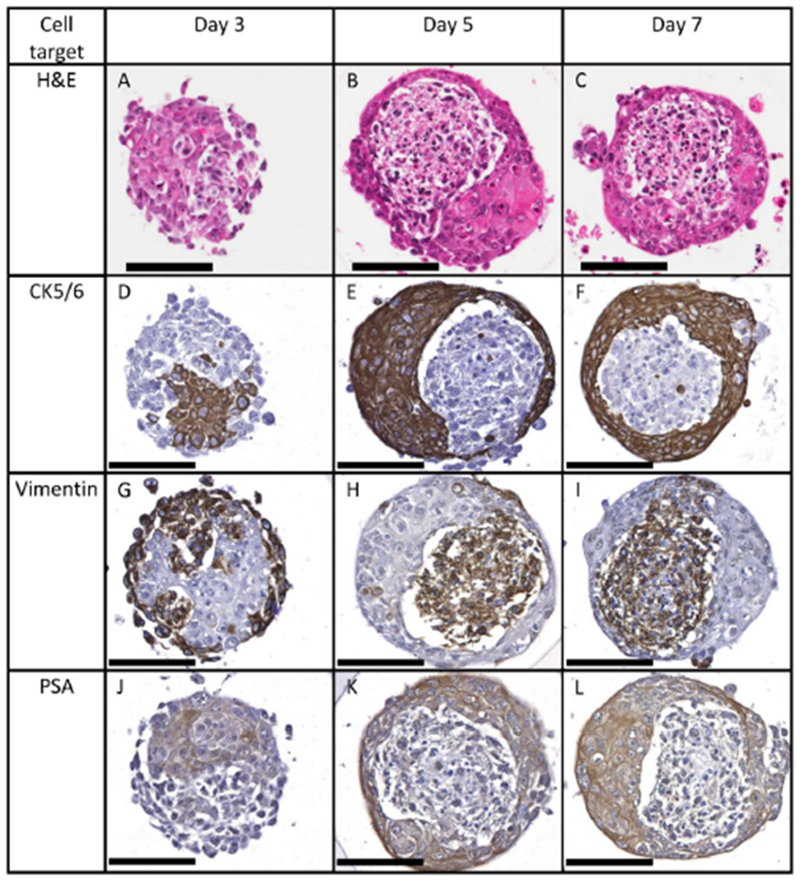
RWPE-1 cells in microtissue co-cultures grown in medium containing charcoal-stripped serum for 3, 5 or 7 days express CK5/6 (D-F) and PSA (J-L), while WPMY-1 cells express vimentin (G-I). The distribution of these markers confirms the spontaneous rearrangement of the microtissues over 5 days. By day 5 stromal cells show pyknotic nuclei (B). Scale bar = 100 μm.
3.2. Immunohistochemistry of untreated prostate microtissues
IHC was performed to assess whether proteins expressed by the microtissues were reflective of normal human prostate tissue and to differentiate between the WPMY-1 and RWPE-1 cells. Proteins detected using IHC are listed in Table 1, and representative micrographs are included in the Supplementary Material. Of the cytokeratins (CKs) assessed, CK5/6 and CK14 were the most expressed in cuboidal epithelial cells, whereas the isolated cells staining for CK8 or 18 appeared squamous and were found on the surface of the microtissues. Expression of CK5/6 and vimentin provided strong markers to differentiate RWPE-1 and WPMY-1 cells respectively (Figure 2)
Table 1:
Protein expression in prostate microtissues
| Protein | RWPE-1 cells | WPMY-1 cells |
|---|---|---|
| CK5/6 | ++ | − |
| CK8 | + | − |
| CK14 | ++ | − |
| CK18 | + | − |
| CK19 | + | − |
| PSA | ++ | − |
| Vimentin | − | ++ |
protein not detected
low level detected
high level detected
3.3. Gene expression in untreated microtissues
Expression of AR and CYP1B1 genes were stable over 7-days in medium containing unstripped serum, while ESR1 and ESR2 gene expression increased over this period (Figure 3).
Figure 3.
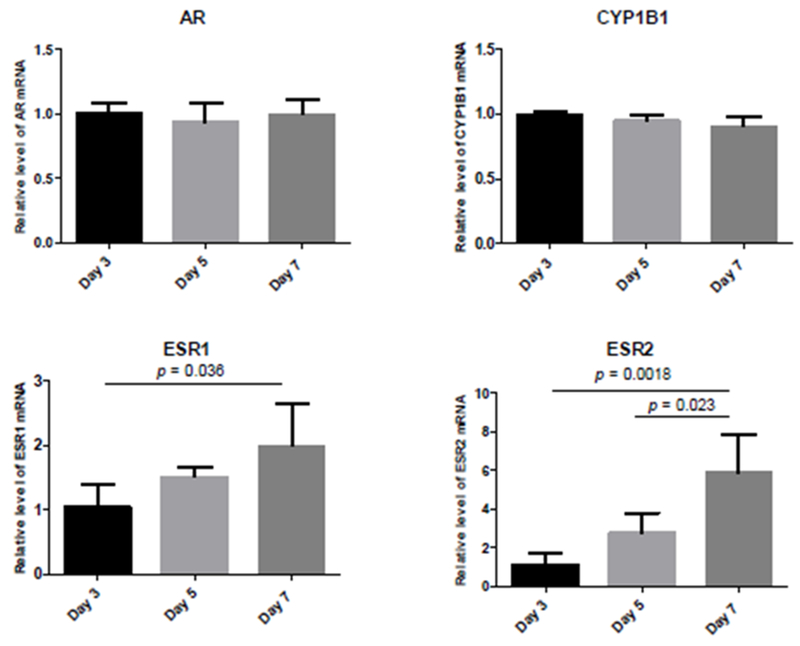
qRT-PCR in microtissue co-cultures grown in medium containing normal serum for 3, 5 or 7 days. Expression of AR and CYP1B1 are stable over 7 days, whist ESR1 and ESR2 expression increases over time. Data represent 4 independent experiments. Error bars show standard deviation. p value = Tukey’s multiple comparisons test.
3.4. Effects oftreatment with androgens and anti-androgens on morphology, protein and gene expression
Microtissues were seeded (day 0) and continually treated with flutamide (10 μM), DHT (10 nM), or flutamide+DHT (10 μM+10 nM respectively) to assess the androgen responsiveness of the microtissues. The assessments on treated tissues were conducted at day 4 after seeding, representing a time when the microtissues had self-organized and contained a viable stromal core.
The predominant arrangement in the DMSO control group was of a single stromal core of WPMY-1 cells surrounded by an epithelial layer of RWPE-1 cells, as demonstrated by IHC and confocal imaging (Figures 4A and 4B). Treatment with flutamide resulted in an increase in microtissues with fragmented stromal cores and an increase in the proportion of epithelial cells (Figures 4C and 4D). Treatment with DHT alone did not cause an appreciable change in the cellular morphology or the arrangement of stromal and epithelial cells compared with control (Figures 4E and 4F). Treatment with DHT+flutamide resulted in an irregular and ill-formed microtissue, including an increased incidence of spheroids consisting of an epithelial core surrounded by stromal cells, and an increase in the proportion of epithelial cells (Figures 4G and 4H). The day 4 flutamide+DHT microtissues showed an arrangement that was similar to the day 3 control microtissues (compare Figures 5D,5H,5L and 5P with Figures 2A, 2D, 2G and 2J respectively).
Figure 4.
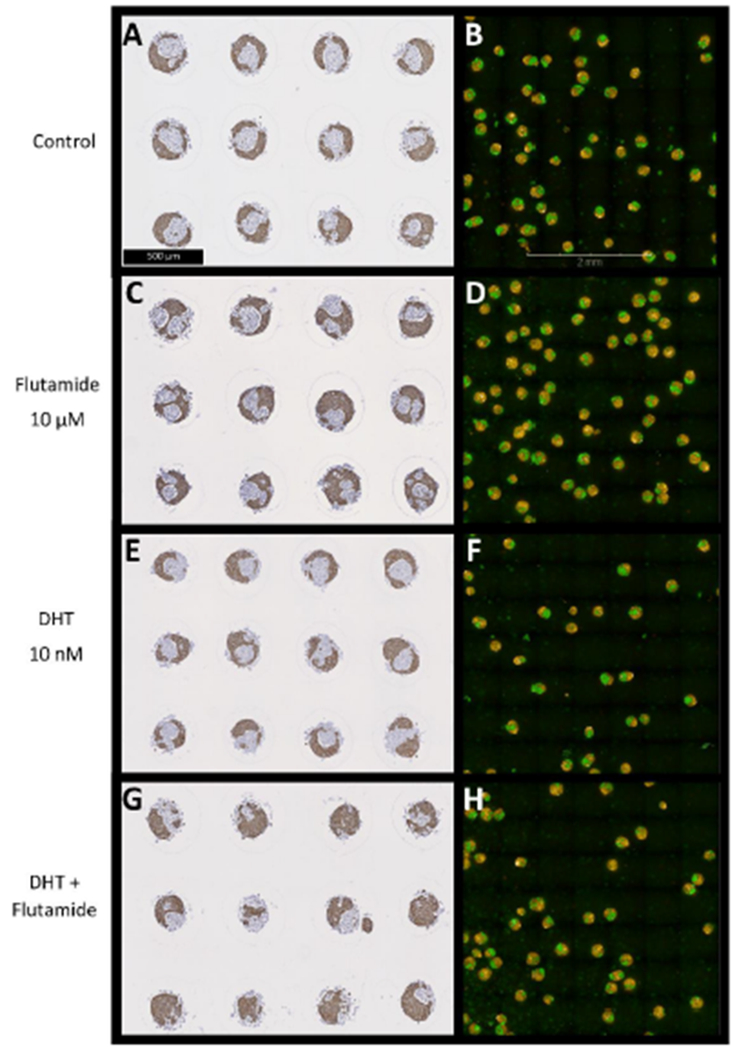
Immunohistochemical staining for CK5/6 (A, C, E, G) and confocal images (B, D, F, H) of prostate microtissue co-cultures. Prostate microtissues were exposed for 4 days to flutamide (C, D), DHT (E, F), or DHT+flutamide (G, H). Flutamide causes an increased incidence of fragmented cores of WPMY-1 cells (green in confocal images) compared with control and DHT, whilst DHT+flutamide causes fewer microtissues with clearly defined WPMY-1 cores, and in many cases the core consists of RWPE-1 cells (yellow in confocal images).
Figure 5.
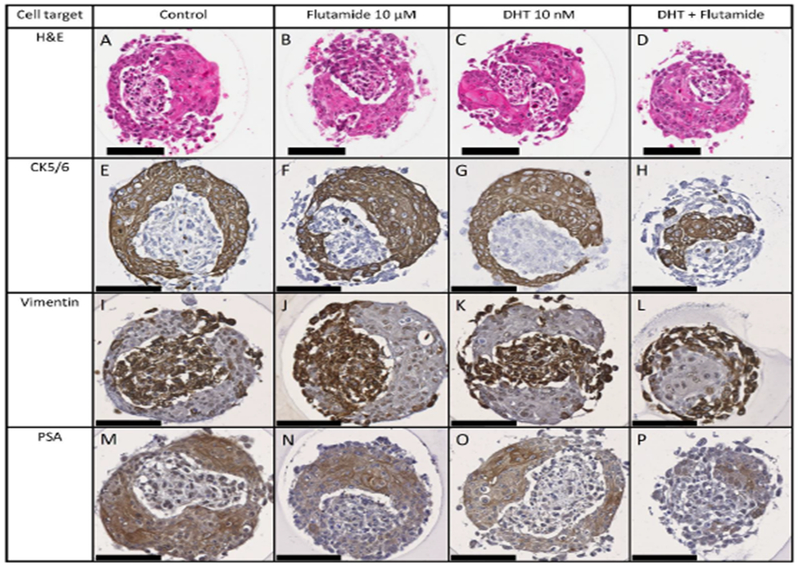
Expression of CK5/6 (E-H) vimentin (I-L), and PSA (M-P) in co-cultures exposed to flutamide (B, F, J, N), DHT (C, G, K, O), or DHT+flutamide (D, H, L, P) for 4 days. The distribution of IHC markers confirms that treatment with DHT+flutamide affects the arrangement of the cell types. Treatment results in variation in the PSA staining intensity with the highest staining in control, followed by DHT, followed by flutamide +/− DHT. Scale bar = 100 μm.
Microtissues treated with DHT, flutamide or DHT+flutamide continued to express PSA. Qualitatively the PSA staining intensity varied with treatment, with the highest staining in control, followed by DHT, followed by flutamide with or without DHT (Figure 5M to 5P). In addition, treatment with DHT+flutamide resulted in increased viability of the WPMY-1 stromal cells than either the control group or the individual treatments (Figure 5).
DHT treatment was associated with a >2 fold increase in both ESR1 and ESR2 gene expression at day 4, although only the ESR1 increase was significantly different to control (Figure 6). DHT was also associated with a significant decrease in CYP1B1 expression.
Figure 6.
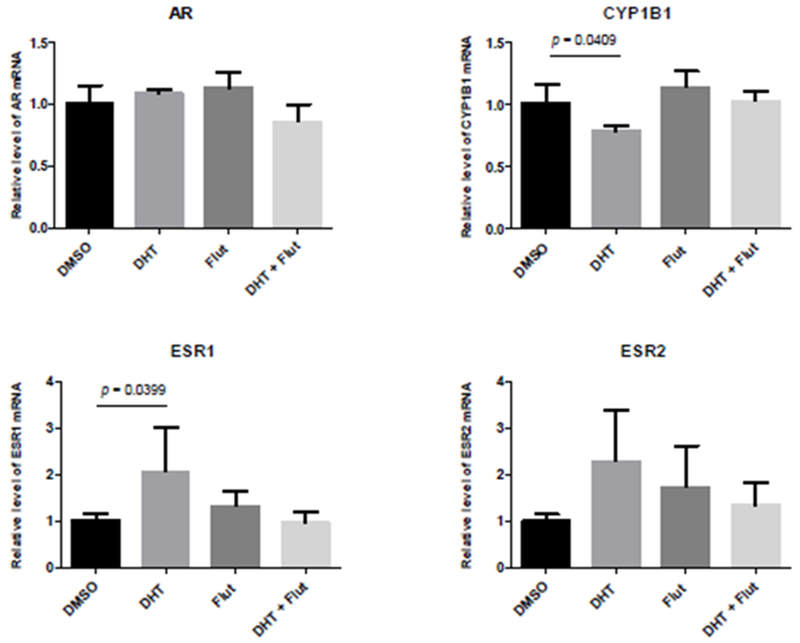
qRT-PCR in microtissue co-cultures exposed to DHT, flutamide, or DHT+flutamide for 4 days. DHT treatment resulted in significantly increased ESR1 expression and significantly decreased CYP1B1 expression. Data represent 4 independent experiments. Error bars show standard deviation. p value = Dunnett’s multiple comparisons test.
4. DISCUSSION
In healthy prostate tissue interactions between the stromal and epithelial compartments are necessary to maintain epithelial differentiation, highlighting the importance of the stroma to ensure a differentiated in vivo-like phenotype (Hayward, Rosen and Cunha, 1997). Furthermore, androgenic stimulation of the stroma is an important trigger for development of the epithelium during organogenesis (Cunha, Donjacour and Sugimura, 1986; Peng and Joyner, 2015). These observations led us to develop prostate microtissues composed of co-cultures of epithelial and stromal cell lines.
Normal human prostatic epithelium consists of a basal layer of flat to cuboidal non-secretory cells expressing CK5 and 14, upon which rests the luminal layer of cuboidal or pseudo-columnar cells expressing CK8 and 18 which secrete PSA into the prostatic acini (Gauntner and Prins, 2018). RWPE-1 and WPMY-1 cells seeded in agarose molds underwent spontaneous rearrangement to form spheroids consisting of a core of WPMY-1 (stromal) cells surrounded by RWPE-1 (epithelial) cells. The microtissues formed no ducts or acini but did secrete PSA.
During fetal and neonatal development the expression of CKs in the prostatic epithelium undergoes significant change, moving from a predominant expression of CKs 5 and 14 (associated with basal epithelium), towards expression of CKs 8 and 18 (associated with luminal epithelium) (Sherwood et al., 1991; Xue et al., 1998). The epithelial cell layer of our microtissues exhibited characteristics of both the basal and luminal epithelium of normal human prostate, comprising mostly of cuboidal or flattened cells with high expression of CK5/6 and CK14, low expression of CK8, 18 and 19, and over time, high expression of PSA. Several investigators have described such an ‘intermediate’ cell type in human prostatic epithelium which may develop into differentiated luminal cells (Sherwood et al., 1991; Bonkhoff, Stein and Remberger, 1994), and others have observed that the majority of prostate epithelial cells in culture show this intermediate phenotype (Festuccia et al., 2005). It therefore appears that the epithelial layer of RWPE-1/WPMY-1 co-cultures grown described here consist of intermediate cells, analogous to an early stage of prostate development.
These microtissues expressed PSA in medium containing stripped serum, representing a virtually androgen-free environment (Figure 2J–L). Previous studies of LNCaP cells in culture have suggested an ability of prostate cancer cells to auto-regulate the metabolism of testosterone to DHT to provide an optimal level of DHT for growth, even under castrate conditions (Sedelaar and Isaacs, 2009). Furthermore, RWPE-1 medium contains EGF, which can directly activate the AR in the absence of androgens (Culig et al., 1994). These are the two most likely reasons why the untreated microtissues in medium containing stripped serum continued to express PSA. Conversely, the observation that culture in 10 nM DHT resulted in microtissues that were histologically indistinct from control with minimal changes in AR gene expression may reflect that at this high concentration of DHT AR receptors are desensitized and no longer being up-regulated. Events at lower concentrations may therefore be very different.
The interesting observation that administration of flutamide or a combination of DHT and flutamide affected the morphology of the microtissues in different ways implies that the spontaneous arrangement of these microtissues is affected by androgenic signalling. Treatment with either flutamide or DHT+flutamide caused an increase in the proportion of epithelial to mesothelial cells present in the microtissues. This observation warrants further investigation of the epithelial/mesothelial ratio as a biomarker of effect for (anti-)androgens, providing a quantitative measure to identify substance exposures that alter the development of the microtissues compared with control. Treatment with DHT+flutamide resulted in microtissues at day 4 that resembled day 3 control microtissues, both in terms of the relative arrangement of the epithelial and stromal cells and lower relative expression of ESR1 and ESR2. This treatment therefore appeared to slow the development of the microtissue. Although DHT administration alone did not affect the arrangement or proportion of cells in the microtissue, it was associated with a 2-fold increase in ESR1 and ESR2 gene expression. The fact that co-administration of flutamide resulted in ESR1 and ESR2 gene expression levels similar to control suggests that the increased ESR1 and ESR2 gene expression seen with DHT was related to AR binding. There are inter-relationships between the functioning of AR and ESR1 and ESR2, and our results were consistent with previous studies in MCF-7 cells. These showed that administration of DHT counteracts the proliferative activity of estradiol, an effect which is reversed by coadministration with the flutamide metabolite hydroxyflutamide (Andò et al., 2002). DHT has been shown to not only bind to the ESR1, it also has inhibitory or stimulatory effects on the proliferation of breast cancer cell lines depending on the dose, cell line, and whether estradiol was present (Somboonporn and Davis, 2004; Lin et al., 2009). Taken together, the increased ESR1 and ESR2 gene expression was likely a response to AR-mediated suppression of estrogenic signalling. In breast cancer cell lines CYP1B1 expression is regulated by estradiol via ESR1 (Tsuchiya et al., 2004), which makes mechanistic sense because estradiol is a substrate for the CYP1B1 protein. The reduced CYP1B1 expression seen in our study was therefore likely due to the AR-mediated suppression of estrogenic signalling.
ESR1 is an oncogene in prostatic tissue and is expressed in stromal cells and in the basal epithelium. ESR2 is a tumour suppressor gene which tends to be localised in luminal epithelial cells, and undergoes substantial loss in castration resistant prostate cancer (Bonkhoff, 2018). A change in the relative expression of these genes could therefore provide predictive biomarkers for the development of prostate cancer. Similarly, CYP1B1 is expressed at much higher levels in prostate tumours compared with benign tissue (Ragavan et al., 2004), and is also over-expressed in prostate cancer cell lines compared with RWPE-1 cells (Chang et al., 2017). These genes may therefore also be useful biomarkers to assess the transition from an adaptive to an adverse response to xenobiotics.
The decreased viability of the WPMY-1 cells after 4 days of culture in this system is a significant limitation. Optimization of culture conditions is therefore required to establish whether extended period in culture with a viable stromal compartment would increase the proportion of epithelial cells more reflective of a differentiated luminal phenotype. The WPMY-1 cells at the core of the microtissues were less viable than those on the outside (see Supplementary Materials for micrographs). Necrosis at the center of larger (>200μm) spheroids due to hypoxia is a well described phenomenon (Däster et al., 2017). However, because poor viability was apparent in areas very close to the outside edge of our microtissues and not just at the center this does not seem a likely cause. Mechanical stress upon core cells in spheroids grown in agarose molds has also been reported (Cheng et al., 2009), but again this appears to affect much larger microtissues. It is unclear whether the WMPY-1 cells at the core of the microtissue showed poor viability because they were enclosed by the RWPE-1 cells or were enclosed because they were showing poor viability. Although the order of events is not yet clear, it does appear that the viability of WPMY-1 cells in co-culture relies on a specific level of androgenic stimulation, because co-administration of DHT and flutamide resulted in improved viability of these cells at day 4.
In summary, RWPE-1 and WPMY-1 cells formed microtissues when grown in scaffold-free hydrogels. The proteins detected by immunohistochemistry indicated that the microtissues reflected an early stage of human prostate development. Morphological and molecular biomarkers including the arrangement of the stromal and epithelial compartments, expression of PSA, and gene expression showed that the microtissues were responsive to androgens and anti-androgens. Long-term viability of the WPMY-1 cells in co-culture relies on a specific level of androgenic stimulation, and future work will include a dose-response study with a broad range of DHT concentrations to test this hypothesis. The utility of the biomarkers described will also further be investigated, in particular, the use of automated confocal microscopy using the Opera Phenix system to provide quantitative readouts of cellular distribution and morphology.
5. CONCLUSION
For a prostate microtissue to be useful in non-animal next generation risk assessment, it needs to be able to bridge the gap between in vitro studies providing a readout of ‘endocrine activity’ (e.g. transcriptional activation) and in vivo studies which characterize apical outcomes (i.e. observed pathology). To do this requires the development of a human-relevant microtissue and the identification of molecular and morphological biomarkers that are predictive of adverse effects. With further development and optimization RWPE-1/WPMY-1 microtissues can play an important role in non-animal risk assessments.
Supplementary Material
Figure S1. Cytokeratin expression in microtissue co-cultures grown in complete medium for 3, 5 or 7 days. Predominant CK expression is CK5/6 and CK14. Few, scattered cells show staining for CKs 8, 18 or 19. Scale bar = 100 μm.
Figure S2. Microtissues grown in medium containing stripped serum for 7 days and stained for CK5/6 expression. WPMY-1 cells on the outside of microtissues show improved survival compared with those in the core at 7 days after seeding. Scale bar = 100 μm.
HIGHLIGHTS.
Non-animal risk assessment requires innovative cellular models representative of human biology
RWPE-1 and WPMY-1 cells form microtissues when grown in scaffold-free hydrogels
Microtissues represent an early stage of human prostate development
Morphological and molecular biomarkers are responsive to androgens/anti-androgens
6. ACKNOWLEDGEMENTS
Thanks to the teams both at Brown and Unilever for stimulating discussions and technical advice, especially Daniel Spade (Brown) and Iris Muller (Unilever), and to Donna McGraw Weiss ‘89 and Jason Weiss for their generous gift. This work was funded by a Bioengineering Research Partnership grant (U01 ES028184) from the National Institute of Environmental Health Sciences and by Unilever as part of Unilever’s ongoing effort to develop new ways of assuring consumer safety.
Footnotes
Publisher's Disclaimer: This is a PDF file of an unedited manuscript that has been accepted for publication. As a service to our customers we are providing this early version of the manuscript. The manuscript will undergo copyediting, typesetting, and review of the resulting proof before it is published in its final citable form. Please note that during the production process errors may be discovered which could affect the content, and all legal disclaimers that apply to the journal pertain.
6. REFERENCES
- Andò S et al. (2002) ‘Breast cancer: from estrogen to androgen receptor’, Molecular and Cellular Endocrinology. Elsevier, 193(1-2), pp. 121–128. doi: 10.1016/S0303-7207(02)00105-3. [DOI] [PubMed] [Google Scholar]
- Bello D et al. (1997) ‘Androgen responsive adult human prostatic epithelial cell lines immortalized by human papillomavirus 18.’, Carcinogenesis, 18(6), pp. 1215–23. [DOI] [PubMed] [Google Scholar]
- Bonkhoff H (2018) ‘Estrogen receptor signaling in prostate cancer: Implications for carcinogenesis and tumor progression’, The Prostate, 78(1), pp. 2–10. doi: 10.1002/pros.23446. [DOI] [PubMed] [Google Scholar]
- Bonkhoff EL, Stein U and Remberger K (1994) ‘Multidirectional differentiation in the normal, hyperplastic, and neoplastic human prostate: simultaneous demonstration of cell-specific epithelial markers.’, Human pathology, 25(1), pp. 42–6. [DOI] [PubMed] [Google Scholar]
- Chang I et al. (2017) ‘Cytochrome P450 1B1 inhibition suppresses tumorigenicity of prostate cancer via caspase-1 activation.’, Oncotcirget. Impact Journals, LLC, 8(24), pp. 39087–39100. doi: 10.18632/oncotarget.16598. [DOI] [PMC free article] [PubMed] [Google Scholar]
- Cheng G et al. (2009) ‘Micro-Environmental Mechanical Stress Controls Tumor Spheroid Size and Morphology by Suppressing Proliferation and Inducing Apoptosis in Cancer Cells’. PLoS ONE. 4(2). p. e4632. doi: 10.1371/journal.pone.0004632. [DOI] [PMC free article] [PubMed] [Google Scholar]
- Culig Z et al. (1994) ‘Androgen receptor activation in prostatic tumor cell lines by insulin-like growth factor-I, keratinocyte growth factor, and epidermal growth factor.’, Cancer research, 54(20), pp. 5474–8. [PubMed] [Google Scholar]
- Cunha GR,Donjacour AA andSugimura Y (1986) ‘Stromal–epithelial interactions and heterogeneity of proliferative activity within the prostate’, Biochemistry and Cell Biology, 64(6), pp. 608–614. doi: 10.1139/o86-084. [DOI] [PubMed] [Google Scholar]
- Däster S et al. (2017) ‘Induction of hypoxia and necrosis in multicellular tumor spheroids is associated with resistance to chemotherapy treatment.’, Oncotcirget, 8(1), pp. 1725–1736. doi: 10.18632/oncotarget.13857. [DOI] [PMC free article] [PubMed] [Google Scholar]
- Dent MP et al. (2015) ‘Towards a non-animal risk assessment for anti-androgenic effects in humans’, Environment International, 83, pp. 94–106. doi: 10.1016/j.envint.2015.06.009. [DOI] [PubMed] [Google Scholar]
- Festuccia C et al. (2005) ‘Epithelial and prostatic marker expression in short-term primary cultures of human prostate tissue samples.’, International journal of oncology, 26(5), pp. 1353–62. [PubMed] [Google Scholar]
- Gauntner TD and Prins GS (2018) ‘Prostate-Cell Biology and Secretion’. Encyclopedia of Reproduction Academic Press, pp. 325–333. doi: 10.1016/B978-0-12-801238-3.64372-6. [DOI] [Google Scholar]
- Hayward SW, Rosen MA and Cunha GR (1997) ‘Stromal-epithelial interactions in the normal and neoplastic prostate’. British Journal of Urology. 79(S2). pp. 18–26. doi: 10.1111/j.1464-410X1997.tb16917.x. [DOI] [PubMed] [Google Scholar]
- Lin H-Y et al. (2009) ‘Androgen-induced human breast cancer cell proliferation is mediated by discrete mechanisms in estrogen receptor-α-positive and-negative breast cancer cells’, The Journal of Steroid Biochemistry and Molecular Biology. Pergamon, 113(3-5), pp. 182–188. doi: 10.1016/J.JSBMB.2008.12.010. [DOI] [PubMed] [Google Scholar]
- Pampaloni F, Reynaud EG and Stelzer EHK (2007) ‘The third dimension bridges the gap between cell culture and live tissue’, Nature Reviews Molecular Cell Biology, 8,pp. 839–845. doi: 10.1038/nrm2236. [DOI] [PubMed] [Google Scholar]
- Peng Y-C and Joyner AL (2015) ‘Hedgehog signaling in prostate epithelial–mesenchymal growth regulation’, Developmental Biology, 400(1), pp. 94–104. doi: 10.1016/j.ydbio.2015.01.019. [DOI] [PMC free article] [PubMed] [Google Scholar]
- Ragavan N et al. (2004) ‘CYP1B1 expression in prostate is higher in the peripheral than in the transition zone’, Cancer Letters. Elsevier, 215(1), pp. 69–78. doi: 10.1016/J.CANLET.2004.06.051. [DOI] [PubMed] [Google Scholar]
- Sedelaar JPM and Isaacs JT (2009) ‘Tissue culture media supplemented with 10% fetal calf serum contains a castrate level of testosterone.’, The Prostate, 69(16), pp. 1724–9. doi: 10.1002/pros.21028. [DOI] [PMC free article] [PubMed] [Google Scholar]
- Sherwood ER et al. (1991) ‘Differential expression of specific cytokeratin polypeptides in the basal and luminal epithelia of the human prostate’. The Prostate. 18(4). pp. 303–314. doi: 10.1002/pros.2990180404. [DOI] [PubMed] [Google Scholar]
- Somboonporn W and Davis SR (2004) ‘Testosterone Effects on the Breast: Implications for Testosterone Therapy for Women’, Endocrine Reviews. Oxford University Press, 25(3), pp. 374–388. doi: 10.1210/er.2003-0016. [DOI] [PubMed] [Google Scholar]
- Titus MA et al. (2005) ‘Testosterone and dihydrotestosterone tissue levels in recurrent prostate cancer.’, Clinical cancer research : an official journal of the American Association for Cancer Research, 11(13), pp. 4653–7. doi: 10.1158/1078-0432.CCR-05-0525. [DOI] [PubMed] [Google Scholar]
- Tsuchiya Y et al. (2004) ‘Human CYP1B1 is regulated by estradiol via estrogen receptor.’, Cancer research, 64(9), pp. 3119–25. [DOI] [PubMed] [Google Scholar]
- Webber MM et al. (1999) ‘A human prostatic stromal myofibroblast cell line WPMY-1: a model for stromal-epithelial interactions in prostatic neoplasia.’, Carcinogenesis,20(7),pp. 1185–92. [DOI] [PubMed] [Google Scholar]
- Xue Y et al. (1998) ‘Identification of intermediate cell types by keratin expression in the developing human prostate.’, The Prostate, 34(4), pp. 292–301. [DOI] [PubMed] [Google Scholar]
Associated Data
This section collects any data citations, data availability statements, or supplementary materials included in this article.
Supplementary Materials
Figure S1. Cytokeratin expression in microtissue co-cultures grown in complete medium for 3, 5 or 7 days. Predominant CK expression is CK5/6 and CK14. Few, scattered cells show staining for CKs 8, 18 or 19. Scale bar = 100 μm.
Figure S2. Microtissues grown in medium containing stripped serum for 7 days and stained for CK5/6 expression. WPMY-1 cells on the outside of microtissues show improved survival compared with those in the core at 7 days after seeding. Scale bar = 100 μm.