Abstract
Purpose:
To enable simultaneous high-resolution mapping of brain function and metabolism.
Methods:
An encoding scheme was designed for interleaved acquisition of fMRI data in echo volume imaging (EVI) trajectories and MRSI data in echo-planar spectroscopic imaging (EPSI) trajectories. The scheme eliminates water and lipid suppression and utilizes FID signals to encode both functional and metabolic information with ultrashort TE, short TR, and sparse sampling of -space. A subspace-based image reconstruction method was introduced for processing both the fMRI and MRSI data. The complementary information in the fMRI and MRSI data sets was also utilized to improve image reconstruction in the presence of intra-scan head motion, field drift, and tissue susceptibility changes.
Results:
In vivo experimental results were obtained from healthy human subjects in resting-state fMRI/MRSI experiments. In these experiments, the proposed method was able to simultaneously acquire metabolic and functional information from the brain in high resolution. For scans of 6.5 minutes, we achieved 3.0×3.0×1.8 mm3 spatial resolution for fMRI, 1.9×2.5×3.0 mm3 nominal spatial resolution for MRSI, and 1.9×1.9×1.8 mm3 nominal spatial resolution for QSM (quantitative susceptibility maps).
Conclusion:
This work demonstrates the feasibility of simultaneous high-resolution mapping of brain function and metabolism with improved spatial resolution and synergistic image reconstruction.
Keywords: fMRI, ultrahigh-resolution MRSI, SPICE, QSM, partial separability, sparse sampling
1. INTRODUCTION
Since its inception in the early 1990s, functional MRI (fMRI) has been developed into a premier tool for neuroimaging, which measures blood oxygen level dependent (BOLD) signal changes related to brain activities (1–4). Complementary to fMRI, MR spectroscopic imaging (MRSI) can map the spatial distributions of brain metabolites and neurotransmitters without exogenous contrast agents and is a useful tool for studying brain metabolism (5–9).
Currently, fMRI and MRSI experiments are performed in two separate scans using different data acquisition schemes. Specifically, fMRI scans usually use gradient-echo based acquisitions to collect a sequence of -weighted images that capture the BOLD signal changes; such acquisitions typically require 8–10 minutes to achieve spatial and temporal resolutions on the orders of 3 mm and 3 sec, respectively (10,11). On the other hand, MRSI scans involve the acquisition of both spatial and spectral encodings, thus resulting in long acquisition times (on the order of 20 min) (9,12–14). Given these different characteristics of data acquisition for fMRI and MRSI experiments, it has been challenging to perform simultaneous fMRI and MRSI studies. Early efforts on joint fMRI/MRSI studies used separate fMRI and single-voxel fMRS scans to measure neurochemical changes related to neural activity (15–25). These studies produced encouraging experimental results indicating coupling between brain activity and neurochemical changes (15–25). However, single-voxel fMRS techniques suffer from several well-known practical limitations, including large voxel size (typically, 20×20×20 mm3) (19,26–28), which often results in significant spectral distortions and partial volume effects. Additionally, the acquisition of fMRI and fMRS data over different time intervals limits our ability to observe concurrent functional and metabolic signal changes.
To overcome these limitations of the existing fMRS techniques, we have developed a novel method for simultaneous high-resolution functional and metabolic imaging by leveraging our progress in ultrafast MRSI (29,30) and our success in achieving simultaneous QSM and MRSI (31). Independent of our work, Bridge et al. recently achieved simultaneous fMRI and MRS with the spectra collected from a single voxel with 20 mm isotropic voxel size (32). Posse et al. also reported their preliminary results in a joint fMRI/MRSI study by collecting fMRI data during the water suppression period of the MRSI scan; Posse’s method achieved 4×7×8 mm3 nominal spatial resolution for fMRI and 4×4×7 mm3 for MRSI data with a relatively small brain coverage (42 mm along the slice direction). Our proposed method achieves much higher resolution (3.0×3.0×1.8 mm3 for fMRI, 1.9×2.5×3.0 mm3 for MRSI, and 1.9×1.9×1.8 mm3 for QSM) with a larger brain coverage (FOV: 230×230×72 mm3). In addition, the proposed method utilizes the complementary information in the fMRI and MRSI data to improve image reconstruction in the presence of intra-scan head motion, field drift and susceptibility changes.
A more detailed description of our proposed method is given subsequently, followed by some representative experimental results to demonstrate the performance of the proposed method.
2. METHODS
2.1. Data Acquisition
The proposed data acquisition scheme is illustrated in Figs. 1–3. By eliminating water suppression often used in MRSI acquisitions, we can effectively interleave MRSI and fMRI acquisitions during the same time period. As can be seen from Fig. 1, FID-based acquisitions are used to enable ultrashort TEs and short TRs; large k-space coverage is achieved by using extended EPSI readout with ramp sampling as well as variable density sampling along the phase encoding directions; fMRI data is collected in EVI-based trajectories with sparse sampling of -space so that both fMRI and MRSI data are collected in the 3D mode to improve signal-to-noise ratio (SNR).
Figure 1.
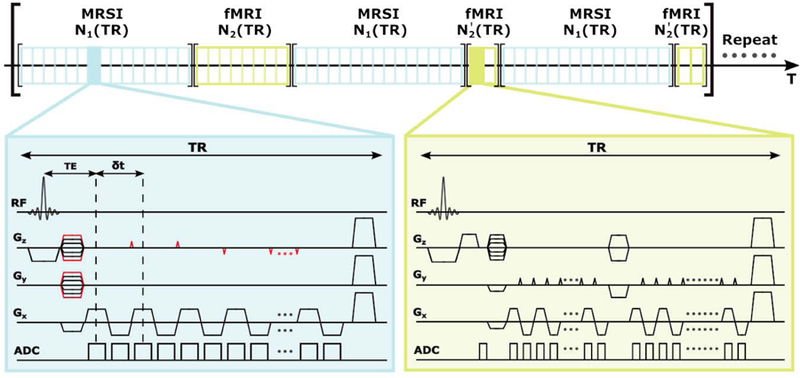
Time diagram of the proposed pulse sequence with interleaved acquisition of the MRSI and fMRI data. The MRSI data are acquired in modified EPSI trajectories while the fMRI data are acquired in EVI trajectories. In the MRSI acquisition, blipped gradients (shown in red) are applied in selected TRs to extend the k-space coverage (see Fig. 2). No water or lipid suppression is applied; in our current implementation, TE = 1.6 ms, TR = 160 ms, N1 = 15, N2 = 8, and .
Figure 3.

Sampling scheme for fMRI data acquisition. a) EVI trajectory traversed in one TR: data along the (readout) and (phase encoding) directions are collected in EPI trajectories, and 5 phase encodings are acquired along using blipped phase gradients (see Fig. 1). b) -space sampling: full data frames are collected with 8 TRs and sparse data frames are collected with 2 TRs; the resulting frame rate is 3 seconds.
During the MRSI data acquisition, FID signals with spatiospectral encodings are acquired in EPSI trajectories. As compared with conventional EPSI trajectories shown in Fig. 2(a), our trajectories have a larger k-space coverage (thus higher spatial resolution) and longer echo spacing (e.g., 1.76 ms, which is below the Nyquist sampling requirement for spectral encoding). This trade-off between increased spatial and reduced spectral encodings is enabled by the SPICE subspace imaging framework (29,30,33). To further extend k-space coverage and reduce data acquisition time, -space is sampled sparsely in variable density. More specifically, k-space is partitioned into three regions as shown in Fig. 2(b): a central region, a middle region and an outer region. The central region is sampled at the Nyquist rate spatially but a factor of two below the Nyquist rate temporally; the middle region is sampled below the Nyquist rate by a factor of two both spatially and temporally; the outer region is sampled below the Nyquist rate by a factor of three spatially and a factor of six temporally using blipped EPSI trajectories.
Figure 2.
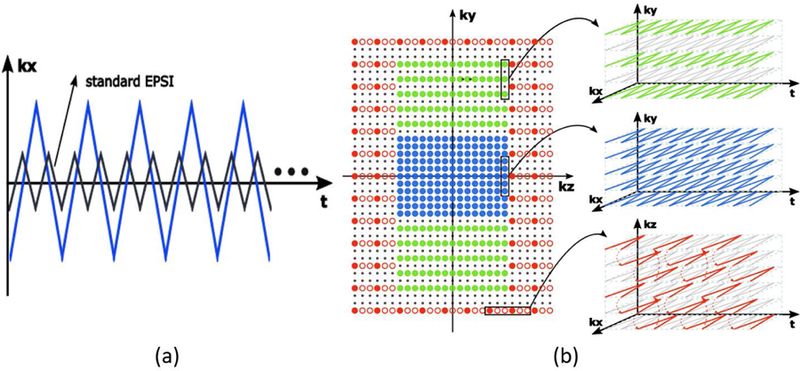
Sampling scheme for MRSI data acquisition. a) Spatiospectral encodings in one TR using a modified EPSI trajectory; note that as compared with conventional EPSI trajectories, the proposed method achieves larger k-space coverage (thus higher spatial resolution) by reducing the number of spectral encodings. b) Phase encodings with variable density sampling of k-space; the central region (blue) is sampled at the spatial Nyquist rate; the middle region (green region) is under sampled by a factor of two in direction while the outer region (red region) is under sampled by factor of three spatially and a factor of six temporally.
During the fMRI data acquisition, an FID signal is first collected for a very short period (1 ms) immediately after the excitation pulse for each TR. This “navigator” signal is used for tracking B0 field drift (34). After collecting the navigator signal, bipolar gradients are turned on to collect fMRI data in EVI trajectories. To improve data acquisition efficiency, ramp sampling is used along the readout direction and blipped phase encodings are applied along the direction by dividing each TR into several segments as shown in Fig. 3.
2.2. Data Processing
For notational simplicity, the fMRI and MRSI data collected by the proposed method are denoted by and , respectively; the time variables “t” and “T” represent temporal signal changes at two time scales, with and with . The MRSI data are collected at high temporal resolution ( ) to resolve the spectral distributions of different molecules while the fMRI data are acquired at a relatively lower temporal resolution ( ). Since both and are sparsely sampled, special algorithms are needed for data processing and image reconstruction.
For MRSI data processing, the overall spatiospectral variations are represented using a union-of-subspaces model which exploits the partial separability (PS) of MRSI signals (33). More specifically, we express the spatiotemporal functions of MRSI signals as:
| [1] |
where , , represent the spatiotemporal functions of water, lipids, and metabolites, respectively. This subspace model exploits the fact that each signal component resides in a low-dimensional subspace spanned by a small number of basis functions (i.e., , , and ). With Eq. [1], the MRSI image reconstruction problem becomes a parameter estimation problem, i.e., determination of the spatial coefficients , , and from . Because of sparse sampling, spectral overlaps, a huge dynamic range of different signal components, and low-SNR of the measured data, it is not desirable to solve the parameter estimation problem directly using conventional model-fitting methods. We solved this problem using the SPICE framework incorporating prior information and pre-learnt spectral basis. More specifically, the field drift effect is first corrected using the field drift information (including frequency and phase changes) estimated from the navigator signals (34). Then the field inhomogeneity effect is removed using the high-resolution field map estimated from the unsuppressed water signals as was done in the original SPICE method (29). To avoid solving the parameter estimation problem for the spatiospectral model in Eq. [1] jointly for all the molecular components, the water and lipid components are first eliminated from . This is the so-called “nuisance removal” problem that has been extensively investigated (35–37). Our method uses a Papoulis-Gerchberg (PG)-based iterative algorithm for lipid removal and a subspace model-based method for water removal. A detailed description of these algorithms can be found in (35–39). After the water and lipid components are removed from Eq. [1], the spatiospectral distributions of the desired molecules are determined by fitting the spatiospectral model to the nuisance-removed MRSI data as was done in the original SPICE method but using a set of pre-learnt spectral basis (29,33,40,41).
For fMRI data processing, we solved two key problems: a) image reconstruction from and b) determination of the functional activation maps from the fMRI images. The second problem includes motion correction, co-registration, segmentation, spatial smoothing, and independent component analysis (ICA). This problem is solved using the standard fMRI data processing pipeline (42–46), which performs motion correction, co-registration, segmentation, and spatial smoothing using the SPM software platform and performs ICA analysis using the fastICA algorithm (45). To solve the first problem, i.e., reconstructing fMRI images from , is expressed in terms of a PS model using a single subspace as:
| [2] |
where is a set of temporal basis functions for the fMRI signals. Such a model has been successfully used for dynamic imaging (47) and fMRI (48,49). With this model, the image reconstruction problem can be divided into two subproblems: a) determination of the temporal basis and b) estimation of the spatial coefficients . Using our proposed data acquisition scheme shown in Fig. 3(b), 50% of the spatial encodings in are acquired in high temporal resolution (3 seconds); the data from these encodings are used to estimate the temporal basis functions, , using SVD as was done in (47–49). More specifically, a Casorati matrix is formed based on these data and its principal right singular vectors are chosen as ; more details about this method can be found in (47). After the temporal basis functions are determined, the spatial coefficients are determined from the sparsely sampled by solving the following optimization problem:
| [3] |
where and are matrix representations of the spatial coefficients and temporal basis; is a vector containing all the data in ; is the -space sampling operator as shown in Fig. 3(b); is a diagonal weighting matrix for edge-preserving regularization (47); is a regularization parameter, which is chosen empirically based on the discrepancy principle (50). Equation [3] is a typical Tikhonov regularization problem that can be solved efficiently (50).
2.3. Implementation and Experimental Study
To demonstrate the feasibility of our proposed method, we implemented the proposed sequence on a 3T scanner (Siemens Prisma). In our current implementation, the sequence used a 27° slab-selective excitation, TR = 160 ms, TE = 1.6 ms, and readout bandwidth = 167 kHz. It collected the following signal components sequentially in one acquisition cycle of 9 seconds: MRSI data for 2.4 seconds (over 15 TRs), fMRI data for 1.2 seconds (over 8 TRs), MRSI data for 2.4 seconds (over 15 TRs), fMRI data for 0.3 seconds (over 2 TRs), MRSI data for 2.4 seconds (over 15 TRs), and then fMRI data for 0.3 seconds (over 2 TRs). This acquisition cycle was repeated until sufficient encodings were acquired for both fMRI and MRSI. For our imaging study, we set FOV = 230×230×72 mm3. The MRSI data covered k-space with 110×120×36 encodings for water imaging and 110×96×24 for metabolic imaging, which correspond to 1.9×1.9×1.8 mm3 and 1.9×2.5×3.0 mm3 nominal spatial resolutions, respectively. The sequence acquired 76 frequency encodings along , 38 phase encodings along , and 5 phase encodings along for the fMRI component. Therefore, 8 TRs (1.2 seconds) were allocated to obtain a complete fMRI data frame with 76×76×40 k-space points, which have a factor of 2 undersampling along direction. The sequence collected the 8-TR fMRI data frames every 9 seconds; between every two 8-TR fMRI frames, two 2-TR fMRI data frames were acquired with a factor of 4 undersampling along the direction. So, the effective temporal resolution of the fMRI data is 3 seconds as shown in Fig. 3(b). The entire scan time was 6.5 minutes, which generated 120 fMRI data frames.
In data processing, MRSI data from the central and middle regions of -space which contain a total of 110×96×24 spatial encodings, were used for reconstructing the spatiospectral functions of the desired molecules (e.g., NAA, Cho, Cr, etc.). For QSM calculation, we used the entire MRSI data with 110×120×36 spatial encodings, in which the outer k-space data had a relatively large temporal sampling interval of 5.28 ms. The processing method used for QSM calculation is based on our previous work on simultaneous MRSI and QSM (31), which include: a) estimation of the total field inhomogeneity map from the unsuppressed water signals, b) removal of background field by solving a Laplacian boundary value problem, and c) reconstruction of the tissue susceptibility map by solving the dipole inversion model with anatomical constraints. A detailed description of the QSM calculation method can be found in (31).
3. RESULTS
In the resting-state fMRI/MRSI experiments, the spatial maps corresponding to the well-recognized resting-state functional networks (RSNs) were obtained using ICA analysis (43–45). Figure 4 shows a set of representative spatial components extracted from our fMRI data, which were converted to -scores and displayed using a threshold of >2. The corresponding RSNs include the default mode network (DMN), medial visual network (MVN), lateral visual network (LVN), executive control network (ECN), sensorimotor network (SMN), and auditory network (AN). These network structures are consistent with those in the literature (51–54).
Figure 4.
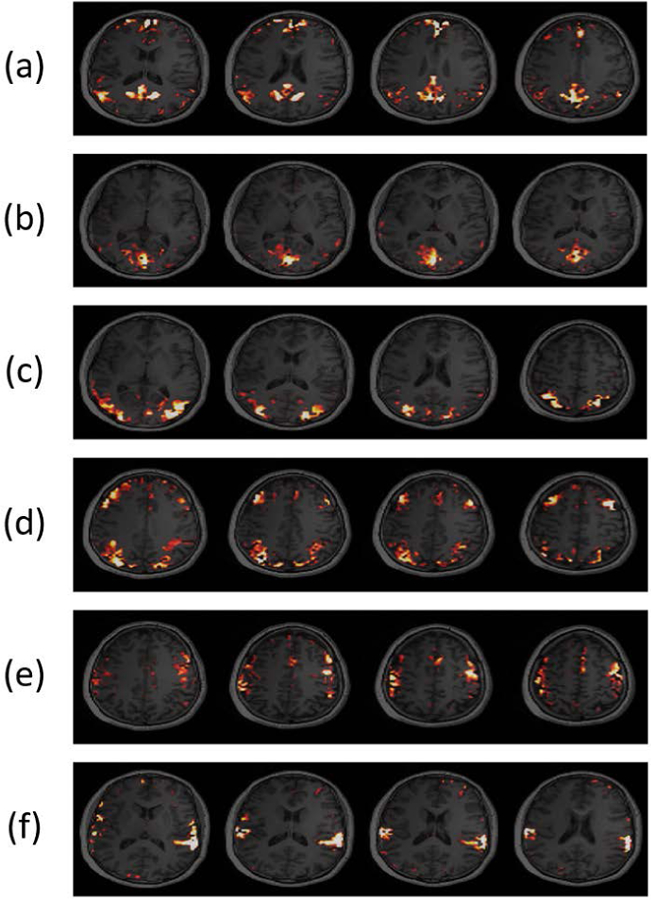
Activation maps obtained from a 6.5-min resting-state fMRI/MRSI scan using the proposed method. The maps showed spatial patterns for: (a) default mode network (DMN), (b) medial visual network (MVN), (c) lateral visual network (LVN), (d) executive control network (ECN) (e) sensorimotor network (SMN), and (f) auditory network (AN), respectively. These resting-state network structures are consistent with those in the literature (51–54).
In addition to the resting-state networks, spatiospectral functions of brain metabolites were also obtained from the data acquired in our experiments. Figure 5 shows the concentration maps of several metabolites, including N-acetylaspartate (NAA), creatine (Cr), choline (Cho) and glutamate + glutamine (Glx), from different slices across the brain. As can be seen, both the SNR and resolution of the metabolite maps are rather good given the short acquisition time. To illustrate the spectral quality of our reconstructions, a set of representative spectra is displayed in Fig. 6. As can be seen, high-quality spectra of the brain metabolites were produced by the proposed method. To further analyze the spectra quantitively, spectral quantification was performed on the averaged spectra from the gray matter and white matter (55). The quantification results showed that NAA/Cr was 1.24±0.20 in gray matter and 1.31±0.19 in white matter; Cho/Cr was 0.22±0.06 and 0.25±0.05 in grey and white matter, respectively, which were consistent with the literature values (56). The QSM maps generated from the MRSI data have a higher spatial resolution than the metabolite maps due to the additional outer k-space data collected for QSM calculation using our variable density sparse sampling scheme. Note that the functional, metabolic information and QSM were all obtained simultaneously from a single 6.5-min scan, in contrast to three separate long scans needed in current practice, e.g., 10 min for fMRI (43,44), 8 min for QSM (57) and 20 min for MRSI (12,13).
Figure 5.
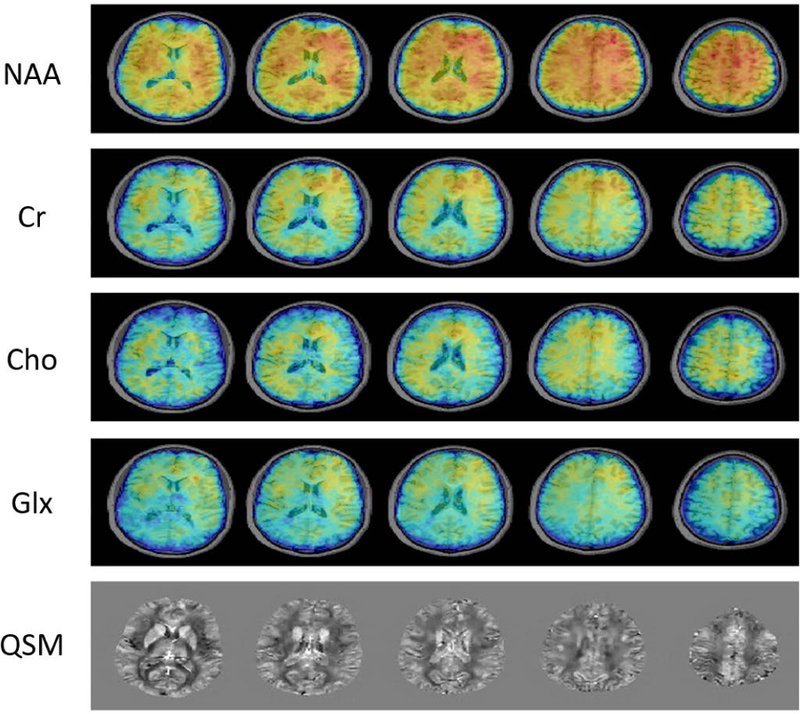
Metabolite maps and QSM generated from the same experimental data described in Figure 4. The metabolite maps were reconstructed at 1.9×2.5×3.0 mm3 nominal spatial resolution while the QSM was reconstructed at 1.9×1.9×1.8 mm3 spatial resolution.
Figure 6.
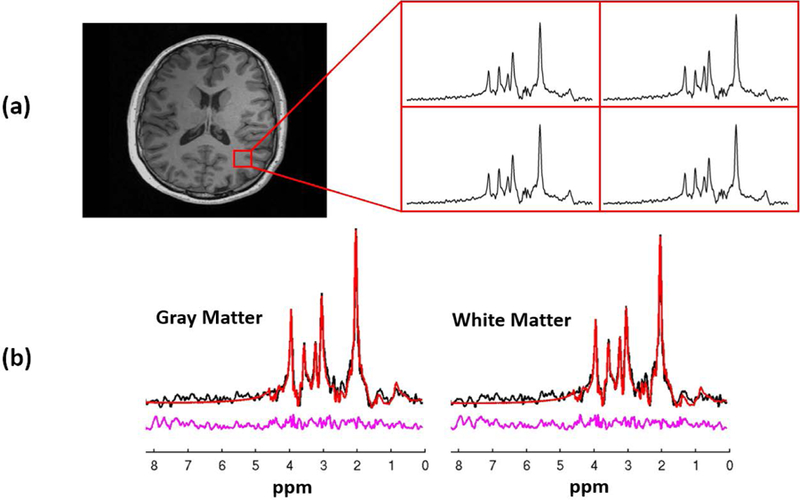
Representative results showing the spectral quality of the proposed method: (a) localized spectra from the selected spatial region, and (b) spectral fitting results of the averaged spectra from the gray matter and white matter, respectively. The spectral quantification results showed that NAA/Cr was 1.24±0.20 in gray matter and 1.31±0.19 in white matter; Cho/Cr was 0.22±0.06 and 0.25±0.05 in grey and white matter, respectively, which are consistent with the literature values (56).
4. DISCUSSION
This work demonstrates the feasibility of simultaneous high-resolution imaging of brain function and metabolism in a single scan using a new SPICE-based data acquisition and processing method. This method also effectively utilizes the complementary information in the fMRI and MRSI data to improve the quality and robustness of fMRI and MRSI under practical experimental conditions. The MRSI data contain the “full” spatiospectral information of the fat and water signals, which are not available from conventional fMRI experiments. With this information, we can effectively identify and remove the well-known chemical shift artifacts and susceptibility distortions associated with EPI acquisitions often used for fMRI experiments. This capability enables 3D fMRI in EVI trajectories without fat suppression. The EVI-based acquisition has several advantages over conventional multi-slice EPI acquisitions, which include: a) no fat suppression, b) no timing shifts among the different slices, c) no spatial gaps between the adjacent slices, and d) more efficient use of the free precession period after each pulse for data acquisition.
Another advantage of our simultaneous fMRI/MRSI method lies in the fact that the fMRI data can be used as navigators to detect field drift and head motion for MRSI data processing. Field drift due to gradient switching is inevitable, and can cause spatial displacement or frequency shift in most MRSI applications. Mapping the field drift is important for achieving accurate and consistent MRSI results. Hence capturing these field changes can improve the robustness of our methods for practical applications. For motion detection, the fMRI data are collected in high temporal resolution (3 seconds) and can capture bulk head motion during the whole scan, an example of which is given in Fig. 7, where the subject moved twice during the scan. As can be seen, by removing the motion-corrupted data, the motion artifacts were significantly reduced in the resulting images.
Figure 7.
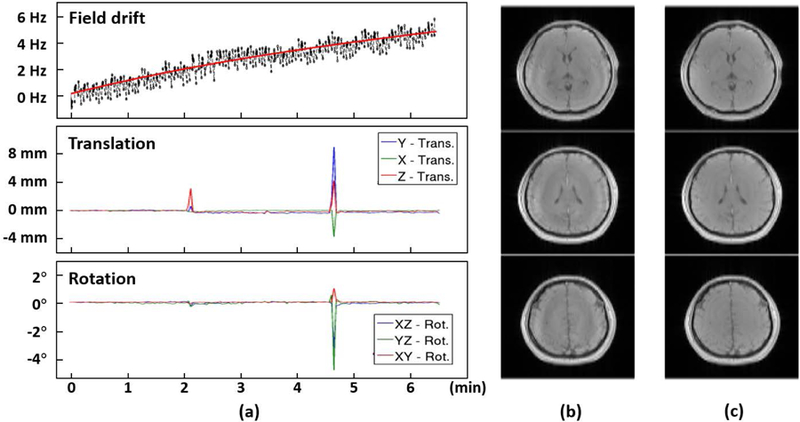
(a) Detected field drift and head motion parameters (translation and rotation) from the fMRI data. In this scan, the subject was instructed to move his head twice during the scan at 2.1 min and 4.7 min, respectively. The detected motion was in good agreement with the expected timing. (b) The water images from the motion-corrupted MRSI data. (c) the water images by removing motion corrupted data followed by SENSE reconstruction. Note that the motion artifacts were significantly reduced from the MRSI data. This capability improves the robustness of our method for practical applications.
Compared with the existing fMRS techniques used for studying neurochemical changes in response to brain functional activity, our method provides much larger brain coverage and higher resolutions in addition to its unique capability for simultaneous mapping of brain function and metabolism. For example, in our fMRI/MRSI experiments, we obtained MRSI data of 1.9×2.5×3.0 mm3 nominal spatial resolution, which is much higher than typical fMRS scans with 20×20×20 mm3 voxel size; we were also able to scan a large brain region (e.g. 230×230×72 mm3) instead of one large voxel per scan. Furthermore, the simultaneously acquired QSM maps provide further information about the physiology of brain tissues (57,58).
5. CONCLUSIONS
A new method is presented to enable simultaneous fMRI and MRSI of the brain by synergistically integrating SPICE-based MRSI with EVI-based fMRI. Brain imaging experiments have also been carried out to demonstrate the feasibility and potential of the proposed method. Experimental results show that the proposed method can acquire spatial maps of brain metabolites, functional networks, and tissue susceptibility simultaneously at high-resolution. The proposed method offers significantly higher spatial resolution and larger brain coverage than any existing techniques. With further improvement, the method can provide a powerful tool for mapping brain function and metabolism simultaneously.
ACKNOWLEDGEMENTS
This work was supported in part by the National Institutes of Health (NIH-R21-EB021013 and NIH-R21-EB023413)
REFERENCES
- 1.Ogawa S, Lee TM, Kay AR, Tank DW. Brain magnetic resonance imaging with contrast dependent on blood oxygenation. Proc Natl Acad Sci U S A 1990;87(24):9868–9872. 10.1073/pnas.87.24.9868 [DOI] [PMC free article] [PubMed] [Google Scholar]
- 2.Belliveau JW, Kennedy DN, McKinstry RC, et al. Functional mapping of the human visual cortex by magnetic resonance imaging. Science 1991;254(5032):716–719. 10.1126/science.1948051 [DOI] [PubMed] [Google Scholar]
- 3.Bandettini PA, Wong EC, Hinks RS, Tikofsky RS, Hyde JS. Time course EPI of human brain function during task activation. Magn Reson Med 1992;25(2):390–397. 10.1002/mrm.1910250220 [DOI] [PubMed] [Google Scholar]
- 4.Kwong KK, Belliveau JW, Chesler DA, et al. Dynamic magnetic resonance imaging of human brain activity during primary sensory stimulation. Proc Natl Acad Sci U S A 1992;89(12):5675–5679. 10.1073/pnas.89.12.5675 [DOI] [PMC free article] [PubMed] [Google Scholar]
- 5.Lauterbur PC, Kramer DM, House WV., Chen CN. Zeugmatographic high resolution nuclear magnetic resonance spectroscopy. Images of chemical inhomogeneity within macroscopic objects. J Am Chem Soc 1975;97(23):6866–6868. 10.1021/ja00856a046 [DOI] [Google Scholar]
- 6.Brown TR, Kincaid BM, Ugurbil K. NMR chemical shift imaging in three dimensions. Proc Natl Acad Sci U S A 1982;79(11):3523–3526. 10.1073/pnas.79.11.3523 [DOI] [PMC free article] [PubMed] [Google Scholar]
- 7.Maudsley AA, Hilal SK, Perman WH, Simon HE. Spatially resolved high resolution spectroscopy by “four-dimensional” NMR. J Magn Reson 1983;51(1):147–152. 10.1016/0022-2364(83)90113-0 [DOI] [Google Scholar]
- 8.Mansfield P. Spatial mapping of the chemical shift in NMR. Magn Reson Med 1984;1(3):370–386. 10.1002/mrm.1910010308 [DOI] [PubMed] [Google Scholar]
- 9.Posse S, Tedeschi G, Risinger R, Ogg R, Bihan D Le. High speed 1H spectroscopic imaging in human brain by echo planar spatial-spectral encoding. Magn Reson Med 1995;33(1):34–40. 10.1002/mrm.1910330106 [DOI] [PubMed] [Google Scholar]
- 10.Biswal B, Zerrin Yetkin F, Haughton VM, Hyde JS. Functional connectivity in the motor cortex of resting human brain using echo-planar MRI. Magn Reson Med 1995;34(4):537–541. 10.1002/mrm.1910340409 [DOI] [PubMed] [Google Scholar]
- 11.Bandettini PA, Wong EC, Jesmanowicz A, Hinks RS, Hyde JS. Spin-echo and gradient-echo EPI of human brain activation using bold contrast: A comparative study at 1.5 T. NMR Biomed 1994;7(1–2):12–20. 10.1002/nbm.1940070104 [DOI] [PubMed] [Google Scholar]
- 12.Adalsteinsson E, Irarrazabal P, Topp S, Meyer C, Macovski A, Spielman DM. Volumetric spectroscopic imaging with spiral-based k-space trajectories. Magn Reson Med 1998;39(6):889–898. 10.1002/mrm.1910390606 [DOI] [PubMed] [Google Scholar]
- 13.Maudsley AA, Domenig C, Govind V, et al. Mapping of brain metabolite distributions by volumetric proton MR spectroscopic imaging (MRSI). Magn Reson Med 2009;61(3):548–559. 10.1002/mrm.21875 [DOI] [PMC free article] [PubMed] [Google Scholar]
- 14.Posse S, Otazo R, Dager SR, Alger J. MR spectroscopic imaging: principles and recent advances. J Magn Reson Imaging 2013;37(6):1301–1325. 10.1002/jmri.23945 [DOI] [PubMed] [Google Scholar]
- 15.Prichard J, Rothman D, Novotny E, et al. Lactate rise detected by 1H NMR in human visual cortex during physiologic stimulation. Proc Natl Acad Sci 1991;88(13):5829–5831. 10.1073/pnas.88.13.5829 [DOI] [PMC free article] [PubMed] [Google Scholar]
- 16.Frahm J, Krüger G, Merboldt KD, Kleinschmidt A. Dynamic uncoupling and recoupling of perfusion and oxidative metabolism during focal brain activation in man. Magn Reson Med 1996;35(2):143–148. 10.1002/mrm.1910350202 [DOI] [PubMed] [Google Scholar]
- 17.Sappey-Marinier D, Calabrese G, Fein G, Hugg JW, Biggins C, Weiner MW. Effect of photic stimulation on human visual cortex lactate and phosphates using 1H and 31P magnetic resonance spectroscopy. J Cereb Blood Flow Metab 1992;12(4):584–592. 10.1038/jcbfm.1992.82 [DOI] [PubMed] [Google Scholar]
- 18.Chen W, Novotny EJ, Zhu X-H, Rothman DL, Shulman RG. Localized 1H NMR measurement of glucose consumption in the human brain during visual stimulation. Proc Natl Acad Sci U S A 1993;90(21):9896–9900. 10.1073/pnas.90.21.9896 [DOI] [PMC free article] [PubMed] [Google Scholar]
- 19.Mullins PG, Rowland LM, Jung RE, Sibbitt WL. A novel technique to study the brain’s response to pain: Proton magnetic resonance spectroscopy. Neuroimage 2005;26(2):642–646. 10.1016/j.neuroimage.2005.02.001 [DOI] [PubMed] [Google Scholar]
- 20.Mangia S, Tkáč I, Gruetter R, Van De Moortele PF, Maraviglia B, Uǧurbil K. Sustained neuronal activation raises oxidative metabolism to a new steady-state level: Evidence from 1H NMR spectroscopy in the human visual cortex. J Cereb Blood Flow Metab 2007;27(5):1055–1063. 10.1038/sj.jcbfm.9600401 [DOI] [PubMed] [Google Scholar]
- 21.Duarte JMN, Lei H, Mlynárik V, Gruetter R. The neurochemical profile quantified by in vivo 1H NMR spectroscopy. Neuroimage 2012;61(2):342–362. 10.1016/j.neuroimage.2011.12.038 [DOI] [PubMed] [Google Scholar]
- 22.Lin Y, Stephenson MC, Xin L, Napolitano A, Morris PG. Investigating the metabolic changes due to visual stimulation using functional proton magnetic resonance spectroscopy at 7 T. J Cereb Blood Flow Metab 2012;32(8):1484–1495. 10.1038/jcbfm.2012.33 [DOI] [PMC free article] [PubMed] [Google Scholar]
- 23.Schaller B, Mekle R, Xin L, Kunz N, Gruetter R. Net increase of lactate and glutamate concentration in activated human visual cortex detected with magnetic resonance spectroscopy at 7 tesla. J Neurosci Res 2013;91(8):1076–1083. 10.1002/jnr.23194 [DOI] [PubMed] [Google Scholar]
- 24.Huang Z, Davis Iv H (Hap), Yue Q, et al. Increase in glutamate/glutamine concentration in the medial prefrontal cortex during mental imagery: A combined functional mrs and fMRI study. Hum Brain Mapp 2015;36(8):3204–3212. 10.1002/hbm.22841 [DOI] [PMC free article] [PubMed] [Google Scholar]
- 25.Bednařík P, Tkáč I, Giove F, et al. Neurochemical and BOLD responses during neuronal activation measured in the human visual cortex at 7 Tesla. J Cereb Blood Flow Metab 2015;35:601–610. 10.1038/jcbfm.2014.233 [DOI] [PMC free article] [PubMed] [Google Scholar]
- 26.Mangia S, Tkáč I, Gruetter R, et al. Sensitivity of single-voxel 1H-MRS in investigating the metabolism of the activated human visual cortex at 7 T. Magn Reson Imaging 2006;24(4):343–348. 10.1016/j.mri.2005.12.023 [DOI] [PubMed] [Google Scholar]
- 27.Schaller B, Xin L, O’Brien K, Magill AW, Gruetter R. Are glutamate and lactate increases ubiquitous to physiological activation? A 1H functional MR spectroscopy study during motor activation in human brain at 7 Tesla. Neuroimage 2014;93(P1):138–145. 10.1016/j.neuroimage.2014.02.016 [DOI] [PubMed] [Google Scholar]
- 28.Jelen LA, King S, Mullins PG, Stone JM. Beyond static measures: A review of functional magnetic resonance spectroscopy and its potential to investigate dynamic glutamatergic abnormalities in schizophrenia. J Psychopharmacol 2018;32(5):497–508. 10.1177/0269881117747579 [DOI] [PubMed] [Google Scholar]
- 29.Lam F, Liang ZP. A subspace approach to high-resolution spectroscopic imaging. Magn Reson Med 2014;71(4):1349–1357. 10.1002/mrm.25168 [DOI] [PMC free article] [PubMed] [Google Scholar]
- 30.Lam F, Ma C, Clifford B, Johnson CL, Liang ZP. High-resolution 1H-MRSI of the brain using SPICE: Data acquisition and image reconstruction. Magn Reson Med 2016;76(4):1059–1070. 10.1002/mrm.26019 [DOI] [PMC free article] [PubMed] [Google Scholar]
- 31.Peng X, Lam F, Li Y, Clifford B, Liang ZP. Simultaneous QSM and metabolic imaging of the brain using SPICE. Magn Reson Med 2018;79(1):13–21. 10.1002/mrm.26972 [DOI] [PMC free article] [PubMed] [Google Scholar]
- 32.Betina Ip I, Berrington A, Hess AT, Parker AJ, Emir UE, Bridge H. Combined fMRI-MRS acquires simultaneous glutamate and BOLD-fMRI signals in the human brain. Neuroimage 2017;155:113–119. 10.1016/j.neuroimage.2017.04.030 [DOI] [PMC free article] [PubMed] [Google Scholar]
- 33.Liang ZP. Spatiotemporal imaging with partially separable functions. In: Proc. of 2007 Joint Meet. of the 6th Int. Symp. on Noninvasive Functional Source Imaging of the Brain and Heart and the Int. Conf. on Functional Biomedical Imaging, NFSI and ICFBI 2007 ; 2007:181–182. 10.1109/NFSI-ICFBI.2007.4387720 [DOI]
- 34.Ebel A, Maudsley AA. Detection and correction of frequency instabilities for volumetric 1H echo-planar spectroscopic imaging. Magn Reson Med 2005;53(2):465–469. 10.1002/mrm.20367 [DOI] [PubMed] [Google Scholar]
- 35.Ma C, Lam F, Johnson CL, Liang ZP. Removal of nuisance signals from limited and sparse 1H MRSI data using a union-of-subspaces model. Magn Reson Med 2016;75(2):488–497. 10.1002/mrm.25635 [DOI] [PMC free article] [PubMed] [Google Scholar]
- 36.Hernando D, Haldar J, Sutton B, Liang ZP. Removal of lipid signal in mrsi using spatial-spectral constraints. In: 2007 4th IEEE International Symposium on Biomedical Imaging: From Nano to Macro-Proceedings ; 2007:1360–1363. 10.1109/ISBI.2007.357113 [DOI]
- 37.Hernando D, Kellman P, Haldar JP, Liang ZP. Robust water/fat separation in the presence of large field inhomogeneities using a graph cut algorithm. Magn Reson Med 2010;63(1):79–90. 10.1002/mrm.22177 [DOI] [PMC free article] [PubMed] [Google Scholar]
- 38.Li Y, Lam F, Guo R, Clifford B, Peng X, Liang ZP. Removal of water sidebands from 1H-MRSI data acquired without water suppression. In: Proceedings of the International Symposium on Magnetic Resonsance in Medicine. Paris, France; 2017:288. [Google Scholar]
- 39.Haupt CI, Schuff N, Weiner MW, Maudsley AA. Removal of lipid artifacts in 1H spectroscopic imaging by data extrapolation. Magn Reson Med 1996;35(5):678–687. 10.1002/mrm.1910350509 [DOI] [PMC free article] [PubMed] [Google Scholar]
- 40.Pruessmann KP, Weiger M, Scheidegger MB, Boesiger P. SENSE: Sensitivity encoding for fast MRI. Magn Reson Med 1999;42(5):952–962. [DOI] [PubMed] [Google Scholar]
- 41.Griswold MA, Jakob PM, Heidemann RM, et al. Generalized autocalibrating partially parallel acquisitions (GRAPPA). Magn Reson Med 2002;47(6):1202–1210. 10.1002/mrm.10171 [DOI] [PubMed] [Google Scholar]
- 42.Penny W, Friston K, Ashburner J, Kiebel S, Nichols T. Statistical Parametric Mapping: The Analysis of Functional Brain Images Elsevier; 2007. 10.1016/B978-0-12-372560-8.X5000-1 [DOI] [Google Scholar]
- 43.Beckmann CF, Smith SM. Probabilistic independent component analysis for functional magnetic resonance imaging. IEEE Trans Med Imaging 2004;23(2):137–152. 10.1109/TMI.2003.822821 [DOI] [PubMed] [Google Scholar]
- 44.McKeown MJ, Makeig S, Brown GG, et al. Analysis of fMRI data by blind separation into independent spatial components. Hum Brain Mapp 1998;6(3):160–188. [DOI] [PMC free article] [PubMed] [Google Scholar]
- 45.Hyvärinen A, Oja E. A fast fixed-point algorithm for independent component analysis. Neural Comput 1997;9(7):1483–1492. 10.1162/neco.1997.9.7.1483 [DOI] [Google Scholar]
- 46.Yan CG, Wang X Di, Zuo XN, Zang YF. DPABI: data processing & analysis for (resting-state) brain imaging. Neuroinformatics 2016;14(3):339–351. 10.1007/s12021-016-9299-4 [DOI] [PubMed] [Google Scholar]
- 47.Zhao B, Haldar JP, Christodoulou AG, Liang ZP. Image reconstruction from highly under sampled (k, t)-space data with joint partial separability and sparsity constraints. IEEE Trans Med Imaging 2012;31(9):1809–1820. 10.1109/TMI.2012.2203921 [DOI] [PMC free article] [PubMed] [Google Scholar]
- 48.Lam F, Zhao B, Liu Y, Liang Z-P, Weiner M, Schuff N. Accelerated fMRI using low-rank model and sparsity constraints. In: Proceedings of the International Symposium on Magnetic Resonsance in Medicine Salt Lake City, Utah, USA; 2013:2620. [Google Scholar]
- 49.Nguyen HM, Glover GH. Sparsely sampled functional magnetic resonance imaging using low-rank and sparsity constraints In: 2014 IEEE 5th International Conference on Communications and Electronics, IEEE ICCE 2014. ; 2014:454–457. 10.1109/CCE.2014.6916747 [DOI] [Google Scholar]
- 50.Tikhonov AN, Goncharsky AV., Stepanov VV., Yagola AG. Numerical Methods for the Solution of Ill-Posed Problems Springer Science & Business Media; 1995. 10.1007/978-94-015-8480-7 [DOI] [Google Scholar]
- 51.Lee MH, Smyser CD, Shimony JS. Resting-state fMRI: A review of methods and clinical applications. AJNR Am J Neuroradiol 2013;34(10):1866–1872. 10.3174/ajnr.A3263 [DOI] [PMC free article] [PubMed] [Google Scholar]
- 52.Doucet G, Naveau M, Petit L, et al. Brain activity at rest: a multiscale hierarchical functional organization. J Neurophysiol 2011;105(6):2753–2763. 10.1152/jn.00895.2010 [DOI] [PubMed] [Google Scholar]
- 53.Damoiseaux JS, Rombouts SARB, Barkhof F, et al. Consistent resting-state networks across healthy subjects. Proc Natl Acad Sci 2006;103(37):13848–13853. 10.1073/pnas.0601417103 [DOI] [PMC free article] [PubMed] [Google Scholar]
- 54.Castellazzi G, Palesi F, Casali S, et al. A comprehensive assessment of resting state networks: Bidirectional modification of functional integrity in cerebro-cerebellar networks in dementia. Front Neurosci 2014;(8 JUL). 10.3389/fnins.2014.00223 [DOI] [PMC free article] [PubMed] [Google Scholar]
- 55.Li Y, Lam F, Clifford B, Liang ZP. A subspace approach to spectral quantification for MR spectroscopic imaging. IEEE Trans Biomed Eng 2017;64(10):2486–2489. 10.1109/TBME.2017.2741922 [DOI] [PMC free article] [PubMed] [Google Scholar]
- 56.Martin E, Keller M, Ritter S, Largo RH, Thiel T, Loenneker T. Contribution of proton magnetic resonance spectroscopy to the evaluation of children with unexplained developmental delay. Pediatr Res 2005;58(4):754–760. 10.1203/01.PDR.0000180559.29393.BE [DOI] [PubMed] [Google Scholar]
- 57.Wang Y, Liu T. Quantitative susceptibility mapping (QSM): Decoding MRI data for a tissue magnetic biomarker. Magn Reson Med 2015;73(1):82–101. 10.1002/mrm.25358 [DOI] [PMC free article] [PubMed] [Google Scholar]
- 58.Murakami Y, Kakeda S, Watanabe K, et al. Usefulness of quantitative susceptibility mapping for the diagnosis of Parkinson disease. AJNR Am J Neuroradiol 2015;36(6):1102–1108. 10.3174/ajnr.A4260 [DOI] [PMC free article] [PubMed] [Google Scholar]


