Abstract
Intestinal commensal bacteria can inhibit dense gut colonization by vancomycin-resistant Enterococcus faecium (VRE), a leading cause of hospital-acquired infections 1, 2. A consortium of commensal bacteria containing Blautia producta BPSCSK can reverse antibiotic-induced susceptibility to VRE infection 3. Herein we demonstrate that BPSCSK reduces VRE growth by secreting a lantibiotic similar to nisin-A produced by Lactococcus lactis. Although in vitro VRE growth is inhibited by BPSCSK and L. lactis, only BPSCSK colonizes the colon and reduces VRE density in vivo. In comparison to nisin-A, the BPSCSK lantibiotic has reduced activity against intestinal commensal bacteria. In patients at high risk for VRE infection, high lantibiotic gene abundance is associated with reduced E. faecium density. In germ free mice transplanted with patient-derived feces, resistance to VRE colonization correlates with lantibiotic gene abundance. Lantibiotic-producing commensal strains of the gastrointestinal tract reduce VRE colonization and represent potential probiotic agents to reestablish resistance to VRE.
Preventing transmission of highly antibiotic-resistant pathogens in healthcare settings remains problematic 4. A promising approach to reducing antibiotic-resistant infections entails enhancing the host’s microbiota-mediated colonization resistance (CR) by administering protective commensal bacteria 5. Although mechanisms of CR are being discovered, few bacterial strains mediating CR have been identified 6. Fecal microbiota transplantation (FMT), though effective for recurrent C. difficile infection 7, remains problematic because fecal compositions can be highly variable. Preclinical studies suggest that commensal bacterial strains inhabiting the lower GI tract can be effective at providing resistance 3, 8, 9, 10, 11.
Enterococci colonize the human gastrointestinal (GI) tract and have developed resistance to antibiotics, including vancomycin 1, 2. Antibiotic-mediated depletion of the gut microbiota leads to expansion of Vancomycin-resistant Enterococcus faecium (VRE) in the intestine, predisposing patients to bloodstream infections 6, 12, 13. In mice, FMT can reestablish CR and reduce intestinal VRE density 14, 15. We recently described a four-strain-consortium named CBBP, consisting of Clostridium bolteae, Blautia producta (BPSCSK), Bacteroides sartorii and Parabacteroides distasonis, that restored CR against VRE in antibiotic-treated mice 3.
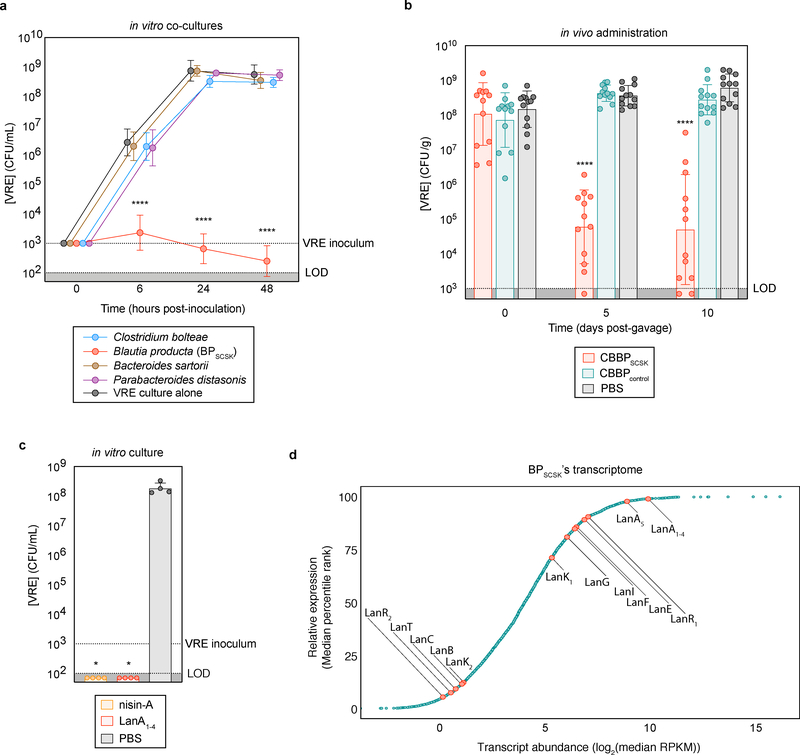
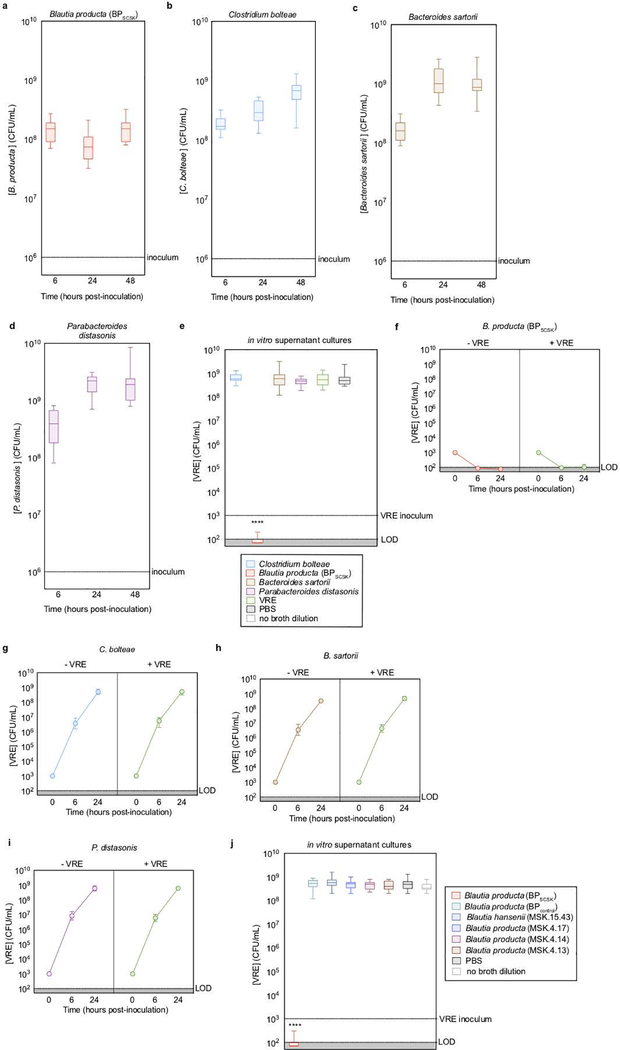
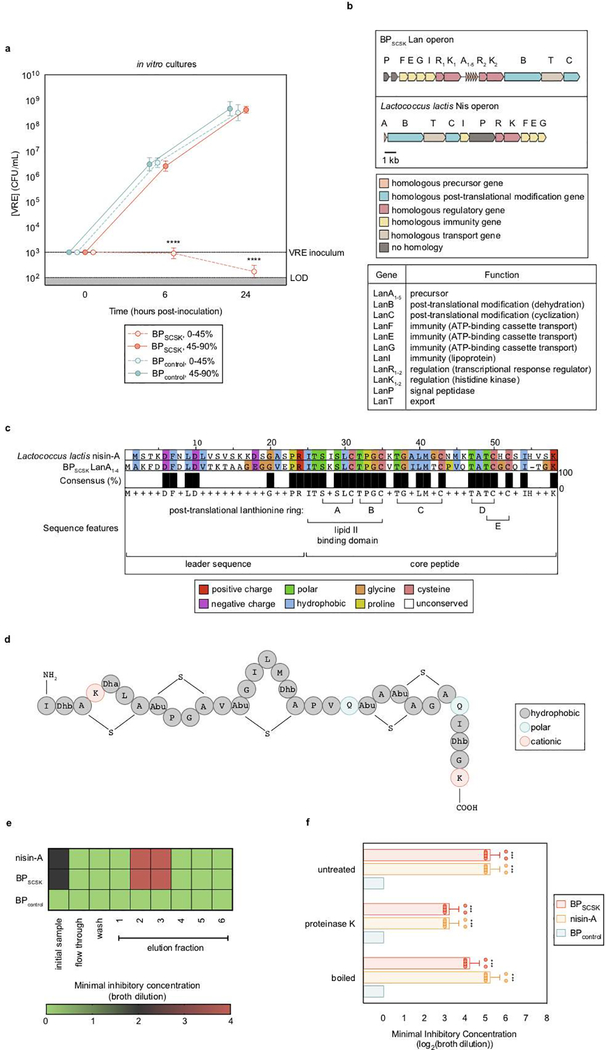
To determine the mechanism of CBBP-mediated VRE inhibition, we co-cultured each strain with VRE (Fig. 1a, Extended Data Fig. 1a–d). BPSCSK inhibited VRE growth, as did BPSCSK-conditioned media (Extended Data Fig. 1e–i), and dilution experiments demonstrated that BPSCSK-mediated inhibition is not due to nutrient depletion. In contrast to BPSCSK conditioned media, culture supernatants of Blautia producta (Clostridiales-VE-202–06 (BPcontrol)) and other microbiota-derived Blautia species did not inhibit VRE growth (Extended Data Fig. 1j, Supplementary Information Table 1,2).
Figure 1 |. BPSCSK expresses a lantibiotic in vivo that inhibits VRE.
a, VRE was co-cultured in vitro with each CBBP isolate (n = 15 biologically independent samples/3 independent experiments) and monitored for growth. b, antibiotic-treated, VRE dominated mice (n = 12 mice/3 independent experiments) received treatment by oral gavage containing CBBP, CBBPcontrol, or PBS. VRE colonization was monitored by CFU quantification in fecal samples. c, VRE was inoculated in culture broth with commercial nisin-A (100 μM), purified BPSCSK’s LanA1–4 lantibiotic (100 μM), or PBS (n = 4 biologically independent samples/2 independent experiments). VRE CFUs were enumerated 8 hours post-inoculation. d, RNA-Seq analysis was performed on cecal content from mice treated with CBBP (n = 3 mice/1 independent experiment). VRE (ATCC 700221) was used in experiments shown in panels a-c. All statistical analyses were performed using the Mann-Whitney rank sum test (two-tailed) comparing experimental conditions to a negative control. **** p-value < 0.0001, * p-value < 0.05 (= 0.0286). Data points (geometric mean), error bars (geometric s.d.) (a); median, error bars (range) (b); center value (geometric mean), error bars (geometric s.d.) (c), data points (median) (d).
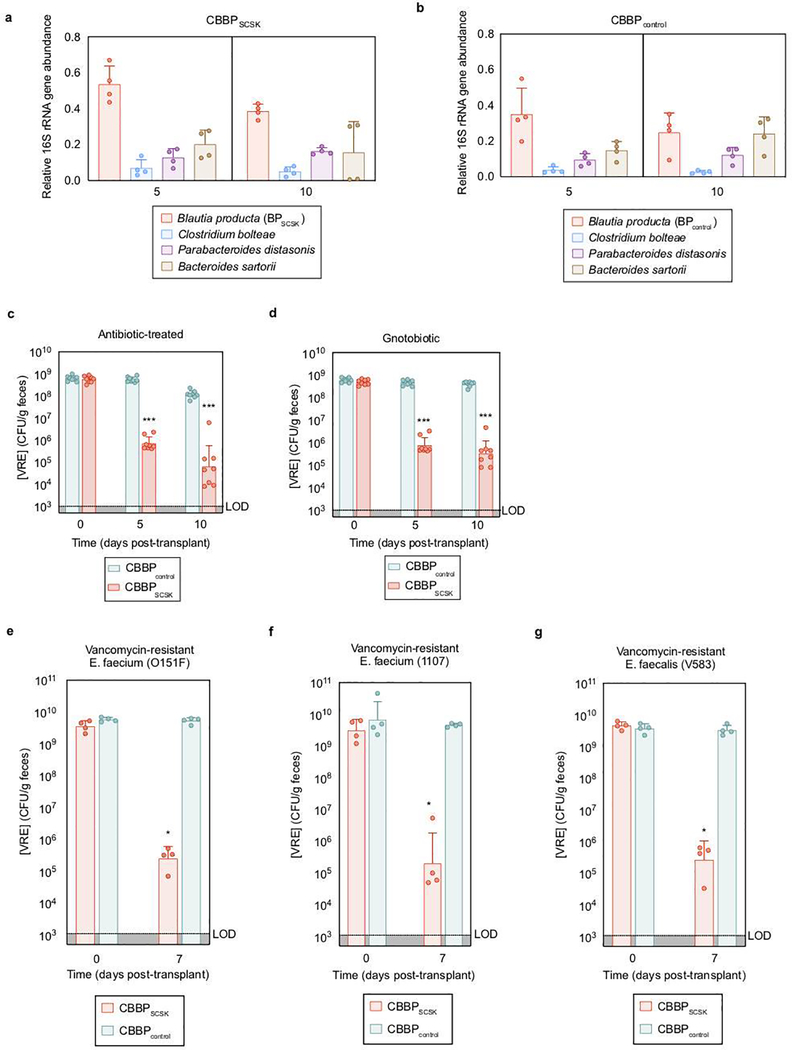
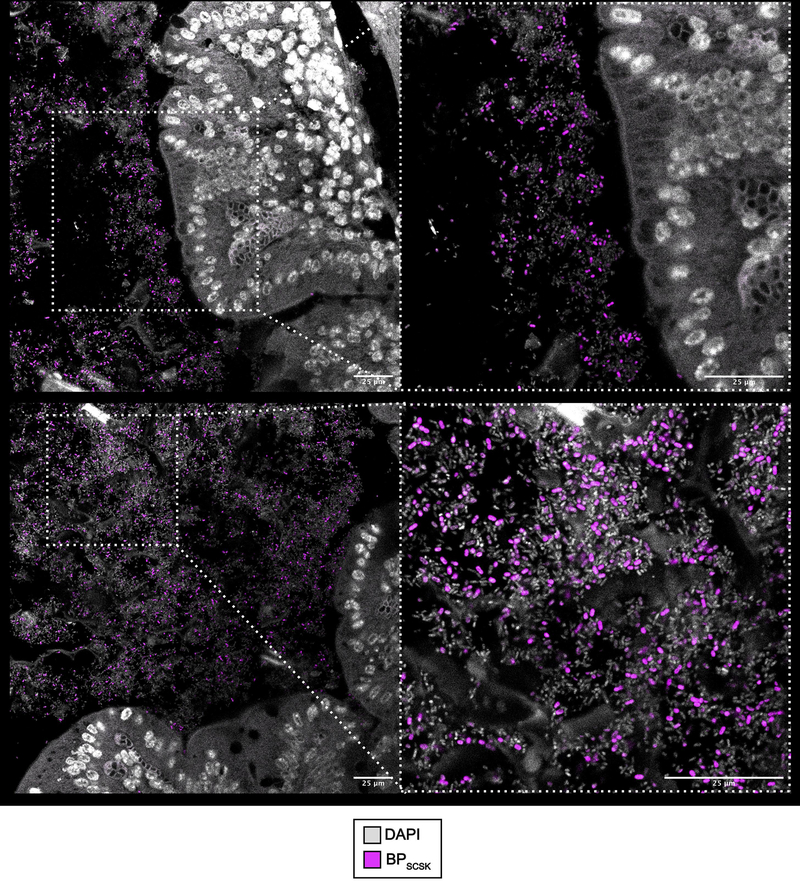
Previous studies demonstrated that BPSCSK requires the other CBBP members to colonize the intestine 3. CBBP, but not a modified consortium in which BPSCSK was replaced with BPcontrol (CBBPcontrol), reduced VRE colonization (Fig. 1b), even though both consortia colonized mice (Extended Data Fig. 2a,b). CBBP also reduced VRE colonization in gnotobiotic mice (Extended Data Fig. 2c,d). CBBP reduced colonization by multiple VRE strains (Extended Data Fig. 2e–g, Supplementary Information Table 3) and fluorescent in situ hybridization demonstrated BPSCSK colonization throughout the large intestine (Extended Data Fig. 3).
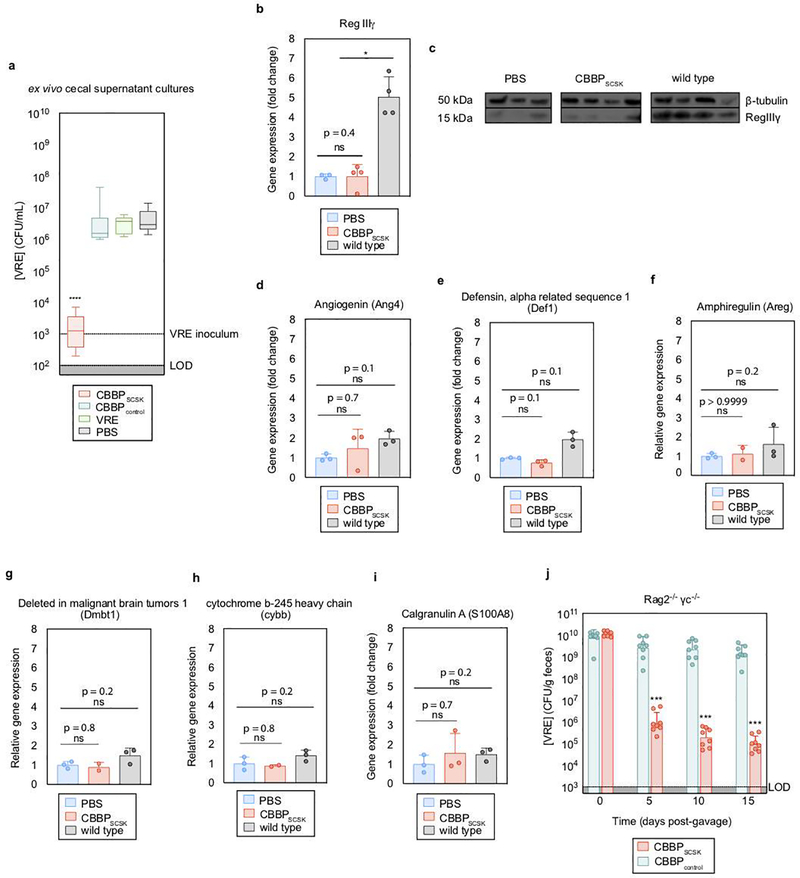
To determine whether BPSCSK produces an inhibitory factor, VRE was cultured in cecal contents from mice reconstituted with CBBP or CBBPcontrol (Extended Data Fig. 4a). Only CBBP cecal contents inhibited VRE growth. Previous studies demonstrated that the commensal microbiota stimulates secretion of host-derived antimicrobial peptides, such as RegIIIγ 16, which reduces intestinal VRE colonization 17. CBBP colonization, however, did not induce RegIIIγ transcripts or RegIIIγ protein in the ileum of antibiotic-treated mice (Extended Data Fig. 4b,c). Host-derived antimicrobial peptides and inflammatory genes did not differ between CBBP and PBS treated mice (Extended Data Fig. 4d–i). CBBP was effective at reducing VRE density in Rag2−/− γc−/− mice, indicating that T cells, B cells, natural killer cells, and innate lymphoid cells do not contribute to CBBP-mediated VRE inhibition (Extended Data Fig. 4j).
VRE was inhibited by proteins precipitated from BPSCSK but not BPcontrol conditioned media (Extended Data Fig. 5a), suggesting BPSCSK secretes an inhibitor. We performed whole genome sequencing of BPSCSK and BPcontrol and discovered that only BPSCSK contains an operon for a lantibiotic, a lanthionine-containing antimicrobial peptide (Extended Data Fig. 5b–d, Supplementary Information Table 4, 5). Lanthionines are formed by enzymatic dehydration of serine or threonine residues that cyclize with neighboring cysteine residues 18, 19. Nisin-A, a lantibiotic expressed by Lactococcus lactis 20,21, binds lipid II and inhibits peptidoglycan synthesis and also forms a membrane pore complex 22. Comparison of the BPSCSK and L. lactis lantibiotic operons (Lan and Nis, respectively) revealed homologous sequences for all genes except dissimilar signal peptidase sequences (Fig. 2a, Supplementary Information Table 5). Though gene organization and number within Lan and Nis operons differ, a lantibiotic operon recently characterized in Blautia obeum is similar to BPSCSK’s 23. Notably, BPSCSK encodes five lantibiotic precursor genes (LanA1–5), in contrast to one encoded by the Nis operon (NisA). The first four precursor sequences (LanA1–4) are identical, while the fifth precursor (LanA5) encodes a similar but non-identical sequence (Supplementary Information Table 4). LanA1–4 and NisA belong to a lantibiotic subset harboring the gallidermin superfamily domain, which conserves two N-terminal lanthionine rings enabling lipid II binding 24 and inhibitory activity 22.
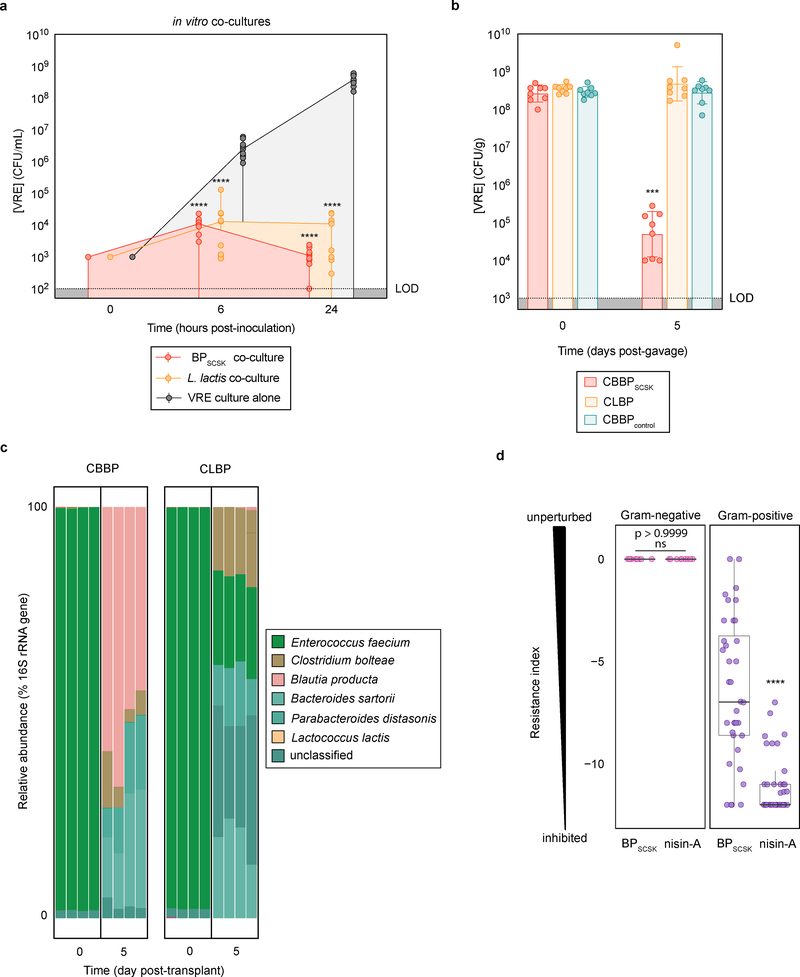
Figure 2 |. BPSCSK colonizes the GI tract and broadly inhibits Gram-positive pathogens while preserving some commensal species.
a, VRE was co-cultured in vitro with Lactococcus lactis or BPSCSK (n = 9 biologically independent samples/3 independent experiments) and growth was monitored. b, antibiotic-treated, VRE-dominated mice (n = 12 mice/3 independent experiments) received an oral gavage containing CBBP, CLBP, or CBBPcontrol. VRE colonization was monitored by CFU quantification in fecal samples. c, the microbiota composition determined by metagenomic sequencing of 16S rRNA genes from fecal samples collected from mice treated with CBBP or CLBP. d, Culture broth was conditioned with proteins precipitated from BPSCSK, BPcontrol, or commercial nisin-A and serially diluted. The minimal inhibitory concentration (MIC) was determined for 158 strains from a commensal biobank by calculating the highest dilution factor that inhibited growth (n = 2 biologically independent samples/2 independent experiments). The resistance index is a ratio between MIC of BPcontrol-conditioned media over the MIC of BPSCSK or nisin-A-conditioned media. VRE (ATCC 700221) was used for experiments shown in panels a-c. All statistical analyses were performed using the Mann-Whitney rank sum test (two-tailed) comparing experimental conditions to a negative control (a,b) or between two experimental conditions (d). **** p-value < 0.0001, *** p-value < 0.001. Center values (median) (a); center values (geometric mean), error bars (geometric s.d.) (b); center values (median), error bars (1.5 * interquartile range) (d).
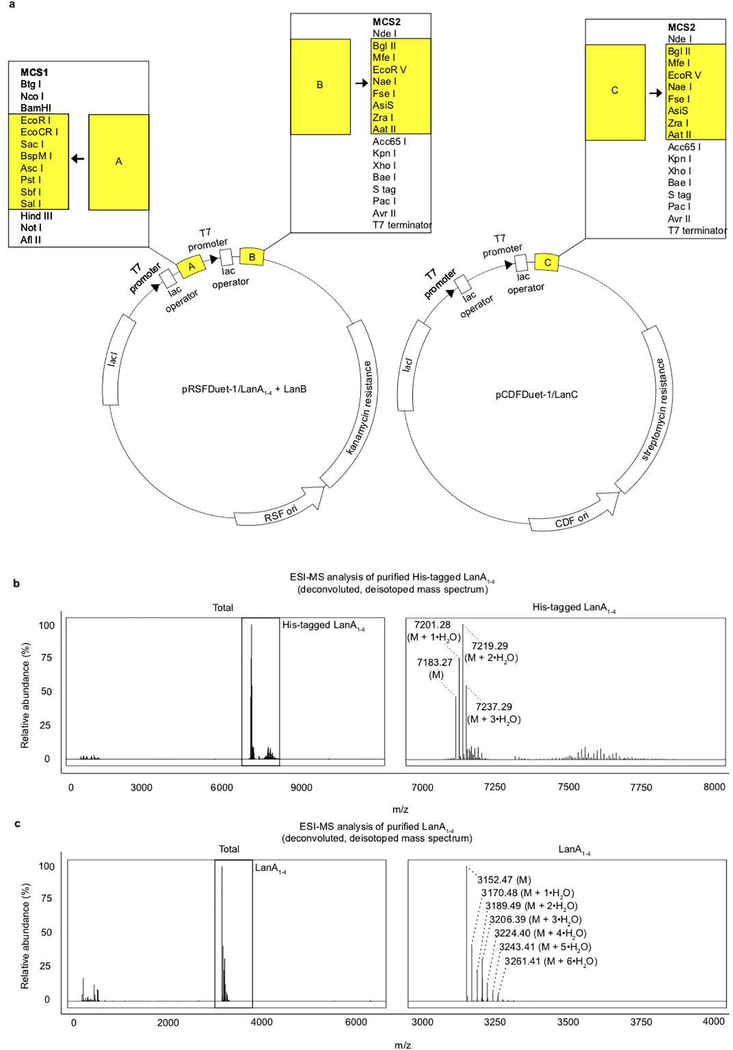
Nisin-A and other gallidermin superfamily lantibiotics carry a net positive charge, enabling electrostatic interactions with the cell membrane and lipid II 25. Nisin-A and BPSCSK’s inhibitory factor elute similarly during cation exchange chromatography, suggesting both carry a positive charge (Extended Data Fig. 5e). Additionally, nisin-A and BPSCSK’s inhibitory factor are resistant to heat and proteases, a characteristic of lantibiotics (Extended Data Fig. 5f). Methods to edit the genome of Blautia producta are lacking, so we pursued a gain-of-function approach and heterologously expressed LanA1–4 in E. coli (Extended Data Fig. 6a,b, Supplementary Information Table 6), purified it to homogeneity, and validated it by mass spectrometry (Extended Data Fig. 6c). VRE was similarly inhibited by addition of the purified BPSCSK LanA or commercial nisin-A (Fig. 1c).
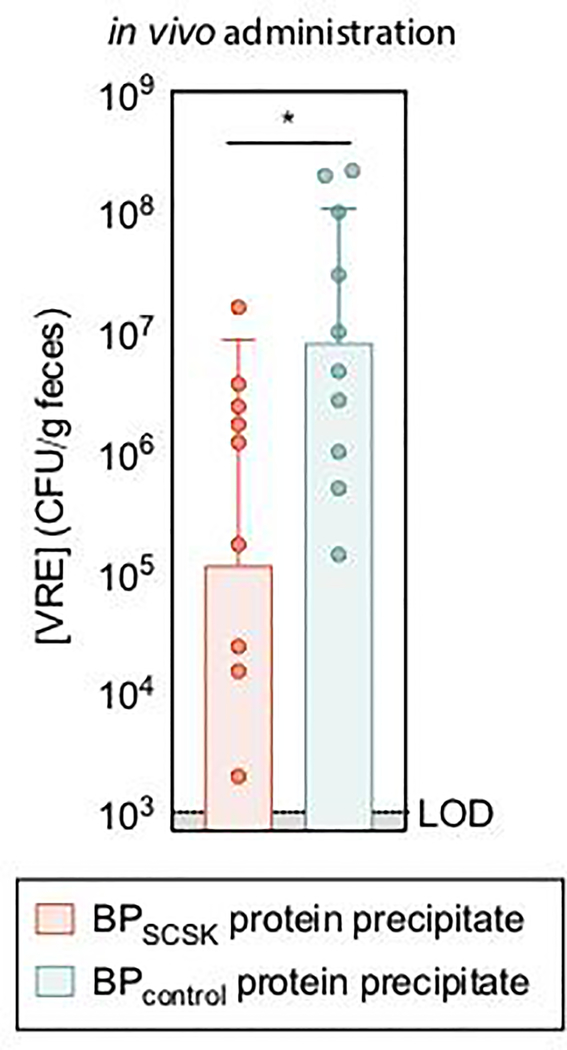
RNA-Seq of cecal contents from antibiotic-treated mice colonized with CBBP (Fig. 1d) demonstrated that, relative to BPSCSK’s overall transcriptome, precursor lantibiotic transcripts and associated immunity genes were abundant (> 95th percentile), while genes involved in post-translational modification of the precursor lantibiotic were expressed to a lesser degree. Oral administrations of proteins precipitated from BPSCSK cultures, but not BPcontrol, reduced VRE colonization in antibiotic-treated mice challenged with VRE (Extended Data Fig. 7), albeit to a lesser degree than CBBP administration. This likely reflects reduced lantibiotic concentrations due to intestinal absorption, metabolism, and intermittent administration. These findings demonstrate that BPSCSK encodes a lantibiotic that is highly expressed and inhibits VRE in vivo.
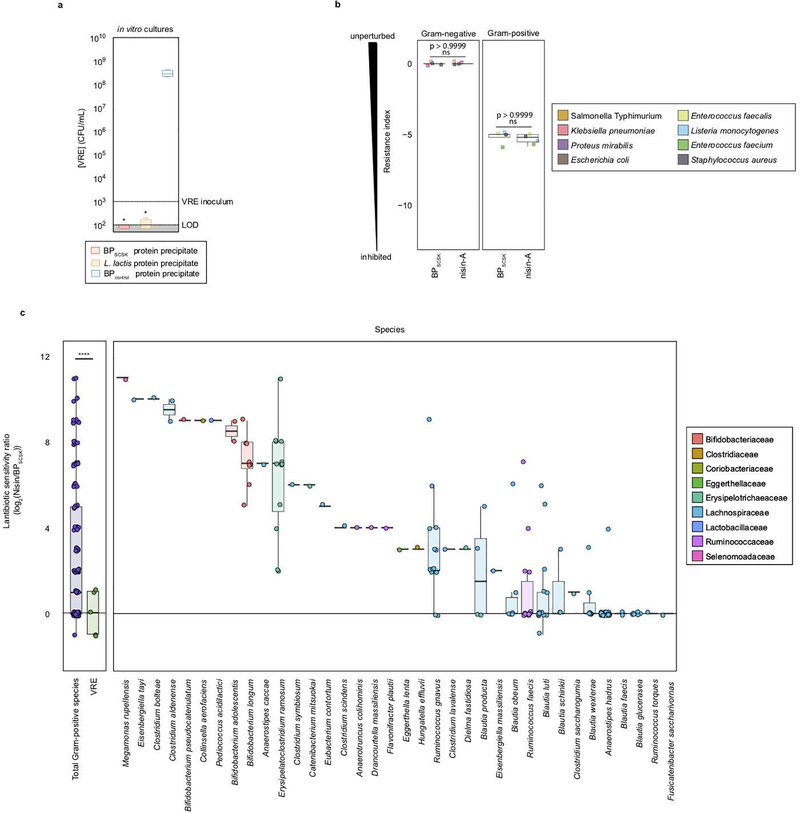
L. lactis is a lantibiotic-producing probiotic that, theoretically, could be used to reduce VRE colonization. VRE is inhibited upon co-culture with BPSCSK or L. lactis (Fig. 2a) and upon exposure to precipitated proteins from either species (Extended Data Fig. 8a). In contrast, in vivo VRE colonization was inhibited by CBBP but not when BPSCSK was replaced by Lactococcus lactis (CLBP) (Fig. 2b). While BPSCSK is prevalent in the microbiota following CBBP treatment (relative abundance > 25%), L. lactis was not detected following CLBP treatment (Fig. 2c). The failure of L. lactis to colonize the intestine likely explains its inability to reduce in vivo VRE density; L. lactis similarly does not colonize the porcine intestine or inhibit Listeria monocytogenes or Clostridium difficile in a human distal-colon model 26.
To characterize the antibacterial spectrum of the BPSCSK lantibiotic, we cultured 152 commensal strains obtained from human feces (Supplementary Information Table 7) with protein precipitated from BPSCSK or BPcontrol cultures or broth spiked with nisin-A diluted to the same minimal inhibitory concentration (MIC) against VRE as BPSCSK. The MIC was determined as the highest dilution that inhibited growth over 24 hours. Protein precipitates from BPSCSK-conditioned or nisin-A-spiked media, but not BPcontrol-conditioned media, inhibited Gram-positive, but not Gram-negative, bacterial strains. A resistance index comparing the MICs in BPcontrol conditioned media to BPSCSK or nisin-A conditioned media was used to quantify sensitivity of bacterial strains to both lantibiotics. The Gram-positive population demonstrated greater sensitivity to nisin-A-spiked media than BPSCSK-conditioned media (Fig. 2d). Several VRE strains and other Gram-positive nosocomial pathogens (Extended Data Fig. 8b) demonstrate comparable sensitivity to either conditioned media, but several Gram-positive commensal strains were more resistant to the BPSCSK lantibiotic than nisin-A, including members implicated in resistance to intestinal infections, such as Bifidobacterium longum and Pediococcus acidilactici 27, 28 (Extended Data Fig. 8c). Thus, the BPSCSK lantibiotic, relative to nisin-A, has a narrower spectrum of activity that targets VRE while preserving commensal bacteria.
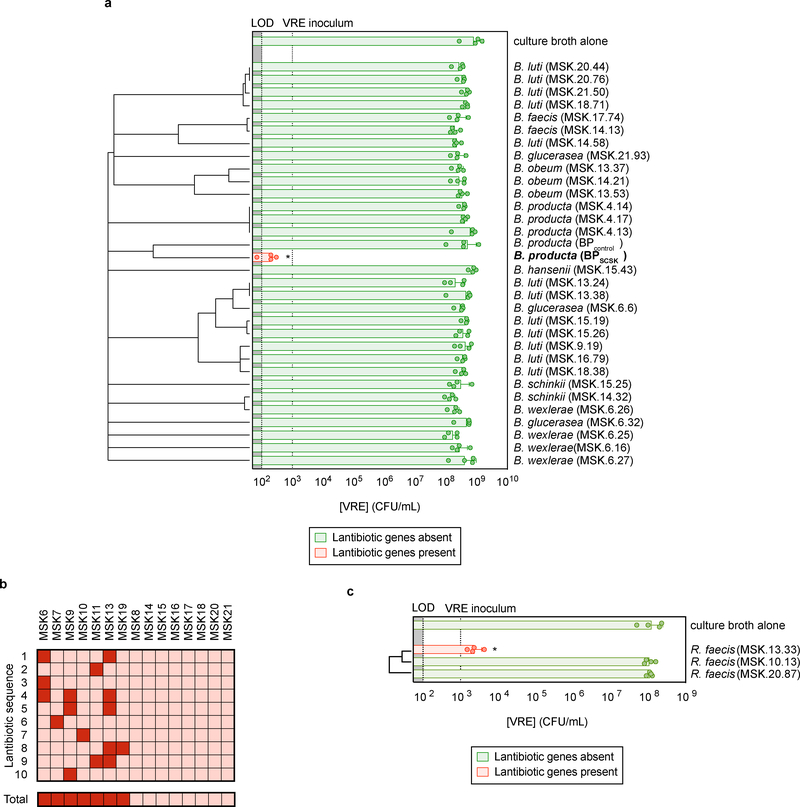
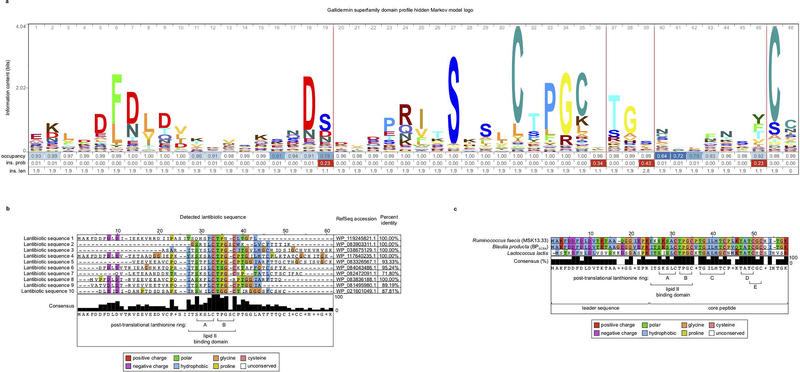
Among 32 Blautia isolates cultured from healthy-donor fecal samples, BPSCSK was the only strain that encoded a lantibiotic and inhibited VRE in vitro (Fig. 3a, Supplementary Information Table 1,2). To determine the prevalence of lantibiotic genes in the human intestinal microbiome, we shotgun sequenced fecal samples collected from fifteen healthy donors and identified lantibiotic genes and homologs containing the gallidermin superfamily domain (Extended Data Fig. 9a) in seven of fifteen samples, with different sequences within and between samples (Fig. 3b, Extended Data Fig. 9b).
Figure 3 |. Lantibiotic genes are present in human microbiomes of healthy individuals and gut resident, lantibiotic-producing species inhibit VRE.
a, Microbiota-derived Blautia species were whole genome sequenced, assembled, annotated, and mined for lantibiotic precursor sequences. VRE was inoculated in conditioned-media from 39 strains (n = 4 biologically independent samples/4 independent experiments) and monitored for growth. b, Lantibiotic detection from shotgun sequencing of human fecal samples (n = 15 fecal samples). c, 421 commensal biobank isolates were whole genome sequenced, assembled, annotated, and mined for lantibiotic precursor sequences to identify a strain of Ruminococcus faecis encoding a homologous lantibiotic. VRE was inoculated in conditioned-media from 3 strains of R. faecis cultures (n = 4 biologically independent samples/4 independent experiments) with or without detected lantibiotic genes and VRE growth was monitored 8 hours post-inoculation. VRE (ATCC 700221) was used in experiments shown in panels a, c. All statistical analyses were performed using the Mann-Whitney rank sum test (two-tailed) comparing experimental conditions to a negative control. * p-value < 0.05 (= 0.0286). Center values (geometric mean), error bars (geometric s.d.) (a, c).
We next mined the genomes of commensal biobank isolates for the gallidermin superfamily domain and identified one additional Clostridiales species, Ruminococcus faecis, which encodes a similar lantibiotic and inhibits VRE in vitro, while R. faecis strains that did not encode a lantibiotic did not inhibit VRE (Fig. 3c, Extended Data Fig. 9c, Supplementary Information Table 1). Although only a minority of cultured commensal bacteria encodes lantibiotics, it remains unclear whether this reflects their paucity in the microbiota or their relative resistance to in vitro culture.
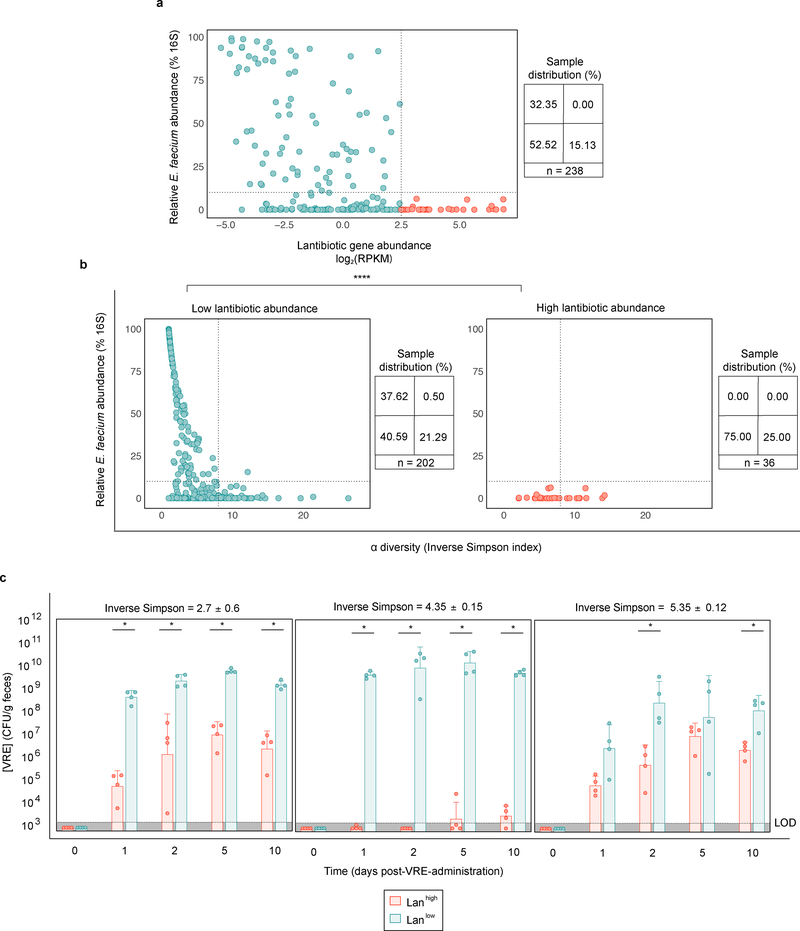
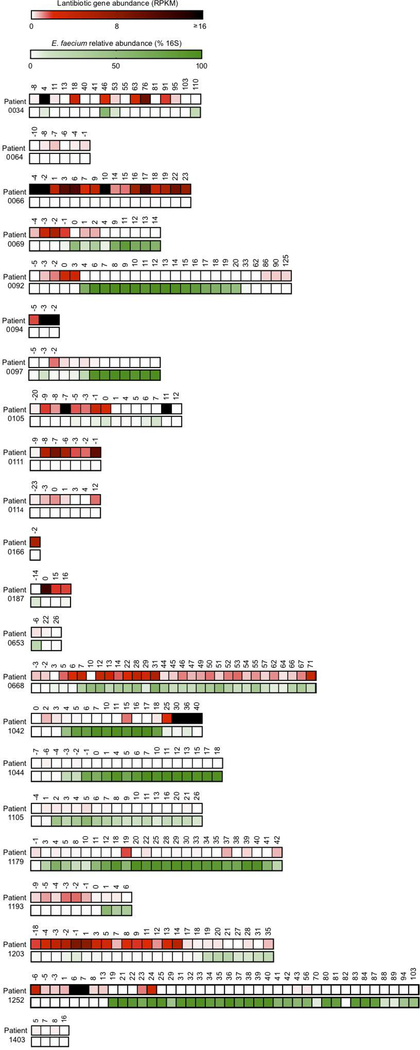
Patients undergoing allogeneic hematopoietic cell transplantation (allo-HCT) frequently have intestinal domination by VRE 12, 13, 29. From a biobank of longitudinally collected fecal samples, we identified 238 samples from 22 patients with a range of E. faecium densities and found lantibiotic gene abundance inversely correlated with the relative abundance of Enterococcus faecium (Spearman correlation coefficient = −0.43, p-value = 2.08e−10) (Fig. 4a). Samples with high lantibiotic abundance (Lanhigh > 85th percentile) consistently had low E. faecium abundance (< 10% 16S relative abundance), and were detected in half of patients (Extended Data Fig. 10). In Lanhigh and Lanlow settings, 25 and 21%, respectively, had high microbiota diversity (inverse Simpson index ≥ 8) and low E. faecium abundance, suggesting diversity compensates for low lantibiotic-gene abundance by parallel, lantibiotic-independent inhibitory mechanisms (Fig. 4b). However, nearly half of Lanlow samples with low diversity (inverse Simpson index < 8) had high E. faecium abundance (≥ 10% 16S relative abundance); low diversity decreases the likelihood, but some commensal species still provide lantibiotic-independent CR against E. faecium. In contrast, Lanhigh samples had low E. faecium abundance (p-value < 10−6) despite low diversity, consistent with the notion that lantibiotic gene abundance in the microbiome contributes to CR against E. faecium.
Figure 4 |. Enrichment of lantibiotic genes correlates with reduced Enterococcus faecium in patient fecal samples.
a,b Longitudinally collected fecal samples (n = 238 biologically independent samples) from twenty-two allo-HCT patients were shotgun sequenced. The relative Enterococccus faecium abundance determined by 16S rRNA was plotted against lantibiotic gene abundance (Spearman correlation coefficient = −0.43, p-value = 2.08e−10) (a). Samples were then stratified by lantibiotic abundance, and the relative E. faecium abundance was plotted against microbiota α diversity (b). c, fecal microbiota transplants were performed on germ-free mice using diversity-matched microbiomes containing either high or low lantibiotic gene abundance. One week following FMT administration, the ex-germ-free mice were orally gavaged with VRE and colonization was monitored by quantifying VRE from fecal samples. VRE (ATCC 700221) was used for experiments shown in panel c. Low lantibiotic abundance ≤ 22.5 < high lantibiotic abundance (RPKM); low E. faecium abundance ≤ 10 < high E. faecium abundance (% relative 16S); low α diversity ≤ 8 < high α diversity (inverse Simpson index). All statistical analyses were performed using the Mann-Whitney rank sum test (two-tailed) comparing two experimental conditions. *p- value < 0.05 (= 0.0286), **** p-value < 0.0001.
To determine whether low diversity Lanhigh microbiomes can resist VRE colonization, we identified diversity-matched Lanhigh and Lanlow samples and colonized germ-free mice prior to VRE challenge (Fig. 4c, Supplementary Information Table 8). Regardless of diversity, Lanhigh samples consistently reduced VRE colonization compared to Lanlow samples, suggesting lantibiotics in the GI tract provide colonization resistance.
Microbiota-mediated CR remains incompletely defined and restoring CR during antibiotic-induced dysbiosis remains an important goal. BPSCSK belongs to a small subset of commensals that secrete lantibiotics, and therefore can influence the community structure of the microbiota. A potential clinical role for lantibiotics is supported by a recent report using lantibiotic-producing commensal Staphylococcus species on the skin to provide colonization resistance against Staphylococcus aureus 30. Understanding the mechanisms by which the microbiota confers CR may lead to the development of novel therapies to repair dysbiosis, thereby reducing susceptible patients’ risk of colonization by antibiotic-resistant pathogens.
Methods
Bacterial strains
Vancomycin-resistant E. faecium purchased from ATCC (stock number 700221) was used for all experiments unless otherwise stated. Vancomycin-resistant E. faecalis strains used were V583 and MH.SK1. Listeria monocytogenes strains used were 10403S and 13932. Salmonella Typhimurium strains used were SL1344 and LT2. The vancomycin-resistant E. faecium strains: MH.0139G, MH.0151F, MH.1107, MH.1326H; the vancomycin-resistant E. faecalis strain -- MH.SK1; the Clostridium difficile strain -- MH.BBL2; the strains of methicillin-resistant Staphylococcus aureus -- MH.SK1, MH.SK2; the Klebsiella pneumoniae strains -- MH189, MH258; the Escherichia coli strains -- MH.T18, MH.X43; the Proteus mirabilis strains -- MH.42F, MH.43A were all isolated from patients at the Memorial Sloan Kettering Cancer Center. All gut commensal strains used were isolated from healthy-donor fecal samples and are listed in Supplementary Information Table 7.
Mouse husbandry
All experiments using wild type mice were performed with C57BL/6J female mice, 6–8 weeks old purchased from Jackson Laboratories. Rag2−/−Il2rg−/− mice were purchased from Taconic Farms, and subsequently bred in-house. Germ-free mice were bred in-house in germ-free isolators. All mice were housed in sterile, autoclaved cages with irradiated food and acidified, autoclaved water. Mouse handling and weekly cage changes were performed by investigators wearing sterile gowns, masks, and gloves in a sterile biosafety hood. All animals were maintained in a specific-pathogen-free facility at Memorial Sloan Kettering Cancer Center Animal Resource Center. After co-housing for at least 2 weeks, mice were individually housed and randomly assigned to experimental groups. All animal experiments were performed at least three times unless otherwise noted. Experiments were performed in compliance with Memorial Sloan-Kettering Cancer Center institutional guidelines and approved by the institution’s Institutional Animal Care and Use Committee.
Mouse antibiotic administration
Mice were administered ampicillin (0.5 g/L; Fisher Scientific) in the drinking water for 5 days. Ampicillin was changed every three days. Antibiotic administration ceased after the initial administration of commensal bacteria (after 5 days) unless stated otherwise.
Bacterial in vitro broth culture conditions
The culture broth used for all cultures was pre-reduced brain heart infusion broth supplemented with yeast extract (5 g/L) and L-cysteine (1 g/L). The culture conditions were 37 °C and anaerobic unless otherwise stated.
VRE CFUs enumeration
VRE CFUs were enumerated from samples by serial dilution in PBS and plating on BD Enterococcosel agar supplemented with vancomycin (8 μg/mL; Novagen) and streptomycin (100 μg/mL; Fisher Scientific).
VRE in vitro co-culture inhibition experiments
A frozen aliquot of each bacterial strain was inoculated and cultured in broth for 24 h. The resulting cultures were plated as lawns on pre-reduced Columbia agar supplemented with 5% sheep blood and cultured anaerobically at 37 °C for 24 h, harvested and resuspended in pre-reduced PBS (108 CFUs/mL). Using these stocks, VRE (103 CFUs/mL) was co-cultured with each candidate bacterium (106 CFUs/mL) for 6, 24, and 48 h. VRE CFUs were enumerated at each time point. The co-cultured candidate bacterium CFUs were enumerated at each time point by anaerobically plating serial dilutions of the culture on pre-reduced Columbia agar supplemented with 5% sheep blood and calculating the difference from the enumerated VRE CFUs.
VRE in vitro supernatant inhibition experiments
A frozen aliquot of each bacterial strain was inoculated and cultured for 24 h. Culture supernatant was collected by centrifugation at 8000 × g for 5 min and subsequent filtration (0.22 μm). Supernatants were diluted 1:2 with culture broth. VRE was subsequently inoculated (103 CFUs/mL) and cultured for 6, 24, and 48 h. VRE CFUs were enumerated at each time point.
Fluorescent in situ hybridization
Intestinal tissues with luminal contents were carefully excised and fixed in freshly made nonaqueous Methacarn solution (60% methanol, 30% chloroform and 10% glacial acetic acid) as previously described 31, 32 for 6 hours at 4°C. Tissues were washed in 70% ethanol, processed with Leica ASP6025 processor (Leica Microsystems) and paraffin-embedded by standard techniques. 5-μm sections were baked at 56°C for 1 hour prior to staining. Tissue sections were deparaffinized with xylene (twice, 10 min each) and rehydrated through an ethanol gradient (95%, 10 min; 90%, 10 min) to water. Sections were incubated with a probe specific to BPSCSK ([Alexa546]-TATAAGACTCAATCCGAAGAGATCAT-[Alexa546]) at 50 °C for 3 hours. Probes were diluted to 5ng/μl in 0.9M NaCl, 20mM Tris-HCl at pH7.2 and 0.1% SDS prior to use. Sections were later washed twice in 0.9M NaCl, 20mM Tris-HCl at pH 7.2 (wash buffer) for 10 min and counterstained with Hoechst (1:3000 in wash buffer) for nuclear staining.
VRE in vivo decolonization experiments
Antibiotic-treated mice or germ-free mice were orally gavaged with VRE (104 CFUs in 200 μl PBS). Three days after VRE inoculation, mice were orally gavaged with isolates from a candidate bacteria consortium (108 CFUs/isolate in 200 μl PBS) or vehicle (PBS). VRE colonization was monitored by enumerating VRE CFUs from fecal pellets at the stated time points. Fecal pellets were resuspended in PBS to a normalized concentration (100 mg/mL) for VRE CFU enumeration. Mice were screened for pre-existing VRE colonization by selective plating prior to proceeding forward with all experiments.
VRE ex vivo inhibition experiments
Antibiotic-treated mice were orally gavaged with isolates of a given bacteria consortium (108 CFUs/isolate), vehicle (PBS), or VRE (108 CFUs) in 200 μl PBS. Seven days after inoculation, content from the cecum was harvested and resuspended in pre-reduced PBS to a normalized concentration (100 mg/mL). Supernatant from cecal content suspensions were collected by centrifugation at 8000 × g for 5 min and subsequent filtration (0.22 μm). VRE (103 CFUs/mL) was inoculated and cultured anaerobically at 37 °C for 6 h, and VRE CFUs enumerated.
Ammonium sulfate precipitation experiments
A frozen aliquot of each bacterium was inoculated and cultured to late log phase at 37 °C unless stated otherwise. Lactococcus lactis was cultured to late log phase at 25 °C. The resulting culture supernatants were collected by centrifugation at 8000 × g for 5 min and subsequent filtration (0.22 μm). To collect 0–45% fractions, ammonium sulfate was added to 45% saturation and equilibrated overnight stirring at 4 °C. The precipitate was collected by centrifugation at 20,000 × g for 20 min, dissolved in PBS, and dialyzed (MWCO = 3 kDa) against PBS overnight at 4 °C. To collect 45–90% fractions, ammonium sulfate was added to 90% saturation to the 0–45% fraction supernatants. The precipitate was collected as described for 0–45% fractions. Total protein concentrations were normalized (2 mg/mL) and diluted in culture broth (20 μg/mL). VRE was inoculated (103 CFUs/mL) and cultured for 6 and 24 h. VRE CFUs were enumerated at each time point.
Lantibiotic gene expression in vivo experiments
Antibiotic-treated mice were orally gavaged with CBBP (108 CFUs/isolate in 200 μl). Two weeks after inoculation, the content from the cecum was harvested and flash-frozen. The samples were subsequently RNA extracted, sequenced, and analyzed as described below.
Construction of pRSFDuet-1/LanA+LanB and pCDF-1/LanC
Construction of these expression vectors were based on previous methodology 33, 34. Custom gene synthesis of modified fragments of pRSFDuet-1 and pCDF-1 were generated (IDT) where the precursor sequence LanA and the dehydratase LanB were inserted into multiple cloning site (MCS) 1 and MCS 2 respectively in pRSFDuet-1; the cyclase LanC was inserted into MCS 2 in pCDF-1. The respective vector backbones, excluding the regions analogous to the modified gene fragments containing lantibiotic gene inserts described earlier, were linearized by inverse PCR amplification using linear_pDuet-1F (5’- CGAGTCTGGTAAAGAAACCGCTG-3’) and linear_pRSFDuet-1R (5’- GATCCTGGCTGTGGTGATGATGGT-3’) for pRSFDuet1, and linear_pDuet-1F and linear_pCDFDuet-1R (5’- TTCTTATACTTAACTAATATACTAA-3’) for pCDFDuet-1. The modified gene fragments containing the inserts were PCR amplified. For pRSFDuet-1 inserts, the first fragment, pRSFDuet-1.MCS1-gblock, was amplified using gblock_pRSFDuet-1.MCS1F (5’- ACCATCATCACCACAGCCAGGAT-3’) and gblock_pRSFDuet-1.MCS1R (5’- AAAAACTTTTGTAAATCGAATACTGATTTCTTCTGC-3’). The second fragment, pRSFDuet-1.MCS2-gblock, was amplified using gblock_pRSFDuet-1.MCS2F (5’- AGAAATCAGTATTCGAT-3’) and gblock_pDuet-1.MCS2R (5’- AGCAGCGGTTTCTTTACCAGACTCG-3’). For the pCDFDuet insert, the gene fragment was amplified using gblock_pCDFDuet-1.MCS2F (5’- TTAGTATATTAGTTAAGTAT-3’) and gblock_pDuet-1.MCS2R. The gene fragments were cloned into the linearized vector backbones using In-Fusion HD Cloning Plus (Takara). Stellar competent cells (Takara) were transformed with the fused vectors by heat shock and plated on selective plates at 37 °C for 16 h. The pRSFDuet-1/LanA+LanB transformants were selected on luria broth (LB) agar supplemented with kanamycin (30 μg/mL), and pCDFDuet-1 transformants were selected on LB agar supplemented with streptomycin (50 μg/mL) for pCDFDuet-1/LanC. Colonies containing each vector were inoculated in LB supplemented with the respective antibiotics for selection and cultured for 10 h at 37 °C, followed by isolation of the plasmids using a Qiaprep Spin Miniprep Kit (Qiagen). The sequences of the resulting plasmids were confirmed by DNA sequencing. The sequences of the lantibiotic genes are listed in Supplementary Information Table 4, and the custom gene fragment sequences are listed in Supplementary Information Table 6.
Overexpression and purification of lantibiotic
These were performed as previously described 33, 34. Briefly, chemically competent BL21(DE3) cells were co-transformed with pRSFDuet-1/LanA+LanB and pCDFDuet-1/LanC. Overnight cultures grown from a single colony transformant were used as an inoculum for larger scale cultures in terrific broth medium containing 30 mg/L kanamycin and 50 mg/L streptomycin at 37 °C until the OD600nm reached between 0.6 – 0.8. The cultures were then induced with 1 mM IPTG and incubated at 18 °C for an additional 16 h. The cells were harvested by centrifugation at 8,000 × g for 15 min. The cell pellets corresponding to 1.5 L of culture were resuspended in 45 mL of start buffer (20 mM Tris, 500 mM NaCl, 10% glycerol, protease inhibitor cocktail from Roche, pH 8.0). The suspensions were chilled on ice and lysed using a Branson ultrasonic homogenizer (35% amplitude, 10 s pulse, 10 s pause for total 10 min). The lysate supernatant was collected by centrifugation at 30,000 × g for 30 min at 4 °C. Chromatographic purification was performed using an AKTA pure chromatography system at 4 °C. The lysate supernatant was loaded onto a HiTrap HP nickel affinity column. The column was washed with 75 mL (start buffer + 30 mM imidazole) and recombinant product eluted in 25 mL (start buffer + 1 M imidazole). The His-tagged lanthipeptide eluate was loaded on a Luna® 10 μm C8(2) 100 Å, LC Column 250 × 4.6 mm and separated with 80 min linear gradient of 0–80%. Buffer A was 0.1% TFA in H2O and buffer B was 90% ACN, 20% buffer A. The LanA1–4 peptide itself and its hydration + 18 Da series eluted in fractions 40–50 (Extended Data Fig. 6b) with the maximum for fully dehydrated product at 45%. Fractions 43–46 were lyophilized and the concentration of the solution was measured by BCA. We obtained approximately 1mg of product from bacteria in 1.3L of media. The His-tag and leader sequence were removed by trypsin digestion for 2 hours at 25 °C. The digestion was stopped by adding formic acid to 1% and the product was separated by reverse phase chromatography on a 0–80% linear gradient as described above. The resulting product was checked by ESI-MS and the spectrum was deisotoped and deconvoluted by Xtract algorithm in Xcalibur. The proteolytic fragment corresponding to mature LanA1–4 was observed: 3152.45. VRE was inoculated in culture broth supplemented with the purified lantibiotic (100 μM) and cultured for 24 h. VRE CFUs were subsequently enumerated.
DNA extraction
DNA was extracted using a phenol-chloroform extraction technique with mechanical disruption (bead-beating). Briefly, a frozen aliquot of approximately 100 mg per sample was suspended, while frozen, in a solution containing 500 μl of extraction buffer (200 mM, pH 8.0; 200 mM NaCl; and 20 mM EDTA), 210 μl of 20% SDS, 500 μl of phenol/chloroform/isoamyl alcohol (25:24:1), and 500 μl of 0.1-mm-diameter zirconia/silica beads (BioSpec Products). Microbial cells were lysed by mechanical disruption with a bead beater (BioSpec Products) for 2 min, followed by 2 rounds of phenol/chloroform/isoamyl alcohol extraction. After extraction, DNA was precipitated in ethanol, re-suspended in 200μl of TE buffer with RNase (100 mg/mL), and further purified with QIAamp mini spin columns (Qiagen).
Microbial composition by 16S rRNA gene sequencing
Universal bacterial primers -- 563F (5’-nnnnnnnn-NNNNNNNNNNNN-AYTGGGYDTAAAGNG-3’) and 926R (5′-nnnnnnnn-NNNNNNNNNNNN-CCGTCAATTYHTTTRAGT-3), where ‘N’s represent unique 12-base pair Golay barcodes and ‘n’s represent additional nucleotides to offset the sequencing of the primers -- were used to PCR-amplify the V4-V5 hypervariable region of the 16S ribosomal RNA (rRNA) gene. The V4-V5 amplicons were purified, quantified, and pooled at equimiolar concentrations before ligating Illumina barcodes and adaptors using the Illumina TruSeq Sample Preparation protocol. The completed library was sequenced using the MiSeq Illumina platform 35. Paired end reads were merged and demultiplexed. The UPARSE pipeline 36 was used for error filtering using the maximum expected error (Emax = 1) 37, clustering sequences into operational taxonomic units (OTUs) of 97% distance-based similarity, and identifying and removing potential chimeric sequences using both de novo and reference-based methods. Singleton sequences were removed prior to clustering. A custom Python script incorporating nucleotide BLAST, with NCBI RefSeq 38 as reference training set, was used to perform taxonomic assignment to the species level (E-value ≤ 1e−10) using representative sequences from each OTU.
Whole genome sequencing, assembly, and annotation
An overnight culture grown from a single colony in culture broth was DNA extracted and sequenced using the Illumina MiSeq platform. Purified DNA was sheared using a Covaris ultrasonicator and prepared for sequencing with a Kapa library preparation kit with Illumina TruSeq adaptors to create 300 × 300 bp nonoverlapping paired-end reads. Raw sequence reads were filtered (Phred score ≥ 30, 4 bp sliding window) using Trimmomatic 39 (v0.36). Trimmed reads were assembled into contigs and annotated with putative open reading frames using the assembly and annotation services in PATRIC 40 (v3.5.25).
Metagenomic sequencing
DNA was extracted, sheared, and libraries prepared as described for whole genome sequencing. Sequencing was performed using the Illumina HiSeq platform (Illumina) with a paired-end 100 × 100 bp kit in pools targeting 20 – 30 million reads per sample.
RNA extraction
Samples were extracted using an acidic phenol chloroform protocol. Briefly, approximately 100 mg per sample were suspended in 700μl of RNA. The suspension was homogenized using a sterile RNase-free spatula and incubated at 4 °C overnight. Samples were pelleted by centrifugation at 13,000 × g for 10 min and resuspended in 200 μl of RNA Extraction Buffer supplemented with proteinase K (1 mg/mL) that was heat-activated at 50 °C for 10 min. Samples were incubated at room temperature for 10 min and vortexed every 2 min. 300 μl of Qiagen RLT Plus Buffer (Qiagen) with beta-mercaptoethanol (1%) was added to each sample, vortexed, and incubated for 5 min at room temperature. Samples were then transferred to a sterile bead beating tube with 500 μl of 0.1 mm glass beads and 500 μl of acidic phenol:chloroform:isoamyl. Mechanical lysis was performed by bead beating the samples for 3 min (BioSpec Products), followed by one round of acidic phenol chloroform extraction and one round of chloroform extraction. RNA was precipitated with 50 μl of 3 M ammonium acetate and 500 μl of 100% isopropanol and incubated at −20 °C overnight. RNA was pelleted by centrifugation at 13,000 × g for 20 min at 4 °C and washed with 450 μl of 70% ethanol. Ethanol wash was repeated, and the pellet was allowed to air dry at room temperature for 5 min. The pellet was then dissolved in 50 μl of RNase-free water. RNA samples were purified using RNAClean XP (Agencourt), DNA contaminants were removed using TURBO DNA-Free kit (Life Technologies), and ribosomal RNA removed using Ribo-Zero rRNA Removal Kit (Illumina). Following ribosomal RNA depletion, RNAClean XP purification was repeated.
RNA sequencing and analysis
RNA sample libraries were prepared using the TruSeq Stranded mRNA protocol (Illumina) and sequenced using the Illumina Miseq platform (Illumina). Raw sequence reads were filtered using Trimmomatic (v0.36), aligned to BPSCSK’s genome using bowtie2 (v2.3.4.1), assigned to genes using featureCounts (v1.6.1), and converted to normalized gene counts using DeSeq2 (v1.20.0).
Oral administration of BPSCSK protein precipitate
Antibiotic-treated mice were orally gavaged with BPSCSK or BPcontrol protein precipitate (400 μg). Three hours later, VRE (104 CFUs in 200 μl PBS) was orally gavaged, followed by oral administrations of BPSCSK or BPcontrol protein precipitate every three hours for twelve hours. VRE colonization was monitored by enumerating VRE CFUs from fecal pellets 12 hours post-VRE-gavage. Fecal pellets were resuspended in PBS to a normalized concentration (100 mg/mL) for VRE CFU enumeration. Mice were screened for pre-existing VRE colonization by selective plating prior to proceeding forward with all experiments.
Healthy-donor fecal isolate collection
Fecal samples were collected from healthy human donors (n = 15) and transferred to an anaerobic chamber within 1 hour of collection. All culture conditions were performed anaerobically on pre-reduced Columbia agar supplemented with 5% sheep blood at 37 °C. Samples were resuspended in pre-reduced PBS and serially diluted with three 10-fold serial dilutions. The dilutions were streaked on plates and cultured for 72 h. Individual colonies were selected and streaked onto fresh plates and cultured for 48 h. Single colonies were then resuspended in 50 μl of pre-reduced PBS and 10 μl was streaked as a lawn onto a fresh plate and cultured for 48 h. Each isolate was harvested from culture and stocks were stored in pre-reduced PBS with 10% glycerol at 80 °C. Colony PCR was performed using 2 μl of the above 50 μl single colony suspension in PBS as a template. The 16S rRNA gene was amplified with primers 8F (5’-AGAGTTTGATCCTGGCTCAG-3’) and 1492R (5’-GGTTACCTTGTTACGACTT-3’). Amplicons were purified with the Qiaquick PCR Purification Kit (Qiagen) and sanger sequenced (Eton Biosciences) with a panel of 6 primers: 8F (5’-AGAGTTTGATCCTGGCTCAG-3’), 533F (5’-GTGCCAGCAGCCGCGGTAA-3’), 16S.1100.F16 (5’-CAACGAGCGCAACCCT-3’), 1492R (5’-GGTTACCTTGTTACGACTT-3’), 907R (5’-CCGTCAATTCMTTTRAGTTT-3’), 519R (5’-GWATTACCGCGGCKGCTG-3’). Sanger sequences were quality filtered and assembled into a consensus sequence using custom Python scripts. Species identification was performed with nucleotide BLAST against the NCBI RefSeq database.
Patient stool collection
Patients were enrolled in a prospective fecal collection protocol, where fecal samples were routinely collected during the initial transplant hospitalization and stored in a biospecimen bank, as described previously 13. The patient was part of a study consisting of adult patients (≥ 18 years) undergoing allogeneic hematopoietic stem cell transplantation at Memorial Sloan Kettering Cancer Center (MSKCC). The study was approved by the institutional review board at MSKCC. All study patients provided written informed consent for IRB-approved biospecimen collection and analysis (protocols 09–141, 06–107). The study was conducted in accordance with the Declaration of Helsinki.
Lantibiotic gene mining
The lantibiotic genes were discovered in BPSCSK’s genome using antiSMASH 41 and BAGEL3 42 and confirmed to be homologous to known lantibiotic gene sequences using BLASTp alignment (Supplementary Information Table 5). Lantibiotic sequences were identified from metagenomic sequences using DIAMOND (v0.9.22) 43 to align reads (e-value < 0.001) to a custom database derived from the RefSeq nonredundant database (accessed August 2018), filtering only for lantibiotic genes containing the gallidermin superfamily domain. To identify RefSeq entries containing the gallidermin superfamily domain, a hidden Markov model profile was built according to NCBI’s Conserved Protein Domain Family entry for the gallidermin superfamily domain (accession # cl03420) by using pfam02052 and TIGR03731 hidden Markov model files and searching for RefSeq entries with these sequence patterns using HMMER (3.1b2) 44 (e-value < 10−5). Lantibiotic sequences were identified from whole genome sequenced genomes by assembling and annotating genomes as described previously. All open reading frames were searched for homology to the gallidermin superfamily domain using HMMER (3.1b2) 44.
Detected lantibiotic sequence assembly from metagenomic sequencing
Translated sequencing reads aligning to a RefSeq database entry were retrieved from the DIAMOND (v0.9.22) alignment output and sorted by the RefSeq entry sequence they aligned. All sequencing reads within a sorted group were multiple sequence aligned to each other using MUSCLE (v3.8.31) and the consensus sequence was used as the assembled, detected lantibiotic sequence.
Statistics
Statistical analyses were performed using R (v. 3.3.1) and GraphPad Prism (version 7.0a) software packages. The Mann-Whitney rank sum test (two-tailed) was used for comparisons of continuous variables between two groups with similar variances. No statistical methods were used to predetermine sample size. When possible, investigators were blinded during group allocation and outcome assessment (16S and metagenomic shotgun sequence collection, extraction, quantification, and analysis; enumeration of VRE in animal, ex vivo, and in vitro experiments). Data were visualized using bar plots with center values representing the geometric mean and error bars representing the geometric standard deviation, line graphs with points representing the geometric mean and error bars representing the geometric standard deviation, box plots with the center line representing the median, box limits representing the upper and lower quartiles and whiskers representing the range, and heatmaps with individual values contained in a matrix representing the mean. Spearman rank correlation tests (two-tailed) were used to find significant correlations between two continuous variables.
Data availability
Microbiome sequencing data are available from Bioproject with the accession number 394877.
Extended Data
Extended Data Figure 1 |. BPSCSK directly inhibits VRE through a contact-independent mechanism.
a-d, VRE was co-cultured with each CBBP isolate (n = 15 biologically independent samples/3 independent experiments) and growth was monitored. e, VRE was inoculated in conditioned-media from each CBBP isolate culture (n = 15 biologically independent samples/3 independent experiments). f-i, VRE was inoculated in conditioned-media from each CBBP isolate culture (−VRE), or each CBBP isolate co-cultured with VRE (+VRE) (n = 5 biologically independent samples/5 independent experiments) and growth was monitored. j, VRE was inoculated in conditioned-media from Blautia species cultures (n = 6 strains/15 biologically independent samples/3 independent experiments). VRE (ATCC 700221) was used in all experiments shown. Median, error bars (range) (a-e, j); Data point (geometric mean), error bars (geometric s.d.) (f-i). All statistical analyses were performed using the Mann-Whitney rank sum test (two-tailed) comparing experimental conditions to a negative control. **** p-value < 0.0001.
Extended Data Figure 2 |. BPSCSK, but not BPcontrol, reduces in vivo VRE colonization.
a,b, fecal samples collected from antibiotic- treated, VRE-dominated mice (n = 4 mice/1 independent experiment) orally gavaged with CBBP (a) or CBBPcontrol (b) were shotgun sequenced and the relative abundance of each species was determined by 16S rRNA. c,d, Antibiotic-treated (c) or germ- free (d) mice (n = 8 mice/2 independent experiments) were orally gavaged with VRE. Three days later, VRE-dominated mice received an oral gavage of CBBP or CBBPcontrol and VRE colonization was monitored by quantifying VRE in fecal samples. e-g, antibiotic-treated mice (n = 4 mice/1 independent experiment) were orally gavaged with different strains of clinical VRE isolates. Three days later, VRE-dominated mice received an oral gavage of CBBP or CBBPcontrol and VRE colonization was monitored by quantifying VRE in fecal samples. VRE strain 0151F is an E. faecium MLST type ST80 (e), VRE strain 1107 is an E. faceium MLST type ST412 (f), VRE strain V583 is an E. faecalis strain (g). VRE strains used were VRE (ATCC 700221) (a-d), VRE (0151F) (e), VRE (1107) (f), and VRE (V583) (g). *** p-value < 0.001. Center values (geometric mean), error bars (geometric s.d.). All statistical analyses were performed using the Mann-Whitney rank sum test (two-tailed) comparing two experimental conditions. *p- value < 0.05 (= 0.0286), ***p-value < 0.001.
Extended Data Figure 3 |. BPSCSK colonizes the large intestine.
Antibiotic-treated mice (n = 5 mice/1 independent experiment) were orally administered CBBP. Two weeks later, BPSCSK localization around the mucosal epithelium (top) and lumen (bottom) of the cecum were visualized by fluorescent in situ hybridization. Entire cecum cross-sections were hybridized with a probe specific for BPSCSK. Sections were counterstained with Hoechst dye to visualize the nuclei. Representative images are shown.
Extended Data Figure 4 |. CBBP mediates VRE colonization resistance by producing an inhibitor.
a, antibiotic-treated mice (n = 8 mice/2 independent experiments) received treatment by oral gavage containing CBBP, CBBPcontrol, PBS, or VRE. One week later, VRE was inoculated into the cecal content and growth was monitored 6 hours post-inoculation. b-i, antibiotic-treated mice received an oral gavage containing CBBP (n = 4 mice/1 independent experiment) or PBS (n = 3 mice/1 independent experiment). WT mice (n = 4 mice/1 independent experiment) were untreated and received no antibiotics. Four days later, RNA and proteins were extracted from the distal ileum, and RegIIIγ was measured by RT-qPCR (b) and western blot (c). Other genes involved in host- derived antimicrobial peptide production, including angiogenin-4 (Ang4) (d), defensin-1 (Def1) (e), amphiregulin (Areg) (f), and deleted in malignant brain tumors 1 (Dmbt1) (g); or inflammatory mediators including cytochrome b beta (cybb) (h) and calgranulin A (S100A8) (i) were measured by RT-qPCR. j, Rag2−/− γc−/− mice were treated with antibiotics, and orally gavaged with VRE. Three days later, VRE-dominated mice received CBBP or CBBPcontrol by oral gavage and VRE colonization was monitored by quantifying VRE in fecal samples. VRE (ATCC 700221) was used in experiments (a, j). All statistical analyses were performed using the Mann-Whitney rank sum test (two-tailed) comparing two experimental conditions. * p- value < 0.05 (= 0.0286), *** p-value < 0.001, ****p-value < 0.0001. Center values (median), error bars (range) (a); center values (mean), error bars (s.d.) (b, d-i); center values (geometric mean), error bars (geometric s.d.) (i).
Extended Data Figure 5 |. BPSCSK encodes for a lantibiotic.
a, VRE was inoculated in media conditioned with BPSCSK or BPcontrol culture protein precipitate fractions (n = 8 biologically independent samples/2 independent experiments), and monitored for growth. b,c, BPSCSK was whole genome sequenced, assembled, and annotated. b, schematic comparing the lantibiotic operon discovered in BPSCSK’s genome to the nisin-A operon from Lactococcus lactis. Gene functions are based on the characterization of homologous genes in the nisin operon. c, amino acid sequence alignment comparing BPSCSK’s lantibiotic precursor (LanA1–4) and nisin-A precursor (NisA). Sequence features are based on the characterization of nisin. d, the molecular formula for the mature, post-translationally modified BPSCSK LanA1–4 lantibiotic with a predicted mass of 3152.45 Da. Dhb, dehydrobutyrine; Dha, dehydroalanine; Abu, alpha-aminobutyric acid. e, media conditioned with BPSCSK or BPcontrol culture protein precipitates, or commercial nisin-A, were incubated with proteinase K for 3 h at 37 °C, boiled at 100 °C, or left untreated. The treated protein precipitate (n = 8 biologically independent samples/4 independent experiments) was serially diluted and VRE was inoculated and cultured for 24 h. The minimal inhibitory concentration (MIC) was the highest mean dilution where VRE inhibition was observed. c, Proteins were precipitated from BPSCSK or BPcontrol, or nisin-A spiked cultures and applied to a SP sepharose column. Each fraction was serially diluted and VRE was inoculated and cultured for 24 h to determine the MIC (n = 4 biologically independent samples/4 independent experiments). VRE (ATCC 700221) was used in experiments (a,e,f). All statistical analyses were performed using the Mann-Whitney rank sum test (two-tailed) comparing experimental conditions to a negative control. *** p-value < 0.001, ****p-value < 0.0001. Data points (geometric mean), error bars (geometric s.d.) (a); mean (e); center values (geometric mean), error bars (geometric s.d.) (f).
Extended Data Figure 6 |. Heterologous expression of BPSCSK LanA1–4 lantibiotic.
a, Genes involved in BPSCSK’s lantibiotic biosynthesis (His-tagged-LanA, LanB, and LanC) were cloned into expression vectors (pRSFDuet-1/LanA+LanB, pCDFDuet- 1/LanC) and heterologously expressed in E. coli. a, a schematic map indicating where each lantibiotic gene was inserted into the respective expression vectors. b,c, the His-tagged-LanA1–4 lantibiotic was purified from E. coli lysates by HiTrap HP nickel affinity chromatography and subsequently purified to homogeneity by reversed-phase high-performance liquid chromatography (RP-HPLC). The leader sequence and His-tag were removed by trypsin digestion to yield the mature lantibiotic. The purified His-tag product (b) and the purified mature lantibiotic (c) were analyzed by ESI-MS and the spectrum was deisotoped and deconvoluted using the Xtract algorithm in Xcalibur. The signals with labels correspond to the predicted mass of the His-tagged lantibiotic (M) and its incomplete forms that did not dehydrate all 9 residues (M + 1•H2O, M + 2•H2O, etc.).
Extended Data Figure 7 |. Oral administrations of BPSCSK protein precipitate reduce VRE colonization in vivo.
Antibiotic-treated mice (n = 9 mice/3 independent experiments) were administered BPSCSK or BPcontrol protein precipitate. Three hours later VRE was orally gavaged, followed by oral administrations of BPSCSK or BPcontrol protein precipitate every three hours for twelve hours and VRE colonization was monitored by quantifying VRE in fecal samples. VRE (ATCC 700221) was used. All statistical analyses were performed using the Mann-Whitney rank sum test (two-tailed) comparing two experimental conditions. * p-value < 0.05 (= 0.0232). Center values (geometric mean), error bars (geometric s.d.).
Extended Data Figure 8 |. BPSCSK’s lantibiotic has a narrower spectrum of activity against Gram-positive commensal strains.
a, VRE was inoculated in media conditioned with BPSCSK, Lactococcus lactis, or BPcontrol culture protein precipitate (n = 4 biologically independent samples/4 independent experiments) and growth was monitored 24 hours post-inoculation. b,c, Culture broth was conditioned with proteins precipitated from BPSCSK, BPcontrol, or commercial nisin-A and serially diluted. The minimal inhibitory concentration (MIC) was determined for common nosocomial pathogens (b) or 158 strains from a commensal biobank (n = 2 biologically independent samples/2 independent experiments) (c) by calculating the highest dilution factor that inhibited growth. The resistance index is a ratio between MIC of BPcontrol-conditioned media over the MIC of BPSCSK or nisin-A-conditioned media (b). The lantibiotic sensitivity ratio was calculated as the MIC of nisin-A over the MIC of BPSCSK’s lantibiotic for each strain (c). All statistical analyses were performed using the Mann-Whitney rank sum test (two-tailed) comparing experimental conditions to a negative control (a) or between two experimental conditions (b,c). *p-value < 0.05 (= 0.0286), **** p-value < 0.0001. Center values (median) center values (median), error bars (1.5 * interquartile range).
Extended Data Figure 9 |. Identification of lantibiotic sequences from metagenomic sequencing of healthy human fecal samples.
a, the profile hidden Markov model used to identify the gallidermin superfamily domain, illustrated as a logo. b, Multiple sequence alignment of lantibiotic precursor sequences identified from shotgun sequencing of healthy-donor fecal samples. Detected lantibiotic sequences are the assembly of lantibiotic reads from shotgun metagenomic fecal samples. c, 421 species were individually isolated from healthy human fecal samples, whole genome sequenced, assembled, annotated, and mined for lantibiotic precursor sequences to identify a strain of Ruminococcus faecis encoding a homologous lantibiotic. The precursor lantibiotic sequence is compared to the sequences of BPSCSK LanA1–4 lantibiotic and nisin-A by multiple alignment.
Extended Data Figure 10 |. Lantibiotic sequences identified from metagenomic sequencing of hospitalized patient fecal samples.
a, Stacked heatmap matrices represent a single patient. The top row illustrates lantibiotic gene abundance (RPKM). The bottom row illustrates relative Enterococcus faecium abundance (% 16S). Columns represent the sample collection day relative to transplant.
Supplementary Material
Acknowledgements
This work was supported by grants RO1 AI42135, RO1 AI95706, UO1 AI124275, and P30 CA008748 from the US National Institutes of Health and the Tow Foundation and Lucille Castori Center for Microbes, Inflammation and Cancer to E.G.P. S. K. is supported by a Medical Scientist Training Program grant from the National Institute of General Medical Sciences, NIH (award T32GM07739 to the Weill Cornell/Rockefeller/Sloan Kettering Tri-Institutional MD-PhD Program). S.B. was supported by an Early Postdoc Mobility Fellowship from the Swiss National Science Foundation and an Irvington Fellowship from the Cancer Research Institute. We thank members of the Pamer laboratory and Jonathan Peled, Memorial Sloan Kettering Cancer Center, for helpful discussions and comments on the manuscript.
K.H. is co-founder and scientific advisor to Vedanta Biosciences. M.R.M.v.d.B. is on the advisory board of and has financial holdings in Seres Therapeutics Inc., serves on the DKMS medical council, has received speaker honoraria from Merck and Acute Leukemia Forum, holds patents that receive royalties from Seres Therapeutics Inc., has received honorarium and research support (1 January 2017 to present) from Seres Therapeutic Inc., and IP licensing with Seres Therapeutics Inc. and Juno. J.U.P. reports research funding, intellectual property fees, and travel reimbursement from Seres Therapeutics. E.G.P. has received speaker honoraria from Bristol-Myer Squibb, Celgene, Seres Therapeutics, MedImmune, Novartis, and Ferring Pharmaceuticals; is an inventor on patent application no. WPO2015179437A1, entitled “Methods and compositions for reducing Clostridium difficile infection” and no. WPO2017091753A1, entitled “Methods and compositions for reducing vancomycin-resistant Enterococci infection or colonization”; and holds patents that receive royalties from Seres Therapeutics Inc.
References
- 1.Lebreton F et al. Tracing the Enterococci from Paleozoic Origins to the Hospital. Cell 169, 849–861 e813, doi: 10.1016/j.cell.2017.04.027 (2017). [DOI] [PMC free article] [PubMed] [Google Scholar]
- 2.Gilmore M, Clewell D, Ike Y & Shankar N Enterococci: From Commensals to Leading Causes of Drug Resistant Infection. (2014). [PubMed]
- 3.Caballero S et al. Cooperating Commensals Restore Colonization Resistance to Vancomycin-Resistant Enterococcus faecium. Cell Host Microbe 21, 592–602 e594, doi: 10.1016/j.chom.2017.04.002 (2017). [DOI] [PMC free article] [PubMed] [Google Scholar]
- 4.U.S. Centers for Disease Control and Prevention, U. S. D. o. H. a. H. S. Antibiotic resistance threats in the United States, 2013, (U.S. Centers for Disease Control and Prevention, 2013). [Google Scholar]
- 5.Pamer EG Resurrecting the intestinal microbiota to combat antibiotic-resistant pathogens. Science 352, 535–538, doi: 10.1126/science.aad9382 (2016). [DOI] [PMC free article] [PubMed] [Google Scholar]
- 6.Kim S, Covington A & Pamer EG The intestinal microbiota: Antibiotics, colonization resistance, and enteric pathogens. Immunological Reviews 279, 90–105, doi: 10.1111/imr.12563 (2017). [DOI] [PMC free article] [PubMed] [Google Scholar]
- 7.van Nood E et al. Duodenal infusion of donor feces for recurrent Clostridium difficile. N Engl J Med 368, 407–415, doi: 10.1056/NEJMoa1205037 (2013). [DOI] [PubMed] [Google Scholar]
- 8.Lawley TD et al. Targeted restoration of the intestinal microbiota with a simple, defined bacteriotherapy resolves relapsing Clostridium difficile disease in mice. PLoS Pathog 8, e1002995, doi: 10.1371/journal.ppat.1002995 (2012). [DOI] [PMC free article] [PubMed] [Google Scholar]
- 9.Buffie CG et al. Precision microbiome reconstitution restores bile acid mediated resistance to Clostridium difficile. Nature 517, 205–208, doi: 10.1038/nature13828 (2015). [DOI] [PMC free article] [PubMed] [Google Scholar]
- 10.Becattini S et al. Commensal microbes provide first line defense against Listeria monocytogenes infection. J Exp Med 214, 1973–1989, doi: 10.1084/jem.20170495 (2017). [DOI] [PMC free article] [PubMed] [Google Scholar]
- 11.Suez J et al. Post-Antibiotic Gut Mucosal Microbiome Reconstitution Is Impaired by Probiotics and Improved by Autologous FMT. Cell 174, 1406–1423 e1416, doi: 10.1016/j.cell.2018.08.047 (2018). [DOI] [PubMed] [Google Scholar]
- 12.Ubeda C et al. Vancomycin-resistant Enterococcus domination of intestinal microbiota is enabled by antibiotic treatment in mice and precedes bloodstream invasion in humans. J Clin Invest 120, 4332–4341, doi: 10.1172/JCI43918 (2010). [DOI] [PMC free article] [PubMed] [Google Scholar]
- 13.Taur Y et al. Intestinal domination and the risk of bacteremia in patients undergoing allogeneic hematopoietic stem cell transplantation. Clin Infect Dis 55, 905–914, doi: 10.1093/cid/cis580 (2012). [DOI] [PMC free article] [PubMed] [Google Scholar]
- 14.Ubeda C et al. Intestinal microbiota containing Barnesiella species cures vancomycin-resistant Enterococcus faecium colonization. Infect Immun 81, 965–973, doi: 10.1128/IAI.01197-12 (2013). [DOI] [PMC free article] [PubMed] [Google Scholar]
- 15.Caballero S et al. Distinct but Spatially Overlapping Intestinal Niches for Vancomycin-Resistant Enterococcus faecium and Carbapenem-Resistant Klebsiella pneumoniae. PLoS Pathog 11, e1005132, doi: 10.1371/journal.ppat.1005132 (2015). [DOI] [PMC free article] [PubMed] [Google Scholar]
- 16.Cash HL, Whitham CV, Behrendt CL & Hooper LV Symbiotic bacteria direct expression of an intestinal bactericidal lectin. Science 313, 1126–1130, doi: 10.1126/science.1127119 (2006). [DOI] [PMC free article] [PubMed] [Google Scholar]
- 17.Brandl K et al. Vancomycin-resistant enterococci exploit antibiotic-induced innate immune deficits. Nature 455, 804–807, doi: 10.1038/nature07250 (2008). [DOI] [PMC free article] [PubMed] [Google Scholar]
- 18.Chatterjee C, Moushumi P, Lili X & van der Donk W Biosynthesis and Mode of Action of Lantibiotics. Chem. Rev. 105, 633–684 (2005). [DOI] [PubMed] [Google Scholar]
- 19.Knerr PJ & van der Donk WA Discovery, biosynthesis, and engineering of lantipeptides. Annu Rev Biochem 81, 479–505, doi: 10.1146/annurev-biochem-060110-113521 (2012). [DOI] [PubMed] [Google Scholar]
- 20.Mattick A & Hirsch A A Powerful Inhibitory Substance Produced by Group N Streptococci. Nature 154, 551 (1944). [Google Scholar]
- 21.Delves-Broughton J, Blackburn P, Evans R & Hugenholtz J Applications of the bacteriocin, nisin. Antonie van Leeuwenhoek 69, 193–202 (1996). [DOI] [PubMed] [Google Scholar]
- 22.Wiedemann I et al. Specific binding of nisin to the peptidoglycan precursor lipid II combines pore formation and inhibition of cell wall biosynthesis for potent antibiotic activity. J Biol Chem 276, 1772–1779, doi: 10.1074/jbc.M006770200 (2001). [DOI] [PubMed] [Google Scholar]
- 23.Hatziioanou D et al. Discovery of a novel lantibiotic nisin O from Blautia obeum A2–162, isolated from the human gastrointestinal tract. Microbiology 163, 1292–1305, doi: 10.1099/mic.0.000515 (2017). [DOI] [PMC free article] [PubMed] [Google Scholar]
- 24.Hsu ST et al. The nisin-lipid II complex reveals a pyrophosphate cage that provides a blueprint for novel antibiotics. Nat Struct Mol Biol 11, 963–967, doi: 10.1038/nsmb830 (2004). [DOI] [PubMed] [Google Scholar]
- 25.Breukink E et al. The C-terminal region of nisin is responsible for the initial interaction of nisin with the target membrane. Biochemistry 36, 6968–6976, doi: 10.1021/bi970008u (1997). [DOI] [PubMed] [Google Scholar]
- 26.Dobson A et al. Fate and efficacy of lacticin 3147-producing Lactococcus lactis in the mammalian gastrointestinal tract. FEMS Microbiol Ecol 76, 602–614, doi: 10.1111/j.1574-6941.2011.01069.x (2011). [DOI] [PubMed] [Google Scholar]
- 27.Picard C et al. Review article: bifidobacteria as probiotic agents -- physiological effects and clinical benefits. Aliment Pharmacol Ther 22, 495–512, doi: 10.1111/j.1365-2036.2005.02615.x (2005). [DOI] [PubMed] [Google Scholar]
- 28.Kang DH & Fung DY Reduction of Escherichia coli O157:H7 by stimulated Pediococcus acidilactici. Lett Appl Microbiol 29, 206–210 (1999). [DOI] [PubMed] [Google Scholar]
- 29.Taur Y, Jenq RR, Ubeda C, van den Brink M & Pamer EG Role of intestinal microbiota in transplantation outcomes. Best Pract Res Clin Haematol 28, 155–161, doi: 10.1016/j.beha.2015.10.013 (2015). [DOI] [PMC free article] [PubMed] [Google Scholar]
- 30.Nakatsuji T et al. Antimicrobials from human skin commensal bacteria protect against Staphylococcus aureus and are deficient in atopic dermatitis. Sci Transl Med 9, doi: 10.1126/scitranslmed.aah4680 (2017). [DOI] [PMC free article] [PubMed] [Google Scholar]
Additional References
- 31.Vaishnava S et al. The antibacterial lectin RegIIIgamma promotes the spatial segregation of microbiota and host in the intestine. Science 334, 255–258, doi: 10.1126/science.1209791 (2011). [DOI] [PMC free article] [PubMed] [Google Scholar]
- 32.Swidsinski A, Weber J, Loening-Baucke V, Hale LP & Lochs H Spatial organization and composition of the mucosal flora in patients with inflammatory bowel disease. J Clin Microbiol 43, 3380–3389, doi: 10.1128/JCM.43.7.3380-3389.2005 (2005). [DOI] [PMC free article] [PubMed] [Google Scholar]
- 33.Shi Y, Yang X, Garg N & van der Donk WA Production of lantipeptides in Escherichia coli. J Am Chem Soc 133, 2338–2341, doi: 10.1021/ja109044r (2011). [DOI] [PMC free article] [PubMed] [Google Scholar]
- 34.Montalban-Lopez M, Buivydas A & Kuipers OP in Hydrocarbon and Lipid Microbiology Protocols Springer Protocols Handbooks (eds McGenity T, Timmis K, & Fernandez B. Nogales) (Springer, Berlin, Heidelberg, 2015). [Google Scholar]
- 35.Caporaso JG et al. Ultra-high-throughput microbial community analysis on the Illumina HiSeq and MiSeq platforms. ISME J 6, 1621–1624, doi: 10.1038/ismej.2012.8 (2012). [DOI] [PMC free article] [PubMed] [Google Scholar]
- 36.Edgar RC UPARSE: highly accurate OTU sequences from microbial amplicon reads. Nat Methods 10, 996–998, doi: 10.1038/nmeth.2604 (2013). [DOI] [PubMed] [Google Scholar]
- 37.Edgar RC & Flyvbjerg H Error filtering, pair assembly and error correction for next-generation sequencing reads. Bioinformatics 31, 3476–3482, doi: 10.1093/bioinformatics/btv401 (2015). [DOI] [PubMed] [Google Scholar]
- 38.Tatusova T, Ciufo S, Fedorov B, O’Neill K & Tolstoy I RefSeq microbial genomes database: new representation and annotation strategy. Nucleic Acids Res 43, 3872, doi: 10.1093/nar/gkv278 (2015). [DOI] [PMC free article] [PubMed] [Google Scholar]
- 39.Bolger AM, Lohse M & Usadel B Trimmomatic: a flexible trimmer for Illumina sequence data. Bioinformatics 30, 2114–2120, doi: 10.1093/bioinformatics/btu170 (2014). [DOI] [PMC free article] [PubMed] [Google Scholar]
- 40.Wattam AR et al. Assembly, Annotation, and Comparative Genomics in PATRIC, the All Bacterial Bioinformatics Resource Center. Methods Mol Biol 1704, 79–101, doi: 10.1007/978-1-4939-7463-4_4 (2018). [DOI] [PubMed] [Google Scholar]
- 41.Medema MH et al. antiSMASH: rapid identification, annotation and analysis of secondary metabolite biosynthesis gene clusters in bacterial and fungal genome sequences. Nucleic Acids Res 39, W339–346, doi: 10.1093/nar/gkr466 (2011). [DOI] [PMC free article] [PubMed] [Google Scholar]
- 42.de Jong A, van Hijum SA, Bijlsma JJ, Kok J & Kuipers OP BAGEL: a web-based bacteriocin genome mining tool. Nucleic Acids Res 34, W273–279, doi: 10.1093/nar/gkl237 (2006). [DOI] [PMC free article] [PubMed] [Google Scholar]
- 43.Buchfink B, Xie C & Huson DH Fast and sensitive protein alignment using DIAMOND. Nat Methods 12, 59–60, doi: 10.1038/nmeth.3176 (2015). [DOI] [PubMed] [Google Scholar]
- 44.Eddy SR Accelerated Profile HMM Searches. PLoS Comput Biol 7, e1002195, doi: 10.1371/journal.pcbi.1002195 (2011). [DOI] [PMC free article] [PubMed] [Google Scholar]
Associated Data
This section collects any data citations, data availability statements, or supplementary materials included in this article.
Supplementary Materials
Data Availability Statement
Microbiome sequencing data are available from Bioproject with the accession number 394877.


