The balance between the production of reactive oxygen species (ROS) and antioxidant systems, which defines the redox status (a state of oxidative stress if ROS are in excess), is a regulator of normal and malignant hematopoiesis. ROS status, sometimes linked with molecular abnormalities, has pleiomorphic effects on the initiation and progression of acute myeloid leukemia (AML), but also on sensitivity to chemotherapy.1–5 For example, variability in the levels of nicotinamide adenine dinucleotide phosphate oxidase (NOX), a ROS producer, influences the efficacy of AML induction therapy, improving complete remission when more ROS are generated.6 The two major sources of ROS production are the mitochondria and NOX activity, which itself contributes to increasing levels of ROS in more than 60% of AML.7 However, AML cells also have a singular mitochondrial organization with increased mitochondrial mass but a low spare reserve capacity that renders them susceptible to oxidative stressors.8 Finally, ROS concentrations can also be modulated by the microenvironment9 and by the antioxidant system.7
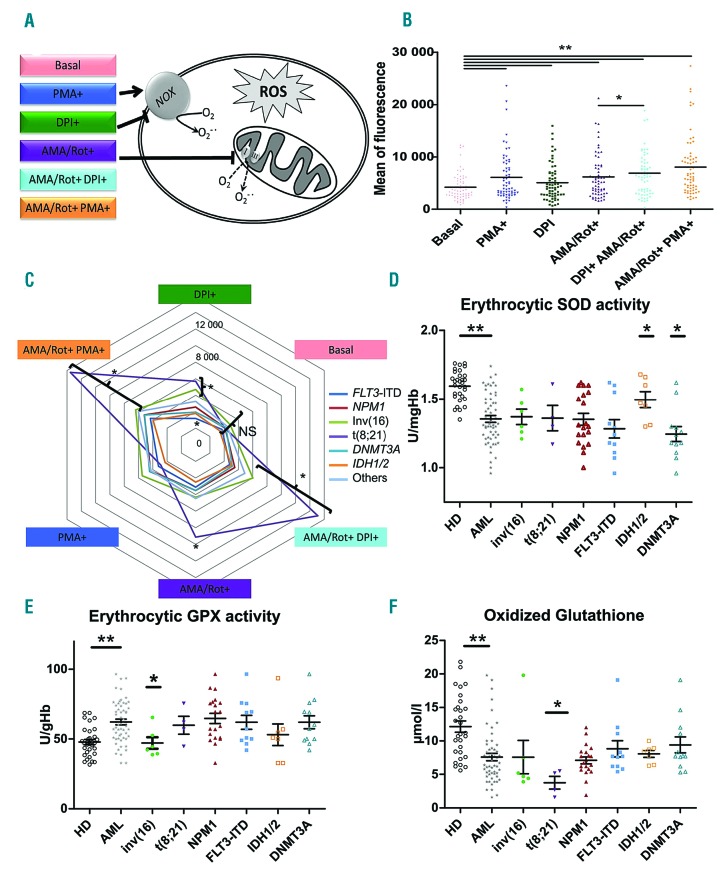
In this prospective study (registered as EudraCT: 2013 A00762-43), we determined the redox status of 84 adult patients with newly diagnosed AML through characterization of ROS production profiles at diagnosis in both the non-leukemic and leukemic compartments. We developed an original ex vivo ROS assay using mitochondrial and/or NOX modulators (Figure 1A). In order to construct ROS profiles, six different ROS conditions were studied after labeling with 10 μM dihydroethidium (ThermoFisher Scientific): ROS production at basal state (phosphate-buffered saline vehicle) and after the addition of one or more ROS modulators [phorbol myristate acetate (PMA), antimycin A/rotenone (AMA/Rot), and/or diphenyleneiodonium (DPI)]. Candidate populations were targeted with CD45+ antibody (Becton Dickinson Biosciences), and side scatter (Online Supplementary Figure S1). Mean dihydroethidium fluorescence of each cell population was measured. The patients’ characteristics are presented in Online Supplementary Table S1.
Figure 1.
Reactive oxygen species profiles and antioxidant markers of leukemic cells. (A) Schema of reactive oxygen species (ROS) modulators stimulating or inhibiting NADPH oxidase and mitochondria used in the ex vivo ROS assays. (B) ROS profiles showing the effects of different ROS modulators in blast cells from bone marrow. Statistical analysis: Wilcoxon test for paired samples. (C) Spider chart of ROS profiles according to leukemic abnormalities. Colored lines represent leukemic abnormalities. Note that ROS profiles from t(8;21), inv(16) patients showed more variability in ROS production after the addition of modulators. “Others” refers to acute myeloid leukemia (AML) that did not express any of the listed abnormalities. (D) Distribution of erythrocytic superoxide dismutase activity at diagnosis in healthy donors (HD) and AML patients according to genetic abnormalities. (E) Distribution of erythrocytic glutathione peroxidase activity in HD and AML patients according to genetic abnormalities. (F) Distribution of oxidized glutathione in HD and AML patients according to genetic abnormalities. (B, D, E, F) *P<0.05, **P<0.01. PMA: phorbol 12-myristate 13-acetate; DPI: diphenyleneiodonium; AMA: antimycin A; Rot: rotenone; NOX: NADPH oxidase; SOD: superoxide dismutase; GPX; glutathione peroxidase.
ROS production in leukemic cells from peripheral blood was well correlated with that in bone marrow blasts (Online Supplementary Table S2) and with leukocytosis (r=0.508, P<0.001). ROS production was increased by PMA, a NOX stimulator, and by the complex III and complex I inhibitors AMA/Rot (P<0.001 and P<0.001, respectively, compared to basal levels) (Figure 1B). Surprisingly, DPI, an inhibitor of NOX, stimulated ROS production in leukemic cells (basal vs.DPI, P=0.002 and AMA/Rot+DPI+ vs. AMA/Rot+DPI−, P=0.012). In fact, DPI has been shown to induce mitochondrial superoxide production through mitochondrial complex I.10,11
No difference in basal ROS levels was observed according to molecular abnormalities (Figure 1C), although AML4 and AML5 expressed higher basal levels of ROS (P=0.009) (Online Supplementary Figure S2) as previously observed.12 However, leukemic cells from patients with FLT3-internal tandem duplication (ITD) showed significantly lower ROS production when stimulated with DPI than did leukemic cells from patients without FLT3-ITD (P<0.05). In contrast, core binding factor (CBF)-AML cells comprising inv(16) and t(8;21) showed significantly higher levels of ROS production in several conditions conditions (AMA/Rot+DPI+, AMA/Rot+PMA+, and DPI+ (P=0.002, P=0.024, and P=0.028, respectively). Hence, the CBF subgroup appeared highly sensitive to mitochondrial stress, possibly reflecting the poor stability of mitochondrial membrane permeability and a low mitochondrial threshold for apoptosis. In contrast, the weak response of the FLT3-ITD subtype to DPI suggests a ‘mitochondrial resistance’ to chemotherapy-induced apoptosis through oxidative stress. Levels of ROS production at baseline did not differ significantly between European LeukemiaNet prognostic groups (data not shown). Altogether, ROS production profiles based on the functional evaluation of NOX and mitochondria were more discriminative markers of AML heterogeneity than was basal ROS production.
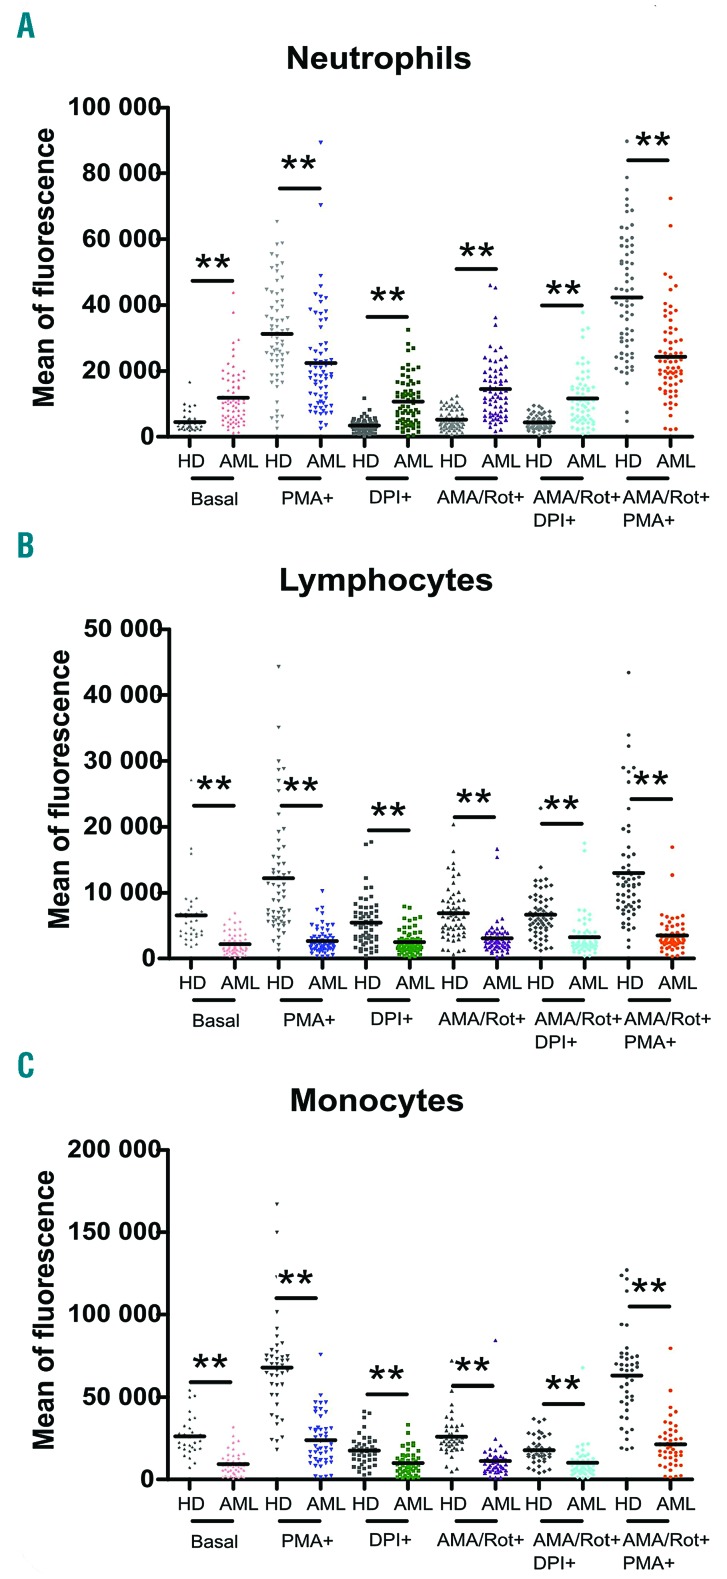
We investigated whether non-tumoral cells from AML patients had ROS profiles equivalent to those from 65 healthy donors used as controls. ROS production at basal state was significantly higher in neutrophils from AML patients than in those from healthy donors (P<0.001) (Figure 2A). However, neutrophils from AML patients exhibited a lower capacity to increase NOX-dependent ROS production in response to PMA (P=0.001) and AMA/Rot+PMA+ (P<0.001). Lymphocytes and monocytes from leukemic patients also displayed significantly lower ROS production than that of the corresponding cells from healthy donors whatever the ROS condition used (P<0.001) (Figure 2B,C). Thus, a dysregulated non-tumoral compartment might influence redox levels in the leukemic compartment.
Figure 2.
Reactive oxygen species profiles of non-leukemic cells from healthy donors and patients with acute myeloid leukemia. (A) At baseline, levels of reactive oxygen species (ROS) in neutrophils from patients with acute myeloid leukemia (AML) were higher than those in neutrophils from healthy donors. However, neutrophils from AML patients were less reactive to phorbol 12-myristate 13-acetate stimulation. In contrast, in lymphocytes (B) and monocytes (C) from AML patients. ROS production was lower whatever the ROS conditions.**P<0.01. HD: healthy donors; PMA: phorbol 12-myristate 13-acetate; DPI: diphenyleneiodonium; AMA: antimycin A; Rot: rotenone.
Next, we investigated antioxidant and lipid peroxidation markers at diagnosis and their relationship with molecular subtypes (for methodological details see the Online Supplementary File). The activity of erythrocytic superoxide dismutase was significantly lower in AML patients than in healthy donors (P<0.001) (Figure 1D). However, IDH and DNMT3A mutations were associated with, respectively, increased and decreased superoxide dismutase activity (P<0.05). Conversely, erythrocytic glutathione peroxidase activity was significantly increased in AML patients (P<0.001) (Figure 1E). Among molecular subtypes, patients with inv(16) presented significantly reduced erythrocytic glutathione peroxidase activity (P<0.01). Overall, total glutathione was decreased in AML (P<0.001), as were both oxidized glutathione (P<0.001) (Figure 1F) and reduced glutathione (P<0.001), as previously described in CD34+ AML cells.13 Interestingly, oxidized glutathione was significantly reduced in t(8;21) patients (P<0.05) leading to a higher glutathione redox ratio (P<0.05). The thiol ratio was also lower in AML patients than in healthy donors (P<0.001) and a significant decrease in total thiols was observed in patients with FLT3-ITD (P<0.01), NPM1 mutation (P<0.05) and DNMT3A mutation (P=0.059) compared to patients without these mutations. Finally, we observed a significant reduction in lipid peroxidation, assessed by a malondialdehyde assay, in patients with inv(16) (P<0.05). However, antioxidant markers at diagnosis did not differ significantly between European LeukemiaNet prognostic classes (data not shown). Altogether, we showed that CBF-AML presented fewer markers of oxidative stress, with lower oxidized glutathione for t(8;21) AML and lower malondialdehyde levels for inv(16) AML, in contrast to the FLT3-ITD, NPM1, and DNMT3A subtypes of AML which showed lower levels of thiols. These data suggest that oncogenic mutations could also affect the antioxidant system and, together with alterations in ROS production, promote the proliferation of leukemic cells.
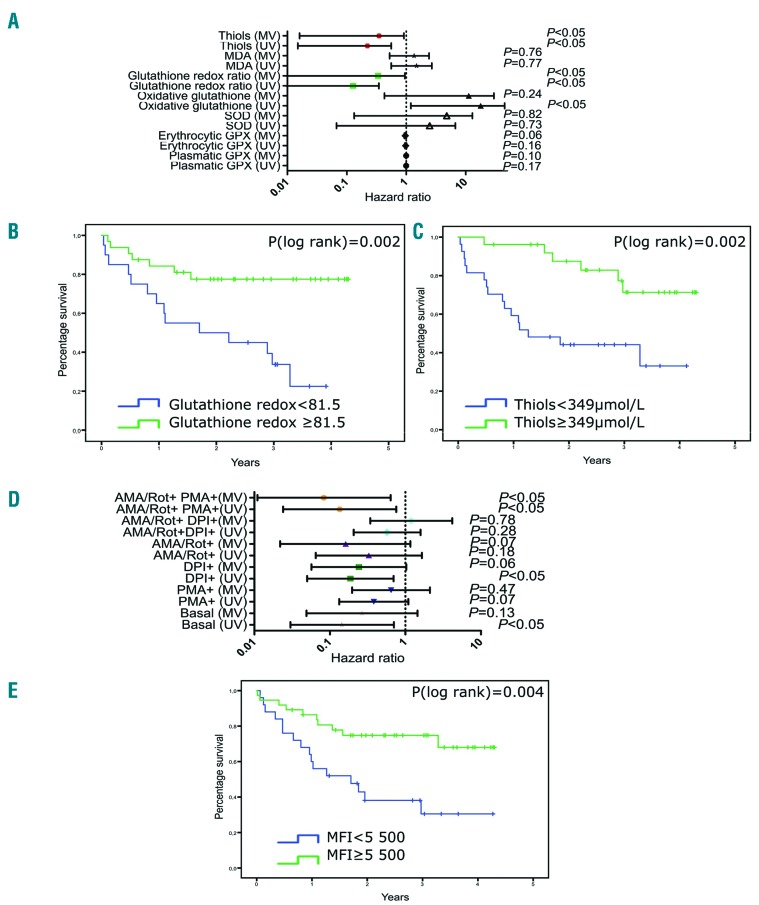
Next, we explored whether redox status at diagnosis influences survival. The statistical methods are described in the Online Supplementary File. We observed that the reduced/oxidized glutathione ratio at diagnosis was significantly higher in survivors than in non-survivors (P=0.002) and in non-relapsed patients versus relapsed patients (P<0.05). Furthermore, oxidized glutathione levels at diagnosis were lower in survivors than in non-survivors (P=0.017). Multivariate analysis including age, the 2017 European LeukemiaNet stratification and leukocyte counts confirmed that an increase in the reduced/oxidized glutathione ratio was an independent marker of longer survival [hazard ratio (HR)=0.055, 95% confidence interval (95% CI): 0.003-0.951, P=0.04)] (Figure 3A). Moreover, an increase in thiol levels was also significantly associated with a lower risk of death and relapse (HR=0.12, 95% CI: 0.016-0.911, P=0.04 and HR=0.07, 95% CI: 0.007-0.753 P=0.028, respectively). Based on receiver operating characteristic curve analysis, we calculated a threshold for both the reduced/oxidized glutathione ratio and thiol levels. Patients whose glutathione redox ratio was ≥81.5 or patients whose thiol concentration was ≥349 μmol/L at diagnosis had significantly higher survival rates (P=0.002 and P=0.002, respectively) (Figure 3B,C).
Figure 3.
Prognostic value of antioxidant markers and leukemic reactive oxygen species profiles. (A) Forest plot representing the risk of death (with hazard ratios and 95% confidence intervals) according to antioxidant markers and malondialdehyde levels. (B) Kaplan-Meier survival curves of patients with acute myeloid leukemia (AML) receiving chemotherapy according to the cut-off for reduced/oxidative glutathione ratio (< vs. ≥81.5). (C) Kaplan-Meier survival curves of AML patients receiving chemotherapy according to the cut-off for thiol levels (< or ≥349 μmol/L). (D) Forest plot representing the risk of death (with hazard ratios and 95% confidence intervals) according to reactive oxygen species (ROS) production by leukemic cells from bone marrow exposed to different ROS modulators (log-transformed variables). (E) Kaplan-Meier survival curves of AML patients receiving chemotherapy according to the cut-off for mean fluorescence intensity (MFI) in response to ROS modulators (< vs. ≥5,500). High levels of MFI were predictive of survival (P=0.004). MV: multivariate analysis; UV: univariate analysis; MDA: malondialdehyde; SOD: superoxide dismutase; GPX: glutathione peroxidase; AMA: antimycin A; Rot: rotenone; PMA: phorbol 12-myristate 13-acetate; DPI: diphenyleneiodonium.
Furthermore, we showed that ROS production at baseline was significantly correlated with overall survival in univariate analysis (from bone marrow samples, HR=0.14, 95% CI: 0.03-0.7, P=0.02) although this was not confirmed in multivariate analysis (from bone marrow and peripheral blood samples, HR=0.27, 95% CI: 0.05-1.45, P=0.13 and HR=0.35, 95% CI: 0.12-1.03, P=0.06, respectively) (Figure 3D). However, leukemic cell ROS measured after incubation with modulators could be an independent prognostic marker of survival. Indeed, the risk of death was significantly decreased in patients with the highest levels of DPI-induced ROS (in bone marrow and peripheral blood HR=0.169, 95% CI: 0.041-0.694, P=0.014 and HR=0.26, 95% CI: 0.075-0.90, P=0.035, respectively, in univariate analysis). An increase in DPI-dependant ROS in bone marrow samples was also associated with longer relapse-free survival and event-free survival in multivariate analysis (HR=0.1, 95% CI: 0.02-0.49, P=0.005, and HR=0.17, 95% CI: 0.04-0.66, P=0.01, respectively). Interestingly, increased ROS production by leukemic cells under AMA/Rot+PMA+ stimulation was significantly associated with longer survival in both univariate and multivariate analyses (HR=0.14, 95% CI: 0.02-0.76, P=0.02 and HR=0.08, 95% CI: 0.01-0.64, P=0.02, respectively). Moreover, higher ROS production under AMA/Rot+PMA+ stimulation was significantly associated with longer relapse-free survival and event-free survival in multivariate analysis (HR=0.028, 95% CI: 0.003-0.278, P=0.002 and HR=0.12, 95% CI:0.023-0.73, P=0.02, respectively). These results were confirmed in peripheral blood (for overall survival and event-free survival: HR=0.28, 95% CI: 0.1-0.813, P=0.019 and HR=0.33, 95% CI: 0.13-0.84, P=0.02, respectively). Finally, we identified a threshold using receiver operating characteristic curves in which patients whose blasts from bone marrow or blood at diagnosis produced ≥5,500 ROS in response to AMA/Rot and PMA had a significantly higher survival rate (P=0.004) (Figure 3E).
Our approach underlines the importance of functional NOX and mitochondria in chemosensitivity and confirms that mitochondrial fitness is critical to prognosis. We suggest that blast cells resistant to mitochondria and NOX stress are more resistant to chemotherapy (or at least include subclones resistant to chemotherapy), probably because in these patients chemotherapy failed to induce efficient ROS-mediated apoptosis of leukemic cells. Farge et al. demonstrated that chemoresistant leukemic cells displayed a high OXPHO signature characterized by active polarized mitochondria with no loss of mitochondrial membrane potential after cytarabine-treatment.14 We hypothesize that our patients resistant to mitochondrial and NOX stress could be similar to those with high OXPHO and may be good candidates for ROS/mitochondria targeted therapy. For example, mitochondrial complex I inhibitors such as metformin can induce an energy shift from high OXPHOS to low OXPHOS (the so-called Pasteur effect) and improve the sensitivity of FLT3-ITD AML to cytarabine. Finally, the fact that both NOX and mitochondria-dependent ROS production were associated with better survival argues for cooperation between ROS producers. Indeed, superoxide generated from leukemic NOX2 drives mitochondrial transfer from stromal cells.9
In conclusion, our study showed that AML patients had a dysregulated redox balance linked to their molecular status, involving leukemic cells, non-tumoral cells and the antioxidant system, which play a major role in the prognosis of patients.
Acknowledgments
The authors would like to thank Dr Alison Foote (Grenoble Alpes University Hospital) for very substantial critical editing of the manuscript.
Footnotes
Information on authorship, contributions, and financial & other disclosures was provided by the authors and is available with the online version of this article at www.haematologica.org.
References
- 1.Sallmyr A, Fan J, Datta K, et al. Internal tandem duplication of FLT3 (FLT3/ITD) induces increased ROS production, DNA damage, and misrepair: implications for poor prognosis in AML. Blood. 2008;111(6):3173–3182. [DOI] [PubMed] [Google Scholar]
- 2.Sinenko SA, Hung T, Moroz T, et al. Genetic manipulation of AML1-ETO-induced expansion of hematopoietic precursors in a Drosophila model. Blood. 2010;116(22):4612–4620. [DOI] [PMC free article] [PubMed] [Google Scholar]
- 3.Ward PS, Patel J, Wise DR, et al. The common feature of leukemia-associated IDH1 and IDH2 mutations is a neomorphic enzyme activity converting alpha-ketoglutarate to 2-hydroxyglutarate. Cancer Cell. 2010;17(3):225–234. [DOI] [PMC free article] [PubMed] [Google Scholar]
- 4.Lagadinou ED, Sach A, Callahan K, et al. BCL-2 Inhibition targets oxidative phosphorylation and selectively eradicates quiescent human leukemia stem cells. Cell Stem Cell. 2013;12(3):329–341. [DOI] [PMC free article] [PubMed] [Google Scholar]
- 5.Zhou J, Bi C, Cheong L-L, et al. The histone methyltransferase inhibitor, DZNep, up-regulates TXNIP, increases ROS production, and targets leukemia cells in AML. Blood. 2011;118(10):2830–2839. [DOI] [PubMed] [Google Scholar]
- 6.Megías-Vericat JE, Montesinos P, Herrero MJ, et al. Impact of NADPH oxidase functional polymorphisms in acute myeloid leukemia induction chemotherapy. Pharmacogenomics J. 2018;18(2):301–307. [DOI] [PubMed] [Google Scholar]
- 7.Hole PS, Zabkiewicz J, Munje C, et al. Overproduction of NOX-derived ROS in AML promotes proliferation and is associated with defective oxidative stress signaling. Blood. 2013;122(19):3322–3330. [DOI] [PubMed] [Google Scholar]
- 8.Sriskanthadevan S, Jeyaraju DV, Chung TE, et al. AML cells have low spare reserve capacity in their respiratory chain that renders them susceptible to oxidative metabolic stress. Blood. 2015;125(13):2120–2130. [DOI] [PMC free article] [PubMed] [Google Scholar]
- 9.Marlein CR, Zaitseva L, Piddock RE, et al. NADPH oxidase-2 derived superoxide drives mitochondrial transfer from bone marrow stromal cells to leukemic blasts. Blood. 2017;130(14):1649–1660. [DOI] [PubMed] [Google Scholar]
- 10.Riganti C, Gazzano E, Polimeni M, Costamagna C, Bosia A, Ghigo D. Diphenyleneiodonium inhibits the cell redox metabolism and induces oxidative stress. J Biol Chem. 2004;279(46):47726–47731. [DOI] [PubMed] [Google Scholar]
- 11.Kučera J, Binó L, Štefková K, et al. Apocynin and diphenyleneiodonium induce oxidative stress and modulate PI3K/Akt and MAPK/Erk activity in mouse embryonic stem cells. Oxid Med Cell Longev. 2016;20167409196. [DOI] [PMC free article] [PubMed] [Google Scholar]
- 12.Aurelius J, Thorén FB, Akhiani AA, et al. Monocytic AML cells inactivate antileukemic lymphocytes: role of NADPH oxidase/gp91(phox) expression and the PARP-1/PAR pathway of apoptosis. Blood. 2012;119(24):5832–5837. [DOI] [PMC free article] [PubMed] [Google Scholar]
- 13.Pei S, Minhajuddin M, Callahan KP, et al. Targeting aberrant glutathione metabolism to eradicate human acute myelogenous Leukemia Cells. J Biol Chem. 2013;288(47):33542–33558. [DOI] [PMC free article] [PubMed] [Google Scholar]
- 14.Farge T, Saland E, de Toni F, et al. Chemotherapy-resistant human acute myeloid leukemia cells are not Enriched for leukemic stem cells but require oxidative metabolism. Cancer Discov. 2017;7(7):716–735. [DOI] [PMC free article] [PubMed] [Google Scholar]


