

Abstract
PURPOSE:
To evaluate the pharmacokinetics and efficacy of imatinib in patients with recurrent oligodendroglial tumors.
METHODS:
Patients with progressive WHO grade II-III recurrent tumors after prior RT and chemotherapy were eligible. A phase I dose-escalation study was conducted for patients on enzyme-inducing anticonvulsants (EIAC). A phase II study for non-EIAC patients utilized a fixed dose of 600mg/D. Primary efficacy endpoint was 6-month progression-free survival (PFS6). A 2-stage design was utilized, with 90% power to detect PFS6 increase from 25% to 45%.
RESULTS:
In the Phase I, maximum tolerated dose was not reached at 1200 mg/D. For phase II patients, overall PFS6 was 33% and median PFS 4.0 months (95% CI, 2.1, 5.7). Median overall survival (OS) was longer in imatinib-treated patients compared with controls (16.6 vs. 8.0 months; HR=0.64, 95% CI, 0.41,1.0, p=0.049), and longer in patients with 1p/19q-codeleted tumors (19.2 vs. 6.2 months, HR =0.43, 95% CI, 0.21,0.89, p=0.019). Confirmed response rate was 3.9% (PR=1; REGR=1), with stable disease observed in 52.9%. At 600 mg/D, mean steady-state imatinib plasma concentration was 2513 ng/ml (95% CI, 1831,3195). Grade 3–4 adverse events (hematologic, fatigue, GI, hypophosphatemia, or hemorrhage) occurred in 61%.
CONCLUSIONS:
Although adequate plasma levels were achieved, the observed PFS6 of 33% did not reach our pre-defined threshold for success. Although OS was longer in imatinib-treated patients than controls, this finding would require forward validation in a larger cohort. Imatinib might show greater activity in a population enriched for PDGF-dependent pathway activation in tumor tissue.
Keywords: oligodendroglioma, imatinib, NCCTG, Alliance, N0272, PDGF
INTRODUCTION
Overexpression of platelet-derived growth factor receptor (PDGFR), c-Kit, and PDGF-mediated MAP-K activation has been associated with oligodendroglial tumor cell growth and proliferation. [1,2] Imatinib decreases PDGF-and c-Kit-dependent signaling, resulting in cell cycle arrest and apoptosis. [3] Given these findings, we conducted a phase I-II study (Alliance/NCCTG N0272) of imatinib for patients with recurrent oligodendroglial tumors.
METHODS
Eligibility required age ≥ 18 years; central confirmation of WHO grade II or III oligodendroglial tumor; progression following prior surgery, RT and temozolomide (or a nitrosourea) documented by neuroimaging performed ≤21 days prior to registration; p fixed dose of corticosteroids for ≥1 week prior to baseline scan; at least 2 weeks and recovered from surgery; ≥12 weeks from prior RT and ≥4 weeks from chemotherapy (nitrosoureas ≥6 weeks, biologics ≥2 weeks); Eastern Clinical Oncology Group (ECOG) performance status 0–2; acceptable hematologic/metabolic parameters; and provision of IRB-approved informed written consent from patient or legal guardian. Patients were ineligible if they had received prior stereotactic RT or interstitial therapy; required therapeutic anticoagulation; had significant co-morbidities; were pregnant, nursing, or unwilling to employ contraception; had active malignancy (excepting non-melanotic skin cancer); were HIV-positive; or prior symptomatic intra-tumoral hemorrhage. Histologic diagnosis and assignment of grade by central pathology review was based on WHO classifications of 2008 or earlier, utilizing tumor tissue obtained at the time of the initial surgical procedure, or from the most recent resection. surgical procedure, or from the most recent resection.
There were five treatment cohorts (Arms A-E), assigned based on two characteristics: the number of prior chemotherapy regimens the patient had previously received (≤ or > 2); and enzyme-inducing anticonvulsant (EIAC) status (yes/no).
For patients receiving EIAC, three arms were planned. A Phase I study (Arm C) included patients who had received ≤ 2 prior regimens, utilizing a cohorts-of-three dose escalation design [starting dose of 1000 mg/D, with planned 200 mg/D dose level escalations, initiated when all patients within a given cohort completed two treatment cycles (56 days)]. If 2 patients experienced dose-limiting toxicity, DLT, the next lower dose cohort was expanded by 3 patients. Maximum tolerated dose (MTD) was defined as the dose level where < 2/6 patients experienced DLT. Dose-limiting toxicity (DLT) was defined as grade ≥4 hematologic, or > 3 non-hematologic adverse event (AE), any treatment-related AE which resulted in withdrawal from study, or treatment delay of > 4 weeks. There were two planned Phase II arms (Arm A, ≤ 2 prior regimens; Arm D, > 2 prior regimens) to follow determination of the MTD in EIAC patients.
For patients not receiving EIAC, two Phase II arms were conducted (Arm B, ≤2 prior regimens; Arm E, > 2 prior regimens), utilizing a fixed imatinib dose of 600 mg/day. Arm E (> 2 prior chemo regimens) was a pilot study, with accrual continued until completion of Arm B accrual.
The primary Phase II endpoint was PFS6. We utilized a comparison group of patients with recurrent oligodendroglial tumors (N=37; oligodendroglioma- 43%; oligoastrocytoma- 57%; Grade I-II −70%; Grade III-IV - 27%; Grade unknown - 3%) from our database of patients treated on prior NCCTG trials (95–72-53, 96–72-51 or 98–72-54), in order to derive the pre-defined control PFS6 of 25.7%. A 2-stage Fleming version of Simon’s MinMax design, [4] with 90% power to detect 20% increase of PFS6 (from 25% to 45%). There was one interim analysis, with planned study termination if < 5 of 23 of the first evaluable patients were progression-free at 183 days, and continuation to full accrual if at least 14/39 first evaluable patients were alive and progression-free at 183 days. Protocol-specified proportion of success was estimated using the binomial point estimator (number successes/number evaluable patients) with a 90% confidence interval (Duffy-Santner). [5]
Assessments were performed every 3 months until death or loss to follow-up. OS was defined as time from start of treatment to all-cause death or last follow-up; PFS was defined as time from start of study treatment to disease progression or death. Response rates and adverse event frequency were compared between patients receiving ≤ 2 vs. > 2 prior treatment regimens.
PFS6 rates were estimated using the binomial point estimator and reported with 95% confidence intervals (Clopper-Pearson Method). [6] Arms B and E were subsequently pooled in the final analysis, given that no differences in PFS6 were observed between arms. Survival was compared between study and control patients, using Kaplan-Meier and Cox Proportional-Hazards models.
Imatinib and CGP74588 (active metabolite) concentrations were determined at baseline and at steady-state (days 28 and 56) (M. Egorin). Results were compared between patients receiving baseline steroids (yes vs. no); those experiencing grade 3–4 adverse events (yes vs. no); and those achieving PFS6 (yes vs. no) (Wilcoxon-Rank-Sum or Wilcoxon-Signed-Rank tests). [7,8] Response was assessed by NCCTG criteria, [9] and categorized as complete (CR), partial (PR), regression (REGR) or stable disease. Response required confirmation on two successive assessments at least 4 weeks apart.
Adverse event reporting was required at four-week intervals. Phase I results were reviewed weekly by the study team. The Phase II was monitored twice annually by the Alliance Data and Safety Monitoring Committee. Data collection and statistical analyses were conducted by the Alliance Statistics and Data Center (Rochester, MN) using SAS v9.4M5 and R v3.4.2. Data quality was ensured by the Alliance Statistics and Data Center and Study Chair, following Alliance policies.
Imatinib was provided by the U.S. National Cancer Institute (NCI) Cancer Therapy Evaluation Program (CTEP) under a Cooperative Research and Development Agreement with Novartis Pharmaceuticals (Florham Park, NJ), and the protocol was approved by NCI/CTEP. Participants signed an IRB-approved, protocol-specific informed consent document in accordance with federal and institutional guidelines. Site participation required protocol approval by local institutional review boards, in accordance with assurances filed with the U.S. Department of Health and Human Services. The study was performed in accordance with the ethical standards as laid down in the 1964 Declaration of Helsinki and its later amendments or comparable ethical standards. The trial is registered in the public domain (clinicaltrials.gov; NCT00049127).
RESULTS
From June 2003 to May 2011, 64 patients from 22 NCCTG/Alliance treatment sites were registered. One Arm B patient was ineligible, leaving 63 evaluable patients (Phase I - 12; Phase II - 51). Patient demographics are detailed in TABLE 1.
TABLE 1.
PATIENT DEMOGRAPHICS
| Arm B: ≤2 Prior Therapies (N=39) |
Arm E: >2 Prior Therapies (N=12) |
Arm C: Phase I (N=12) |
Total (N=63) |
p value | |
|---|---|---|---|---|---|
| Age Group (years) | 0.81 | ||||
| < 50 | 25 (64.1%) | 7 (58.3%) | 9 (75.0%) | 41 (65.1%) | |
| >= 50 | 14 (35.9%) | 5 (41.7%) | 3 (25.0%) | 22 (34.9%) | |
| ECOG Performance Score | 0.221 | ||||
| 0 | 10 (25.6%) | 6 (50.0%) | 7 (58.3%) | 23 (36.5%) | |
| 1 | 23 (59.0%) | 4 (33.3%) | 4 (33.3%) | 31 (49.2%) | |
| 2 | 6 (15.4%) | 2 (16.7%) | 1 (8.3%) | 9 (14.3%) | |
| Prior Nitrosoureas | 0.00361 | ||||
| Yes | 5 (12.8%) | 7 (58.3%) | 2 (16.7%) | 14 (22.2%) | |
| No | 34 (87.2%) | 5 (41.7%) | 10 (83.3%) | 49 (77.8%) | |
| Time Since Radiation Therapy (mos.) | 0.952 | ||||
| Mean (SD) | 68.9 (59.3) | 66.7 (54.0) | 76.3 (72.5) | 69.9 (60.1) | |
| Median | 46.0 | 50.5 | 49.5 | 47.0 | |
| Q1, Q3 | 20.0, 93.0 | 23.0, 99.0 | 27.5, 104.5 | 21.0, 93.0 | |
| Range | (0.0–195.0) | (12.0–192.0) | (9.0–264.0) | (0.0–264.0) | |
| Receiving Corticosteroids | 0.581 | ||||
| Yes | 11 (28.2%) | 2 (16.7%) | 2 (16.7%) | 15 (23.8%) | |
| No | 28 (71.8%) | 10 (83.3%) | 10 (83.3%) | 48 (76.2%) | |
| Extent of Initial Resection | 0.981 | ||||
| Biopsy | 13 (33.3%) | 4 (33.3%) | 4 (33.3%) | 21 (33.3%) | |
| Subtotal Resection | 13 (33.3%) | 3 (25.0%) | 4 (33.3%) | 20 (31.7%) | |
| Gross Total Resection | 13 (33.3%) | 5 (41.7%) | 4 (33.3%) | 22 (34.9%) | |
| Histology | 0.261 | ||||
| Oligodendroglioma | 20 (51.3%) | 8 (66.7%) | 4 (33.3%) | 32 (50.8%) | |
| Oligoastrocytoma | 19 (48.7%) | 4 (33.3%) | 8 (66.7%) | 31 (49.2%) | |
| Histologic Grade | 0.791 | ||||
| 2 | 24 (61.5%) | 9 (75.0%) | 8 (66.7%) | 41 (65.1%) | |
| 3 | 13 (33.3%) | 3 (25.0%) | 4 (33.3%) | 20 (31.7%) | |
| 4 | 2 (5.1%) | 0 (0.0%) | 0 (0.0%) | 2 (3.2%) | |
| Extent of Resection for recurrence | 0.331 | ||||
| None | 16 (41.0%) | 6 (50.0%) | 5 (41.7%) | 27 (42.9%) | |
| Biopsy | 7 (17.9%) | 2 (16.7%) | 3 (25.0%) | 12 (19.0%) | |
| Subtotal Resection | 13 (33.3%) | 4 (33.3%) | 1 (8.3%) | 18 (28.6%) | |
| Gross Total Resection | 3 (7.7%) | 0 (0.0%) | 3 (25.0%) | 6 (9.5%) | |
| Histology at Recurrence | 0.911 | ||||
| Missing | 9 | 6 | 3 | 18 | |
| Oligodendroglioma | 18 (60.0%) | 4 (66.7%) | 5 (55.6%) | 27 (60.0%) | |
| Oligoastrocytoma | 12 (40.0%) | 2 (33.3%) | 4 (44.4%) | 18 (40.0%) | |
| Recurrent Tumor Grade | 0.891 | ||||
| 2 | 24 (61.5%) | 7 (58.3%) | 7 (58.3%) | 38 (60.3 %) | |
| 3 | 13 (33.3%) | 4 (33.3%) | 5 (41.7%) | 22 (34.9%) | |
| 4 | 2 (5.1%) | 1 (8.3%) | 0 (0.0%) | 3 (4.8%) | |
| Family History of Brain Tumor | 0.801 | ||||
| Yes | 6 (15.4%) | 2 (16.7%) | 1 (8.3%) | 9 (14.3%) | |
| No | 33 (84.6%) | 10 (83.3%) | 11 (91.7%) | 54 (85.7%) | |
| Number of Prior Chemotherapy Regimens | <0.00012 | ||||
| Mean (SD) | 1.2 (0.4) | 3.5 (2.0) | 1.3 (0.6) | 1.7 (1.4) | |
| Median | 1.0 | 3.0 | 1.0 | 1.0 | |
| Q1, Q3 | 1.0, 1.0 | 2.0, 4.0 | 1.0, 2.0 | 1.0, 2.0 | |
| Range | (1.0–2.0) | (2.0–9.0) | (0.0–2.0) | (0.0–9.0) | |
| 1p/19q Codeletion Status | 0.10301 | ||||
| Missing | 11 | 4 | 6 | 21 | |
| No Deletions | 13 (46.4%) | 1 (12.5%) | 4 (66.7%) | 18 (42.9%) | |
| 1p/19q Codeletion | 15 (53.6%) | 7 (87.5%) | 2 (33.3%) | 24 (57.1%) | |
Chi-Square
Kruskal Wallis ECOG: Eastern Clinical Oncology Group
Phase I Study
Twelve EIAC patients (Arm C) were accrued at the 1000 mg/day (N=9) and 1200 mg/day (N=3) dose levels. Two of six patients accrued at 1000 mg/day experienced DLT (grade 3 hypophosphatemia; altered consciousness; nausea/vomiting); however, plasma imatinib concentrations were below that necessary to inhibit PDGF, and after discussion with CTEP, an additional 3 patients were accrued at 1000 mg/D, with no DLT observed. Three patients were then treated at 1200 mg/day, with no DLT observed. No higher-dose levels were evaluated due to slow accrual, thus the planned phase II for EIAC patients (Arms A and D) was not pursued. PFS6 for the 12 Phase I EIAC patients was 33.3 % (95% C.I, 9.9–65.1), median PFS 1.9 months (95% CI, 1.7, 10.6) and median OS 14.2 months (95% CI, 8.7, 83.0). No EIAC patient had a confirmed response.
Phase II Study
51 evaluable non-EIAC patients (Arm B, N=39; Arm E, N=12) were registered. At interim analysis, 8 were alive and progression-free for ≥183 days, passing the predetermined stopping rule and prompting full accrual for the primary analysis (Arm B, ≤ 2 prior regimens). PFS6 for Arm B patients was 33.3% (90% CI 22.6, 47.6), less than the pre-specified PFS6 success threshold (45%) for the primary endpoint. Two (5%) Arm B patients achieved confirmed response (CR, PR or REGR > 4 weeks). For Arm E patients, PFS6 was 33.3% (95% CI 9.9, 65.1) with no confirmed responders.
We compared the characteristics of our study treatment population and the We compared the characteristics of our study treatment population and the NCCTG database control population. There were no significant differences between our study population patients and historical controls for the parameters of age (≤50 or > 50, p= 0.76); ECOG performance status (0, 1 or 2, p=0.99); or initial histology (oligodendroglioma or oligoastrocytoma, p=0.28). There were significant differences in histologic grade between populations with more patients in the N0272 study having Grade ≤3 tumors (96% vs 84%), and more patients with WHO grade 4 tumors in the historical group (14% vs 4%) (p=0.001).
OS and PFS by group are compared in FIGURE 1 and TABLE 2. Median OS was significantly longer in imatinib-treated patients (16.6 months, 95% CI, 8.0, 26.1) as compared with controls (8.0 months, 95% CI, 3.8, 11.3), (HR=0.64 [95% CI, 0.41, 1.0], p=0.049). However, median PFS was not different (4.0 months, 95% CI, 2.1, 5.7, vs. 1.9 months, 95% CI, 1.6, 3.4; HR=0.71; 95% CI, 0.46, 1.1, p=0.12). No difference in OS was observed in comparing patients receiving > vs. ≤ 2 prior chemotherapy regimens (HR=1.43 [95% CI, 0.73, 2.8], p=0.30; Arm E: 15.1 months (95% CI, 8.0, 43.9) and Arm B: 16.6 months (95% CI, 7.2, 29.8). Similarly, PFS did not differ (HR=1.05 [95% CI, 0.54, 2.03], p=0.88: Arm E: 4.5 months (95% CI, 2.2, 28.1); Arm B: 4.0 months (95% CI, 1.9, 6.2). No differences in PFS or OS were observed as a function of ECOG performance status (0–1 versus 2: PFS, p=0.88; OS, p=0.89); tumor grade (WHO Grade II vs Grade III: PFS, p=0.93; OS, p=0.60); histology (oligoastrocytoma vs. oligodendroglioma: PFS, p=0.53; OS, p=0.44); or age (< or ≥50: PFS, p=0.89; OS, p=0.92). At time of data lock (September 01, 2017), three patients were alive, two still receiving imatinib therapy 7 and 11 years from registration. receiving imatinib therapy 7 and 11 years from registration.
Figure 1.
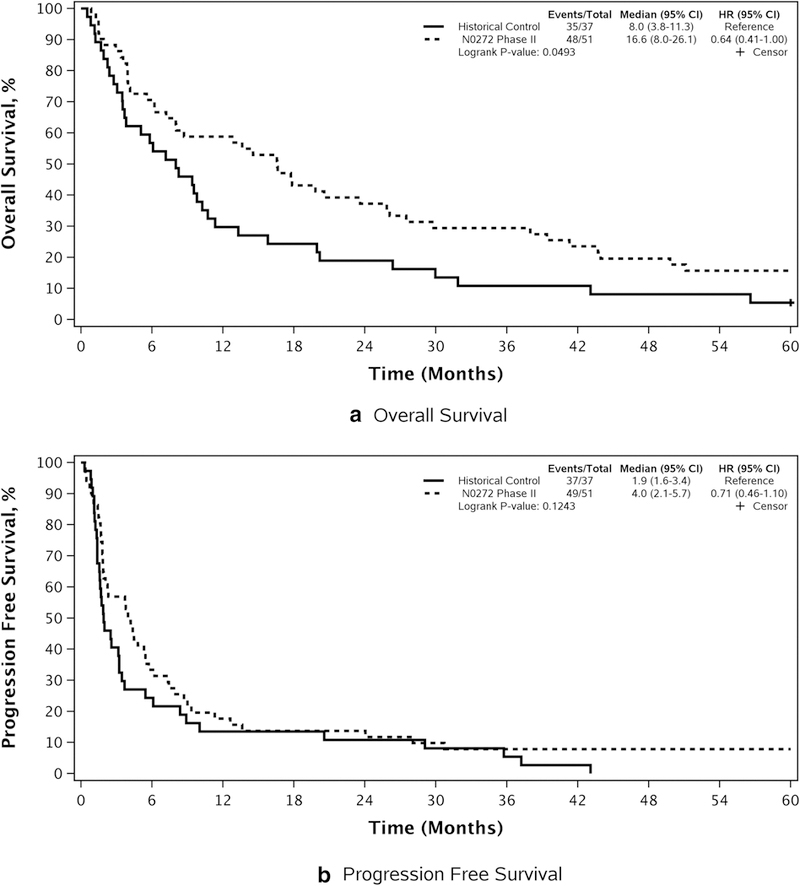
Phase II study non-EIAC patients (N=51): OS and PFS compared with historical database control patients. a Overall survival. b Progression-free survival
TABLE 2.
COMPARISON OF OS AND PFS BY PROGNOSTIC VARIABLE
| Overall Survival | Progression Free Survival | |||||||
|---|---|---|---|---|---|---|---|---|
| Event/Total | Median (95% CI)KM |
Hazard Ratio (95% CI)Cox |
P-value | Event/Total | Median (95% CI)KM |
Hazard Ratio (95% CI)Cox |
P-value | |
| ECOG Performance Score | 0.89* | 0.88* | ||||||
| 0, 1 | 40/43 | 14.6 (6.2-29.8) | 1.06 (0.49-2.27) | 41/43 | 3.8 (1.9–6.2) | 1.06 (0.49-2.29) | ||
| 2 | 8/8 | 18.6 (16.6-67.9) | Reference | 8/8 | 4.7 (4.0–24.0) | Reference | ||
| Histologic Grade | 0.60* | 0.93* | ||||||
| Grade 2 | 31/32 | 17.2 (13.6-43.7) | 0.85 (0.46-1.56) | 32/32 | 4.6 (3.8–7.9) | 0.97 (0.53-1.79) | ||
| Grade 3/4 | 16/18 | 10.4 (3.9-29.8) | Reference | 16/18 | 2.2 (1.8–9.0) | Reference | ||
| Histology of Primary | 0.44* | 0.53* | ||||||
| Oligoastrocytoma | 22/23 | 8.0 (5.6–25.9) | 1.25 (0.71-2.23) | 22/23 | 4.0 (2.1–6.2) | 1.20 (0.68-2.13) | ||
| Oligodendroglioma | 26/28 | 17.8 (12.8-43.7) | Reference | 27/28 | 4.5 (1.8–9.3) | Reference | ||
| Age Group | 0.92* | 0.89* | ||||||
| < 50 | 31/32 | 18.8 (8.0-39.4) | 0.97 (0.54-1.76) | 32/32 | 4.4 (2.2–8.7) | 0.96 (0.53-1.74) | ||
| >= 50 | 17/19 | 13.6 (6.2-43.9) | Reference | 17/19 | 2.3 (1.8–7.9) | Reference | ||
| Co-deletion Status | 0.019* | 0.027* | ||||||
| 1p/19q Co-deletion | 20/22 | 19.2 (16.6-43.9) | 0.43 (0.21-0.89) | 20/22 | 5.4 (4.2–9.3) | 0.44 (0.21-0.93) | ||
| No Deletion | 14/14 | 6.2 (3.9–23.6) | Reference | 14/14 | 1.9 (1.5–7.4) | Reference | ||
ECOG= Eastern Clinical Oncology Group OS= overall survival; PFS = progression-free survival; KM=Kaplan-Meier method; Cox=Cox model;
Logrank test
Tumor 1p/19q codeletion status was available from 36/51 (71%) imatinib-treated patients on the Phase II study (codeleted-61.1%; not codeleted −38.9%). OS was longer in the 1p/19q codeleted patients (19.2 vs. 6.2 months, HR = 0.43, 95% CI, 0.21, 0.89, p=0.019), as well as PFS (5.4 vs. 1.9 months, HR = 0.44, 95% CI, 0.21, 0.91, p=0.023). 1p/19q codeletion status was not available on the database control patients to permit comparisons. Similarly, IDH mutation status was not available from enough patients to perform meaningful comparisons.
Adverse Events
Adverse events are detailed in TABLE 3. At least one Grade 3+ event occurred in 61% of patients, commonly hematologic toxicity, fatigue, nausea, diarrhea, or hypophosphatemia. Overall, 15.7% of phase II patients (but no Phase I patients) withdrew from treatment due to AE. Six (9.5%) developed CNS hemorrhage (Grade 2- two pts; Grade 3-three; Grade 4-two), resulting in treatment discontinuation in three. One patient developed subdural bleeding during cycle 49, and after recovery received treatment to cycle 99 without further event.
TABLE 3.
ADVERSE EVENTS (NCI CTC Grade 3+) BY TREATMENT ARM, ALL ATTRIBUTIONS*
| Patients with a maximum: | Arm | N | (%) |
|---|---|---|---|
| Grade 3 Event | B | 16 | (40.0%) |
| C | 5 | (41.7%) | |
| E | 5 | (41.7%) | |
| Grade 4 Event | B | 9 | (22.5%) |
| C | 0 | (0.0%) | |
| E | 1 | (8.3%) | |
| Grade 5 Event | B | 3 | (7.5%) |
| C | 0 | (0.0%) | |
| E | 0 | (0.0%) | |
| Hematologic Adverse Events | |||
| Grade 3 Event | B | 5 | (12.5%) |
| C | 0 | (0.0%) | |
| E | 2 | (16.7%) | |
| Grade 4 Event | B | 3 | (7.5%) |
| C | 0 | (0.0%) | |
| E | 0 | (0.0%) | |
| Grade 5 Event | B | 0 | (0.0%) |
| C | 0 | (0.0%) | |
| E | 0 | (0.0%) | |
| Non-Hematologic Adverse Events | |||
| Grade 3 Event | B | 14 | (35.0%) |
| C | 5 | (41.7%) | |
| E | 4 | (33.3%) | |
| Grade 4 Event | B | 8 | (20.0%) |
| C | 0 | (0.0%) | |
| E | 1 | (8.3%) | |
| Grade 5 Event | B | 3 | (7.5%) |
| C | 0 | (0.0%) | |
| E | 0 | (0.0%) | |
Evaluable Patients: Arm B: <= 2 prior regimens, N = 4; Arm C: Phase I = N=12 Arm E: > 2 prior regimens, N=12
Pharmacokinetic Analysis
Baseline and steady-state (day 28) plasma samples were obtained from 21 patients for imatinib and CGP74588 concentrations (Non-EIAC: 16, EIAC: 5 patients) (TABLE 4). Sixteen patients had an additional sample at day 56 (Non-EIAC: 12, EIAC: 4).
TABLE 4.
PHARMACOKINETIC ANALYSIS: STEADY STATE PLASMA CONCENTRATIONS OF IMATINIB AND CGP72488
| IMATINIB STEADY-STATE PLASMA CONCENTRATIONS (ng/ml) | |||
|---|---|---|---|
| Non-EIAC Patients (600 mg/D) Mean (95% CI) |
EIAC patients (1000 mg/D) Mean (95% CI) |
p-value | |
| Day 28 | 2513 (1831, 3195) | 1318 (189, 2447) | 0.061 |
| Day 56 | 2297 (1323, 3272) | 1052 (0, 2317) | 0.131 |
| Change: Day 28 to 56 | −199 (−925, 528) 3 | 0.582 | |
| CGP72488 STEADY-STATE PLASMA CONCENTRATIONS (ng/ml) | |||
|---|---|---|---|
| Non-EIAC Patients (600 mg/D) Mean (95% CI) |
EIAC Patients (1000 mg/D) Mean (95% CI) |
p-value | |
| Day 28 | 676 (477, 875) | 593 (215, 972) | 0.721 |
| Day 56 | 540 (297, 784) | 533 (145, 921) | 1.01 |
| Change: Day 28 to 56 | −98 (−239, 44) 3 | 0.302 | |
EIAC= enzyme-inducing anti-convulsants
Wilcoxon Rank-Sum test;
Wilcoxon Signed-Rank test;
Pooled to include both non-EIAC and EIAC
There was a trend toward higher day 28 imatinib concentrations in non-EIAC patients receiving 600 mg/day (2513 ng/ml, 95% CI, 1831, 3195), compared with EIAC patients receiving 1000 mg/D (1318 ng/ml, 95% CI, 189, 2447, p=0.06). No differences in CGP74588 concentrations were observed between cohorts (non-EIAC: 676 ng/ml, 95% CI, 477, 875; EIAC: 593 ng/ml, 95% CI, 215, 972, p=0.72). No differences were observed between steady-state concentrations at day 28 versus day 56 (change, day 28–56: imatinib-199 ng/ml; 95% CI, −925, 528; p=0.58. CGP74588– 98 ng/ml; 95% CI, −239, 44; p=0.30.) No differences in steady-state (Day 28) concentrations of imatinib or CGP74588 were observed as a function of baseline steroid treatment (yes/no) (p=0.44 and p=0.3, respectively); frequency of CTC grade ≥ 3 AEs (yes/no), (p = 0.88 and p=0.72, respectively); or attainment of PFS6 (yes/no) (p=0.18 and p=1.00, respectively).
DISCUSSION
Amplification of the PDGF-A gene and overexpression of PDGFR-A and B receptors and PDGF-A ligand is observed in oligodendroglioma. [1,2,4] PDGFR gene overexpression associates with proliferation and anaplastic transformation of oligodendroglioma in murine models. [10,11] Imatinib mesylate is an ATP-mimetic type III tyrosine kinase inhibitor, with affinity for PDGF-A and PDGF-B receptors, c-KIT, CSF-IR, discoidin domain receptor, c-fms, Abl and arginine kinases. [12,13]. Imatinib is metabolized by CYP3A4 and CYP3A5 to the active N-demethylated piperazine derivative CGP7488. In U87-MG and U373-MG glioma cell lines, imatinib inhibits Akt-mTOR signaling, activates ERK 1/2, and induces cytotoxicity. [14] Imatinib is approved by the US Food and Drug Administration for chronic myeloid and acute lymphoblastic leukemia, and gastrointestinal stromal tumors. [15]
Imatinib is highly protein bound in plasma, has limited blood-brain barrier penetration, [16] and is a substrate for efflux transporters. [17] In GBM, intratumoral concentrations of 1,530 ng/g (range, 180–3,323) have been attained, with evidence of target activity, characterized by increase in p27 checkpoint expression, reduction in phospho-AKT-1 or MAPK expression. [18]
There are prior published studies of imatinib in treatment of recurrent glioma patients [19–23]. In a study of 55 patients with recurrent high-grade gliomas, PFS6 was 10% and 3% for Grade III and IV tumors respectively, with overall response (CR+PR) rate of 6%. [22]. Imatinib has been combined with hydroxyurea as well, with PFS6 of 24% for Grade III and 11% for Grade IV patients, and median PFS of 43.5 weeks for Grade II patients [20,21,23]. Probably the most relevant prior report involved imatinib treatment of 35 recurrent oligodendroglial tumor patients, in which PFS6 of 12%, median OS of 5.3 months, and a CR+PR rate of 3% was observed [23]. The authors are keenly aware of the the caveats involved in cross-study comparisons involving modest patient numbers. However, these prior outcome results [23] were somewhat inferior to that observed in our current study (PFS6–33%, median OS 16.6 months, CR+PR 5%). Nevertheless, in our study, the primary endpoint (PFS6) did not meet our pre-specified threshold for success (45%). threshold for success (45%).
In non-EIAC patients (600 mg/day), the observed steady-state plasma imatinib concentration (mean, 2513 ng/ml, 95% CI: 1831, 3195) did exceed that which is considered nominal for efficacy in CML patients (1099 ng/ml) treated with 400 mg/D. [25]. However it is important to note in the CML study, CNS relapse rate was 20%, and mean CSF concentration (0.088 +/−0.029 micromoles) was below that necessary to inhibit BCR-ABL. [25]
Interestingly, the frequency of CNS hemorrhage (9.5%) was higher in our population than previously reported (≤ 1.5%) for imatinib-treated astrocytoma patients. [19–23] Although the reasons are unclear, oligodendrogliomas are relatively vascular tumors, and CNS hemorrhage has repeatedly been reported in this population. [26–27]
It is important to point out that N0272 was conducted prior to the current WHO 2016 criteria for diagnosis of oligodendroglioma, which now requires characteristic histologic features, 1p/19q codeletion, and IDH mutation . [28] We recognize that our outcome results theoretically might vary from that which might be observed in a population defined by current WHO 2016 criteria, due to inclusion of non-1p/19q codeleted patients in the analysis. At the time of initiation of N0272, 1p/19q codeletion was not required for eligibility. The authors recognize that potential imbalance for these parameters might have introduced bias, which may be pertinent to our observations of longer OS in our imatinib-treated patients versus our database controls. longer OS in our imatinib-treated patients versus our database controls.
CONCLUSION
In patients with recurrent oligodendroglial tumors, imatinib administered in this dose and schedule did not meet our pre-study threshold (PFS6) for success. Although a significant increase in median OS was observed in imatinib-treated patients compared with our NCCTG database controls, caveats are warranted given the limitations of historical database comparison. We can conclude that systemic administration of imatinib as a single agent in this dose and schedule to this cohort is unlikely to provide clinically relevant survival benefit. However, it is possible that genomic profiling might identify patients with upregulation of PDGF-related signaling events or other targets of imatinib, permitting enrichment of a population more likely to respond to treatment. Additionally, there is rationale for studies confirming entry of and target engagement by imatinib or other PDGF inhibitors in tumor tissue, or include a strategy to overcome limiting factors. Finally, given the modest adverse event profile of imatinib, there might be rationale for additional study of combination therapy (beyond hydroxyurea) in an enriched population.
Acknowledgments
Funding: Research was supported by the National Cancer Institute of the National Institutes of Health under Award Numbers U10CA180821, U10CA180882, and U24CA196171 to the Alliance (Alliance for Clinical Trials in Oncology), and U10CA180790, U10CA180844, and UG1CA189863. Content is solely the responsibility of the authors and does not necessarily represent official views of the National Institutes of Health. Supported in part by Novartis Pharmaceuticals, Florham Park, NJ.
Study ID numbers: NCI-2011-01576; NCCTG/Alliance N0272
The following institutional networks participated in this study:
Cancer Alliance of Nebraska, Omaha, NE, Gamini Soori; Carle Cancer Center NCI Community Oncology Research Program, Urbana, IL , Kendrith Rowland, UG1CA189861; Geisinger Cancer Institute NCI Community Oncology Research Program, Danville, PA, Srilatha Hosur, UG1CA189847; Iowa Oncology Research Assoc.; Mayo Clinic LAPS, Rochester, MN, Steven Alberts, U10CA180790; Metro Minnesota Community Oncology Research Consortium, Saint Louis Park, MN, Daniel Anderson, UG1CA189863; Michigan Cancer Research Consortium NCORP, Ann Arbor, MI, Philip Stella, UG1CA189971; Montana Cancer Consortium NCORP, Billings, MT, Benjamin Marchello, UG1CA189872; Sanford NCI Community Oncology Research Program of the North Central Plains, Sioux Falls, SD, Preston Steen, UG1CA189825; Toledo Community Hospital Oncology Program CCOP, Toledo, OH, Rex Mowat; and Wichita NCI Community Oncology Research Program, Wichita, KS, Shaker Dakhil, UG1CA189808.
Footnotes
Conflicts of Interest: the authors declare that they have no conflict of interest.
REFERENCES
- 1.Smith JS, Wang XY, Qian J, Hosek SM, Scheithauer BW, Jenkins RB, James CD. (2000) Amplification of the platelet-derived growth factor receptor -A (PDGFRA) gene occurs in oligodendrogliomas with Grade IV anaplastic features. J Neuropathol Exp Neurol 59:495–503. [DOI] [PubMed] [Google Scholar]
- 2.DiRocco F, Carroll RS, Zhang J, Black PM. (1998) Platelet-derived growth factor and its receptor expression in human oligodendrogliomas. Neurosurgery 42:341–6. [DOI] [PubMed] [Google Scholar]
- 3.Ranza E, Mazzini G, Facoetti A, Nano R. (2010) In-vitro effects of the tyrosine kinase inhibitor imatinib on glioblastoma cell proliferation. J Neurooncol 96:349–57. [DOI] [PubMed] [Google Scholar]
- 4.Fleming TR. (1982) One-sample multiple testing procedure for phase II clinical trials. Biometrics 38:143–51. [PubMed] [Google Scholar]
- 5.Duffy D, Santner T. (1987) Confidence intervals for a binomial parameter based on multistage tests. Biometrics 43:81–93. [Google Scholar]
- 6.Clopper C, Pearson ES. (1934) The use of confidence or fiducial limits illustrated in the case of the binomial. Biometrika 26:404–13. [Google Scholar]
- 7.Altman DG. (1991) Practical statistics for medical research. Chapman and Hall, London, 1991. [Google Scholar]
- 8.Moses LE, Emerson JD, Hosseini H. (1984) Analyzing data from ordered categories, New Engl J Med 311:442–448. [DOI] [PubMed] [Google Scholar]
- 9.Rajkumar SV, Buckner JC, Schomberg PJ, Reid JM, Bagniewski PJ, Ames MM, Cascino TL, Marks PS. (1998) Phase I and pharmacokinetic study of preirradiation chemotherapy with BCNU, cisplatin and etoposide and accelerated radiotherapy in patients with high-grade gliomas. Int J Radiat Oncol Biol Phys 42:969–75. [DOI] [PubMed] [Google Scholar]
- 10.Appollini I, Calzolari F, Barilari M, Terrile M, Daga A, Malatesta P. (2012) Antagonistic modulation of gliomagenesis by Pax6 and Olig2 in PDGF-induced oligodendroglioma. Int J Cancer 131:1078–87. [DOI] [PubMed] [Google Scholar]
- 11.Dai C, Lyustikman Y, Shih A, Hu X, Fuller GN, Rosenblum M, Holland EC. (2005) The characteristics of astrocytomas and oligodendrogliomas are caused by two distinct and interchangeable signaling formats. Neoplasia 7:397–406. [DOI] [PMC free article] [PubMed] [Google Scholar]
- 12.Doucette T, Yang Y, Zhang W, Fuller GN, Suki D, Fults DW, Rao G. (2011) Bcl-2 promotes malignant progression in a PDGF-B-dependent murine model of oligodendroglioma. Int J Cancer 129:2093–103. [DOI] [PMC free article] [PubMed] [Google Scholar]
- 13.Hassler MR, Vedadinejad M, Flechl B. (2014) Response to imatinib as a function of target kinase expression in recurrent glioblastoma. Springerplus 25:1–9. [DOI] [PMC free article] [PubMed] [Google Scholar]
- 14.Sugiura J, Fujiwara Y, Ando M, Kawai A, Ogose A, Ozaki T, Yokoyama R, Hiruma T, Ishii T, Morioka H, Mugishima H. (2010) Multicenter phase II trial assessing effectiveness of imatinib mesylate on relapsed or refractory KIT-positive or PDGFR-positive sarcoma. J Orthop Sci 15:654–60. [DOI] [PubMed] [Google Scholar]
- 15.Shingu T, Fujiwara K, Bogler O, Akiyama Y, Moritake K, Shinojima N, Tamada Y, Yoyoyama T, Kondo S. (2009) Inhibition of autophagy at a late stage enhances imatinib-induced cytotoxicity in human malignant glioma cells. Int J Cancer 124:1060–71. [DOI] [PubMed] [Google Scholar]
- 16.Johnson JR, Bross P, Cohen M, Rothmann M, Chen G, Zajicek A, Gobburu J, Rahman A, Staten A, Pazdur R. (2003) Approval summary: imatinib mesylate capsules for treatment of adult patients with newly diagnosed Philadelphia chromosome-positive chronic myelogenous leukemia in chronic phase. Clin Cancer Res 9:1972–9. [PubMed] [Google Scholar]
- 17.Peng B, Lloyd P, Schran H. (2005) Clinical pharmacokinetics of imatinib. Clin Pharmacokinet 44:879–94. [DOI] [PubMed] [Google Scholar]
- 18.Czyzewski K, Styczynski J. (2009) Imatinib is a substrate for various multidrug resistance proteins. Neoplasma 5:202–7. [DOI] [PubMed] [Google Scholar]
- 19.Razis E, Selviaridis P, Labropoulos S, Norris JL, Zhu MJ, Song DD, Kalebic T, Torrens M, Kalogera-Founzila A, Karkavelas G, Karanastasi S, Fletcher JA, Fountzilas G. (2009) Phase II study of neoadjuvant imatinib in glioblastoma: evaluation of clinical and molecular effects of treatment. Clin Cancer Res 15:6258–66. [DOI] [PubMed] [Google Scholar]
- 20.Desjardins A, Quinn JA, Vredenburgh JJ, Sathornsumetee S, Friedman AH, Herndon JE, McLendon RE, Provenzale JM, Rich JN, Sampson JH, Gururangan S, Dowell JM, Salvado A, Friedman HS, Reardon DA. (2007) Phase II study of imatinib mesylate and hydroxyurea for recurrent grade III gliomas. J Neurooncol 83:53–60. [DOI] [PubMed] [Google Scholar]
- 21.Reardon DA, Dresemann G, Taillibert S Campone M, van den Bent M, Clement P, Blomquist E, Gordower L, Schultz H, Raizer J, Hau P, Easaw J, Gil M, Tonn J, Gijtenbeek A, Schlegel U, Bergstrom P, Green S, Weir A, Nikolova Z. (2009) Multicentre phase II studies evaluating imatinib plus hydroxyurea in patients with progressive glioblastoma. Br J Cancer 101:1995–2004. [DOI] [PMC free article] [PubMed] [Google Scholar]
- 22.Wen PY, Yung WK, Lamborn KR Norden AD, Cloughesy TF, Abrey LE, Fine HA, Chang SM, Robins HI, Fink K , Deangelis LM, Mehta M, Di Tomaso E, Drappatz J, Kesari S, Li gon KL, Aldape K, Jain RK, Stiles CD, Egorin MJ, Prados MD. (2006) Phase I/II study of imatinib mesylate for recurrent malignant gliomas. North American Brain Tumor Consortium Study 99–08. Clin Cancer Res 12:4899–4907. [DOI] [PubMed] [Google Scholar]
- 23.Reardon DA, Desjardins A, Vredenburgh JJ, Herndon JE, Coan A, Gururangan S, Peters KB, McLendon R, Sathornsumettee S, Rich JN, Lipp ES, Janney D, Friedman HS. (2012) Phase II study of Gleevec plus hydroxyurea in adults with progressive or recurrent low-grade glioma. Cancer 118:4759–67. [DOI] [PMC free article] [PubMed] [Google Scholar]
- 24.Raymond E, Brandes AA, Dittrich C, Fumoleau P, Coudert G, Clement PM, Frenay M, Rampling R, Stupp R, Kros JM, Heinrich MC, Gorlia T, Lacombe D, van den Bent MJ, European Organisation for Research and Treatment of Cancer Brain Tumor Group Study. (2008) Phase II study of imatinib in patients with recurrent gliomas of various histologies: a European Organisation for Research and Treatment of Cancer Brain Tumor Group Study. J Clin Oncol 26:4659–65. [DOI] [PMC free article] [PubMed] [Google Scholar]
- 25.Van Obbergh F, Knoops L, Devos T, Beguin Y, Graux C, Benghiat F, Kargar-Samani K, Bauwens D, Efira A, Dubois C, Springael C, Monfort L, Connerotte T, Capron A, Delannoy A, Wallemacq P. (2017) The clinical relevance of imatinib trough concentrations in chronic myeloid leukemia. A Belgian Study. Clin Biochem 50:452–4. [DOI] [PubMed] [Google Scholar]
- 26.Leis JF, Stepan DE, Curtin PT, Ford JM, Peng B, Schubach S, Druker BJ, Maziarz RT. (2004) Central nervous system failure in patients with chronic myelogenous leukemia lymphoid blast crisis and Philadelphia chromosome positive acute lymphoblastic leukemia treated with imatinib (STI-571). Leuk Lymphoma 45:695–8. [DOI] [PubMed] [Google Scholar]
- 27.Harada K, Kiya K, Matsumura S, Mori S, Uozumi T. (1982) Spontaneous intracranial hemorrhage caused by oligodendroglioma - a case report and review of the literature. Neurol Med Chir (Tokyo) 22:81–4. [DOI] [PubMed] [Google Scholar]
- 28.Louis DN, Perry A, Reifenberger G, von Deimling A, Figarella-Branger D, Cavenee WK, Ohgaki H, Wiestler OD, Kleihues P, Ellison DW. (2016) The 2016 World Health Organization classification of tumors of the central nervous system: a summary. Acta Neuropathol 131:803–20. [DOI] [PubMed] [Google Scholar]