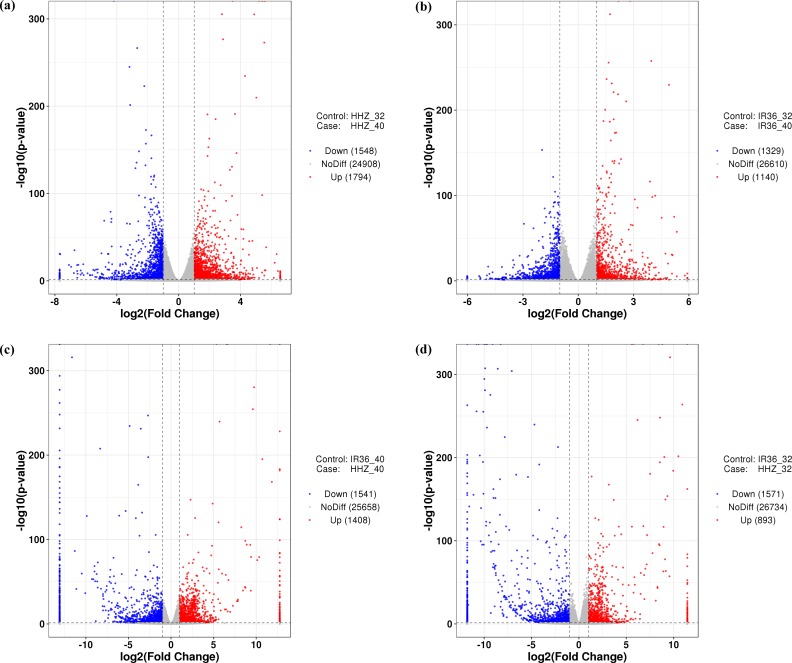
Figure 2. Gene expression in the four comparison groups.
(A) HHZ_32 vs. HHZ_40, (B) IR36_32 vs. IR36_40, (C) IR36_40 vs. HHZ_40, and (D) IR36_32 vs. HHZ_32. Red (upregulated) and blue (downregulated) dots indicate significant differences in gene expression, whereas gray dots represent genes with no significant difference in expression.

