Abstract
The serotonin 3 receptor (5-HT3R) is a calcium-permeant channel heterogeneously expressed in solitary tract (ST) afferents. ST afferents synapse in the nucleus of the solitary tract (NTS) and rely on a mix of voltage-dependent calcium channels (CaVs) to control synchronous glutamate release (ST-EPSCs). CaV activation triggers additional, delayed release of glutamate (asynchronous EPSCs) that trails after the ST-EPSCs but only from afferents expressing the calcium-permeable, transient receptor potential vanilloid type 1 receptor (TRPV1). Most afferents express TRPV1 and have high rates of spontaneous glutamate release (sEPSCs) that is independent of CaVs. Here, we tested whether 5-HT3R-sourced calcium contributes to these different forms of glutamate release in horizontal NTS slices from rats. The 5-HT3R selective agonist, m-chlorophenyl biguanide hydrochloride (PBG), enhanced sEPSCs and/or delayed the arrival times of ST-EPSCs (i.e. increased latency). The specific 5-HT3R antagonist, ondansetron, attenuated these effects consistent with direct activation of 5-HT3Rs. PBG did not alter ST-EPSC amplitude or asynchronous EPSCs. These independent actions suggest two distinct 5-HT3R locations; axonal expression that impedes conduction and terminal expression that mobilizes a spontaneous vesicle pool. Calcium chelation with EGTA-AM attenuated the frequency 5-HT3R-activated sEPSCs by half. The mixture of chelation-sensitive and resistant sEPSCs suggests that 5-HT3R-activated vesicles span calcium diffusion distances that are both distal (micro-) and proximal (nanodomains) to the channel. Our results demonstrate that the calcium domains of 5-HT3Rs do not overlap other calcium sources or their respective vesicle pools. 5-HT3Rs add a unique calcium source on ST afferents as part of multiple independent synaptic signaling mechanisms.
Keywords: 5-HT3R, TRPV1, vesicle pools, calcium domains, NTS, glutamate release
1. Introduction
Caudal NTS neurons receive a wide spectrum of visceral primary afferents and central connections from nearly every brain area (Andresen and Paton, 2011). As expected, this region contains highly diverse neurotransmitters and receptors that support abundant differential signaling (Palkovits, 1985; Van Giersbergen et al., 1992). One major class of neuromodulators includes the biogenic amine, serotonin. The serotonin receptor 3 (5-HT3R) is a ligand-gated channel that is prominently expressed in primary sensory neurons: dorsal root ganglion (Julius and Basbaum, 2001), nodose ganglion (Huang et al., 2004; Wang et al., 1997) and central afferent terminals in the brainstem nucleus of the solitary tract (NTS) (Browning, 2015; Dutta and Deshpande, 2010; Yu et al., 2008). In vivo, 5-HT3R activation in the NTS evokes a broad range of physiological processes including bradycardia, hypotension and apnea (Hayes and Covasa, 2006; Jeggo et al., 2005; Merahi and Laguzzi, 1995; Thompson, 2013). In vitro, 5-HT3R activation with phenylbiguanide (PBG) reliably increased spontaneous EPSC frequency in rats and mice, although effects on ST-EPSC amplitudes were mixed (Cui et al., 2012; Hosford et al., 2014). Neuronal cell bodies of ST afferents reside in the nodose ganglia and commonly express both −5-HT3A and 5-HT3B subunits (Mazzone and Undem, 2016; Morales and Wang, 2002). Presynaptic 5-HT3Rs have a high permeability to calcium ions (Ronde and Nichols, 1998) but cation selectivity depends on subunit expression (Barnes et al., 2009). Our aim was to determine whether 5-HT3R-sourced calcium entry contributes to regulation of glutamate release including ST synchronous and asynchronous transmission in the NTS (Peters et al., 2010).
Calcium influx initiates vesicle fusion and exocytosis (Atlas, 2013; Kaeser and Regehr, 2014), a process that is very diverse in solitary tract (ST) afferent terminals. The afferent fibers within the ST predominantly consist of unmyelinated (C-fiber) cranial visceral afferents accompanied by ~10% myelinated fibers. A mixture of voltage-activated calcium channel subtypes (CaVs) supports synaptic transmission during ST activation (Mendelowitz et al., 1995). The calcium flux through CaVs initiates synchronous release of glutamate vesicles timed with the action potential This evoked mode of glutamate release is indistinguishable for A- and C-fiber ST afferents and is generally resistant to the intracellular calcium buffers EGTA and BAPTA (Fawley et al., 2016). An inability of the chelation to capture CaV-sourced calcium before it triggers glutamate release has been attributed to a short diffusion distance (less than 100 nm) from the channel consistent with vesicles arranged in a nanodomain (Biederer et al., 2017; Stanley, 2016). C-fiber afferents feature additional, asynchronous events following trains of ST activation. Asynchronous events also depend on CaV calcium entry but are readily susceptible to intracellular calcium buffers, a finding consistent with substantial diffusion distances from the CaV to the vesicle release sites within a microdomain (>100 nm). Most ST terminals express Transient Receptor Potential Vanilloid Type 1 (TRPV1) receptors that trigger glutamate release that is unaffected by exogenous calcium buffers indicating that such vesicles lie close to the channel (Fawley et al., 2016). Despite coexpression within single ST afferents, activation of TRPV1 does not affect CaV-mediated release probability (Fawley et al., 2015). Together, these results demonstrate that CaVs and TRPV1 are contained within separate release domains and generate independent release of neurotransmitter.
In the present study, we tested whether activation of 5-HT3Rs influenced CaV and/or TRPV1-mediated forms of glutamate release. We used the selective 5-HT3R agonist, mchlorophenylbiguanide HCl (PBG), to augment calcium entry into ST afferent terminals and a chelator to capture diffusing calcium. Our results reveal that 5-HT3R-activation has two distinct actions – one within ST terminals that selectively increased spontaneous vesicle release and another that inhibited axonal conduction into the synaptic terminals and is presumed to be located remotely along ST axons. Calcium buffers only partially inhibited the 5-HT3R-induced increase in spontaneous release and suggests that calcium entry via 5-HT3Rs accessed both nano- and microdomain distributed vesicles that were independent of CaV linked vesicles. 5-HT3Rs, CaVs and TRPV1 are diverse calcium entry sources that activate segregated release mechanisms and provide substructures responsible for discrete, mode-selective signaling from C-type afferent endings.
2. Results
2.1. Classification and inclusion requirements
Each N reported is data collected from a single neuron from a single animal. Individual neurons were considered 5-HT3R+ only if PBG caused a statistically significant changes in sEPSC rates and/or latency. Only results for individually responsive neurons (e.g. 5-HT3R+) were included in aggregate group summaries. If a neuron was only sEPSC responsive, only data from sEPSCs were used in group data. If a neuron was sEPSC and latency responsive, data from each measure from the single neuron was counted. Each neuron was only counted once in the classification of response distribution.
2.2. PBG increases spontaneous EPSC rate, but not evoked EPSC amplitudes
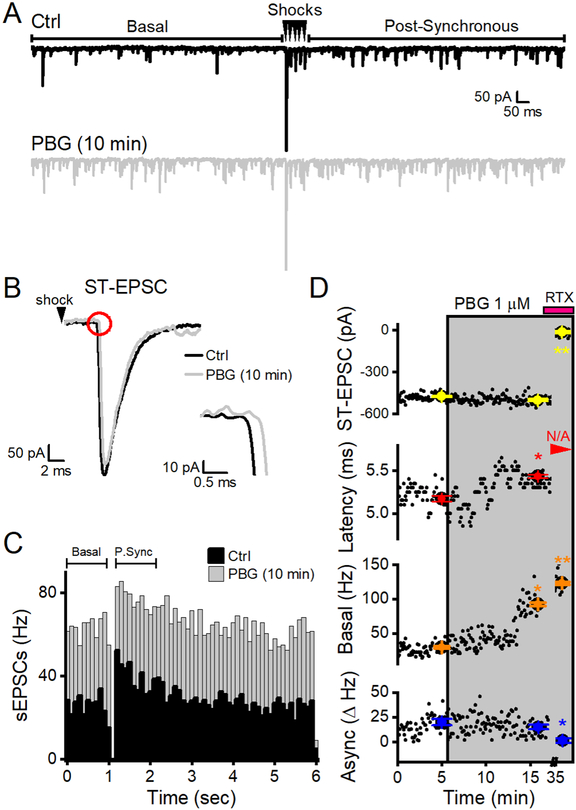
Electrical activation of ST afferents evoked large amplitude, glutamatergic EPSCs that depressed substantially with repeated activation (Figure 1). Such bursts in ST stimuli commonly triggered additional transient increases in sEPSC frequency that trail asynchronously. We assessed three distinct aspects of glutamate release in all tested neurons: basal, ST-evoked, and asynchronous. Application of the 5-HT3R agonist PBG had surprisingly discrete actions on synaptic glutamate transmission (Figure 1). PBG substantially increased basal EPSC frequency in most neurons (20/27 5-HT3R+ neurons). Despite this pronounced increase in spontaneous release frequency, the amplitudes of the ST-EPSCs remained unchanged indicating separate release mechanisms (Figure 1B, D). The differential nature of these responses suggested that 5-HT3R activation mobilized spontaneous glutamate release without affecting release from the conventional, readily releasable pool of glutamate vesicles linked to action potential-evoked release and CaV activation. This finding implies that calcium entering presynaptic terminals via 5-HT3Rs does not reach vesicles in the readily releasable pool and that 5-HT3Rs control a separate set of vesicles.
Figure 1.
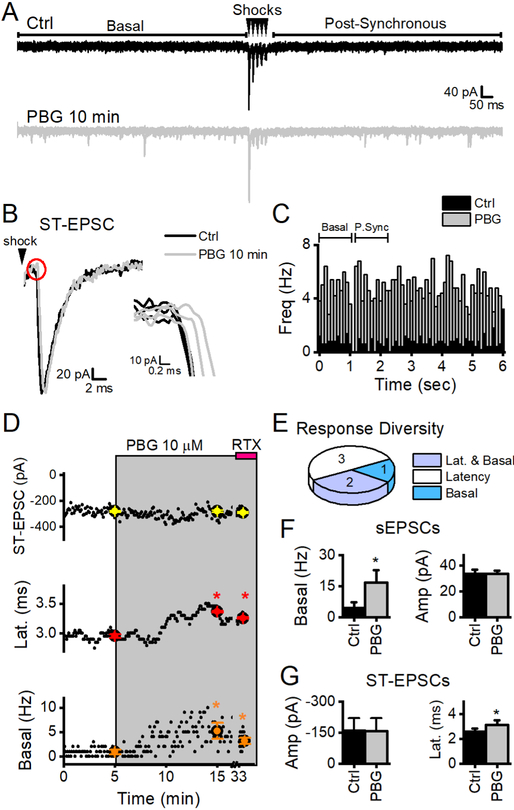
PBG selectively increased the frequency of basal sEPSCs and delayed the arrival of ST-EPSCs. Data are from a single representative neuron receiving a TRPV1+ afferent. A, In the top panel, two sweeps are overlaid in control conditions. Spontaneous EPSCs in the first second prior to ST shocks (indicated by the bracketed line) represent the basal rate of glutamate release. Five minimal stimulus shocks to the ST (arrowheads) evoke time invariant, synchronous ST-EPSCs from a singular input and pronounced frequency-dependent depression. Spontaneous EPSC frequency dramatically increased in the one second period following the stimulation train (Post-Synchronous, bracketed line). The difference between the basal frequency and the release rate during the post-synchronous period determines asynchronous release (expressed as Δ Hz). In the bottom panel, two overlaid sweeps show that PBG (1 μM, grey) robustly increased sEPSC frequency (p < 0.01, KS test) from control (Ctrl, black traces) but not amplitudes (p > 0.01, KS test). B, A representative trace of the first STEPSC in ctrl (black) overlaid with a single trace after 10 minutes in 1 μM PBG (grey). PBG did not alter ST-EPSC amplitude (p = 0.2, t test) but the inset at a higher magnification highlights the significant delay (p < 0.01, t test) in the arrival time of the ST-EPSC (i.e., latency). For clarity in figures, original traces were low passed filtered (Bessel). C, Overlaid histograms summed sEPSCs from 20, 6 s sweeps for two minutes in control (black) and PBG (grey). Post-Synchronous (P. Sync) sEPSC rates increased dramatically after ST shocks (delivered during the gap in events at 1 s) in both conditions. While PBG dramatically increased the overall sEPSC frequency, the asynchronous component of glutamate release (Δ Hz) was unchanged (p = 0.6, t test). D, Diary plots of the measured forms of glutamate release showing PBG effects over time. Black dots indicate data from individual sweeps while the colored dots indicate mean ± SEM from two minutes - values used for statistical measurements. Shaded boxes indicate the exposure periods for PBG and RTX. PGB did not change ST-EPSC amplitudes even though it caused increases in latency and basal sEPSCs. Note that latency shifts occurred prior to sEPSC rate increases. RTX (pink bar) applied at the end of the experiment greatly increased sEPSC rates above both ctrl (p < 0.01, KS test) and PBG (p < 0.01, KS test) and consequently blocked ST-EPSCs so that amplitudes and asynchronous rates fell to zero and latency was not measurable (red arrowhead, N/A, not applicable) – identifying the afferent as TRPV1+. An * indicates a significant difference (p values < 0.05) from control and ** indicates significant from control and PBG values.
2.3. PBG depressed ST-EPSC conduction.
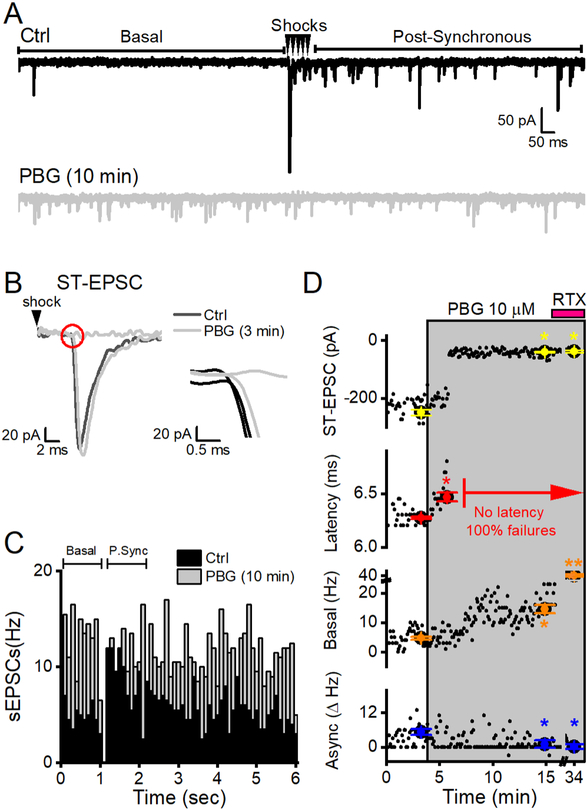
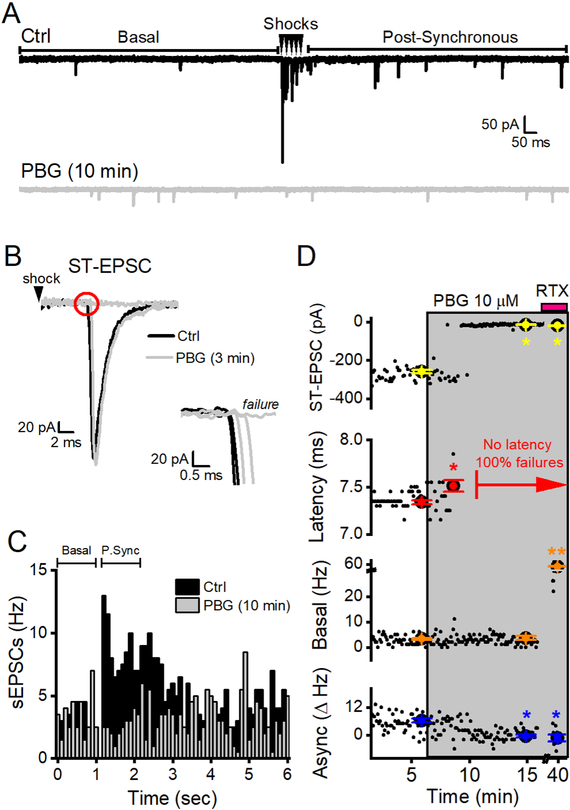
The latency from the ST shock to the arrival of the first EPSC reflects action potential conduction and this conduction process is distinct from the glutamate release process at ST synaptic terminals (Hofmann et al., 2014). PBG increased latencies in most neurons (23/27 5-HT3R+ neurons). The progressively longer arrival times (18/23 5-HT3R+ neurons with latency shifts) often led to the complete failure to evoke neurotransmitter release (Figure 2, 3). When failures occur in response to an ST shock, more vesicles are available for release in response to subsequent shocks. To isolate the direct effect of 5-HT3R activation from use-dependent changes in vesicle availability, we limited our analysis of evoked glutamate release to the first ST-EPSC.
Figure 2.
PBG-induced latency shifts often culminated in ST-EPSC failures. Data are from a single representative neuron receiving a TRPV1+ afferent. A, Two overlaid sweeps from a representative neuron in control (Ctrl, black) and after 10 minutes of 10 μM PBG (grey). PBG substantially increased basal sEPSC frequency (p < 0.01, KS test) and completely blocked STEPSCs (p < 0.01, t test). Consequently, spontaneous EPSC rates in the post-synchronous time period were equivalent to rates during the basal time period (i.e., no asynchronous events). B, A representative trace of the first ST-EPSC in ctrl overlaid with 2 traces after 3 minutes of PBG exposure, just prior to complete ST-EPSC block. PBG abruptly increased the latency of STEPSCs (p < 0.01, t test), which quickly progressed into the inability of shocks (black arrowheads) to evoke a synaptic response (failures). The inset (red circle) magnifies the trace at the time of the ST-EPSC onset. C, Histogram of event timing summed in 100 ms bins over a period of 2 min (20 sweeps). In Ctrl, post-synchronous (P. Sync) sEPSCs are greater than sEPSCs in the basal time period. The pronounced difference in this rate is the asynchronous component to glutamate release (Async, Δ Hz). After 10 min, PBG increased basal sEPSC activity (p < 0.01, KS test) and completely blocked evoked ST-EPSCs (p < 0.01, t test) – resulting in a lack in asynchronous release in the post-synchronous time period (compare to figure 1C where the asynchronous component was conserved in PBG). D, A diary plot of STEPSC amplitude, latency, basal and asynchronous (async) release for this neuron. Black dots indicate data from individual sweeps while the colored dots with error bars indicate mean ± SEM from two minutes. Latency shifts were the first sign of PGB action and a complete block of the ST-EPSCs occurred shortly thereafter. PBG also increased basal frequencies and async release dropped to zero. RTX (pink bar) applied at the end of the experiment did not change the ST-EPSC amplitude from PBG because it was already blocked. As such, the lack of ST-EPSCs resulted in no measurable latencies (as indicated in red) and no asynchronous release. RTX increased spontaneous EPSC rates above both ctrl (p < 0.01, KS test) and PBG (p < 0.01, KS test, denoted as **) to confirm the afferent as TRPV1+.
Figure 3.
PBG-induced reduction of conduction did not predict action on sEPSCs. Data are from a single neuron receiving a TRPV1+ afferent. A, Two overlaid traces in each condition show 3 measured forms of glutamate release. In control (ctrl, black, top panel), five shocks (arrowheads) to the ST evoked synchronous ST-EPSCs with pronounced frequency-dependent depression and increased rates of sEPSCs in the Post-Synchronous time period (asynchronous release). After 10 minutes of 10 μM PBG (grey, bottom panel), spontaneous glutamate release in the first second prior to ST shocks (Basal) did not change after PBG (p = 0.8, KS test). Conversely, PBG completely blocked all ST-EPSCs and ST-dependent asynchronous release. B, PBG initially increased ST-EPSC latency followed by a complete block of evoked events by 3 minutes without an intermediate reduction in evoked EPSC amplitude. The inset shows the expanded onset of the ST-EPSC (red circle) with invariant, low jitter, latency in ctrl overlaid with gradually increasing latencies in the presence of PBG that finally result in complete block of all evoked events (failure). C, PBG inhibits the pronounced increase of sEPSC frequency within the Post-Synchronous time period (P. Sync). Overlaid histograms in control (black) and after 10 minutes in 10uM PBG (grey). Each histogram contains events across two minutes for each 6 sec sweep (20 total). Individual bars represent 100 ms bins. D, Diary plots of measured variables demonstrate PBG (grey box) effects over time. Larger data points represent the mean ± SEM from 2 minutes in each condition overlay individual data points from each sweep (black dots). RTX (pink bar) did not change the ST-EPSC amplitude (because PBG previously blocked it), there were no measurable latencies (as indicated in red) and no asynchronous release. RTX increased spontaneous EPSC rates above both ctrl (p < 0.01, KS test) and PBG (p < 0.01, KS test, denoted as **) to confirm the afferent as TRPV1+. An * denotes significant differences (p < 0.05) from control and ** denotes that RTX values are significance from both ctrl and PBG.
The increase of successive latency values was often the earliest indicator of 5-HT3R activation (Figure 1B, D; Figure 2B, D). Across all experiments, if PBG delayed ST-EPSC arrival (increased latency) and increased sEPSCs (n = 28), the shifts in latencies preceded the increases in sEPSC rate (3.9 ± 0.4 vs 4.9 ± 0.3 min, p = 0.02, paired t test). Successful STEPSCs – ones in which the action potential presumably invaded the terminal - had comparable amplitudes in PBG to those in control. This indicates that failures in transmission during 5-HT3R activation are not due to a graded depression of CaVs or release probabilities within the synaptic terminals (Fawley et al., 2016), but more likely reflect an axonal location of the 5-HT3Rs that disrupt conduction.
2.4. PBG does not affect asynchronous release
The preservation of evoked ST-EPSC amplitudes during 5-HT3R activation indicates that CaV activation, and therefore the probability of release from the readily releasable pool, is unaffected. In neurons that were responsive to PBG, asynchronous rates were unaffected as long as ST stimulation evoked ST-EPSCs (Figures 1 C and D, bottom panel). In cases when PBG induced synaptic failures, asynchronous release was also absent (Figures 2, 3). These results indicate that reductions in asynchronous release rates were due to a lack of calcium through CaVs rather than a direct effect of 5-HT3R activation. 5-HT3R-sourced calcium therefore appears to have no access to the asynchronous pool of vesicles and suggests that the calcium domain of 5-HT3R does not overlap with CaVs domains.
2.5. 5-HT3Rs are not homogeneously distributed
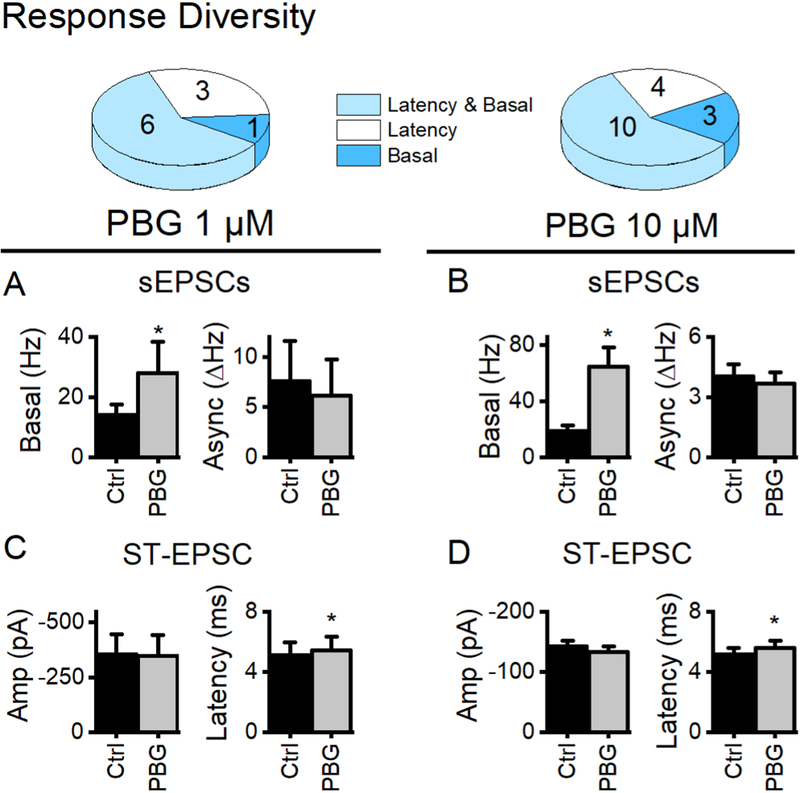
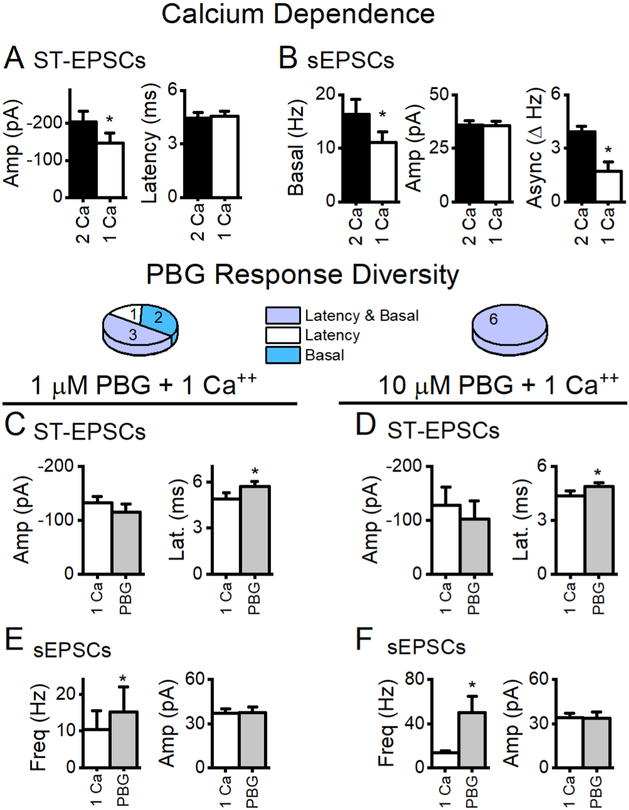
PBG commonly increased both latency and sEPSC frequency (Figure 1). This response profile is consistent with expression at two discrete, presynaptic locations– at the axon itself affecting the conduction of excitation and within the synaptic terminal affecting spontaneously released vesicles. However, in a limited set of cells (7/27 5-HT3R+ cells), PBG discretely impeded conduction without altering sEPSC frequency (Figure 3), suggesting selective axonal expression in that ST afferent. Conversely, PBG seldom (4/27 cells) enhanced basal sEPSC frequency without affecting conduction or ST-EPSC amplitude - consistent with expression limited to the synaptic terminals. NTS second order neurons were rarely PBG-unresponsive (across all experiments: 18/98). Response profiles were similar across a ten-fold increase in PBG concentration (Figure 4). Although nearly all ST afferents expressed 5-HT3Rs, axonal responsiveness was independent of terminal expression. These discrete synaptic response profiles support 5-HT3Rs localized to discrete synaptic release domains.
Figure 4.
PBG responses profiles. Summary data for 1 μM PBG is in the left column while responses to 10 μM PBG are on the right. The majority of afferents had 5-HT3 receptors on both the axon and the terminal (Latency and Basal, light blue). Overall, PBG affected latency (white + light blue) in a greater number of afferents than basal glutamate (dark blue + light blue) release from the terminal. Only data from cells with significant changes in the indicated glutamate release mode are included (i.e. cells without a PBG-induced change in basal rates were not included in the basal summary data). A, 1 μM PBG (grey bar) increased basal glutamate rates of sEPSCs in the first second prior to stimulation by ~200% (p = 0.03, paired t test, n = 7). Basal sEPSC amplitudes did not change (p = 0.8, paired t test) indicating presynaptic location of the receptor. Asynchronous rates are only present with successful ST-EPSCs. In this data set, only 3 neurons still had measurable evoked release after 10 min PBG (see inclusion requirements in methods). In those neurons, asynchronous rates were unchanged (p = 0.2, paired t test). B, In neurons exposed to 10 μM PBG, glutamate from the spontaneous vesicle pool increased over 350% (paired t test, p < 0.001, n = 13). In this subset, there were 3 neurons that met the inclusion requirements for accurate asynchronous release measurements. Similar to 1 μM, asynchronous glutamate was unaffected (p = 0.1, paired t test). C, In 3 neurons with measurable amplitudes after 10 min of 1 μM PBG, ST-EPSC amplitude was not changed (p = 0.7, paired t test) despite increased latency (p < 0.01, paired t test, n = 8). D, Similar to results in 1 μM PBG, 10 μM did not change ST-EPSC amplitude (p = 0.2, paired t test, n = 11) but increased latency an average of 450 μs (p = 0.002, paired t test, n = 10), similar to the changes at 1 μM (p = 0.3). While a higher concentration of PBG resulted in a more robust increase in sEPSCs from the basal pool (p = 0.01, t test), it still did not affect the evoked or asynchronous vesicle pools.
2.6. 5-HT3Rs on ST afferents are not tonically active
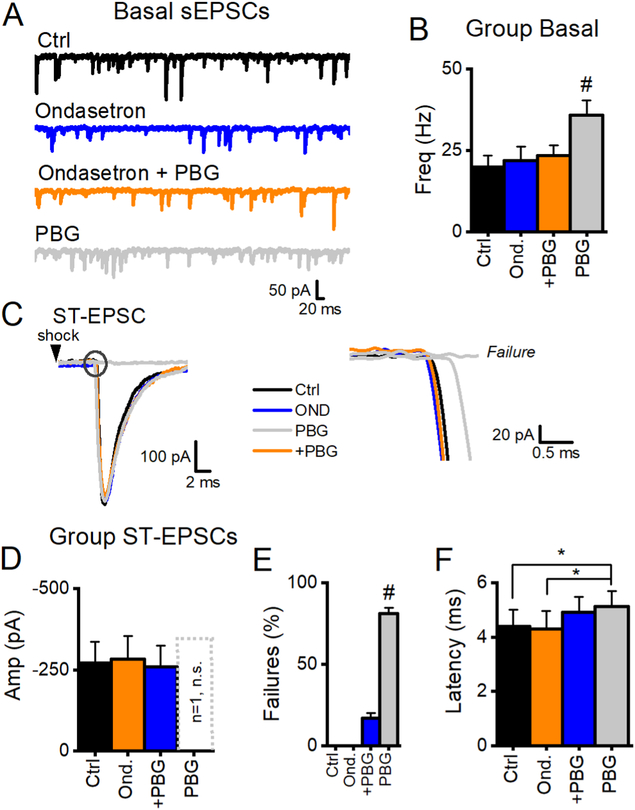
We used the selective 5-HT3R antagonist, ondansetron HCl (OND, 0.5 μM) to confirm the selectivity of PBG responses (Figure 5). OND by itself failed to alter spontaneous, asynchronous or evoked glutamate release. OND effectively and reversibly blocked PBG actions on spontaneous release so that washing OND in the continuing presence of PBG revealed the expected actions on latency and sEPSC rate (Figure 5 A, B). OND blocked PBG-induced failures and reduced latency shifts (Figure 5F). This may reflect the incomplete wash of the antagonist. Overall, our data are consistent with select action of PBG and we conclude that 5-HT3R is not tonically active in NTS slices.
Figure 5.
Selective antagonism of 5-HT3 blocked PBG-induced effects. A, Single sweeps from the same TRPV1+ afferent. The specific 5-HT3 antagonist, Ondansetron (0.5 μM blue trace) does not change basal sEPSCs frequency. Ondansetron prevented increases in sEPSC when co-applied with PBG (10 μM, orange), while grey traces show the increase in sEPSC frequency when PBG is applied by itself. B, Summary data show that this observation was consistent across neurons (n = 5) and PBG increased sEPSC frequency compared to all other groups (# p < 0.01, repeated measure ANOVA) with no other differences between groups (p > 0.2 in all cases, repeated measure ANOVA). C, Single overlaid traces of the first ST-EPSC in ctrl (black), ondansetron (blue), ondansetron + PBG (+PBG, orange) and PBG alone (grey) show that STEPSCs amplitudes are not different (p = 0.4, One Way ANOVA), even when PBG caused failures. Closer inspection of the onset ST-EPSC (black circle) reveals that PBG increased the latency and was significantly longer than during the other treatments (p < 0.05, One Way ANOVA) before failing completely. D, ST-EPSC amplitude was unchanged across cells (p = 0.4, One Way RM ANOVA). 4/5 neurons had 100% failure after 10 min in PBG so that only one cell had measurable ST-EPSC amplitudes (plotted as the hashed bar, which was not different from its matched ctrl amplitudes (p > 0.05, One Way ANOVA)). E, OND blocked PBG-induced failures and PBG increased failures compared to all other groups (p < 0.01, One Way RM ANOVA, #). F, OND did not completely block PBG-induced latency shifts, which were significant compared to Ctrl and OND (p < 0.05), but not from OND+PBG (p > 0.05, n = 5, One Way RM ANOVA). Together, these data indicate that 5-HT3Rs are not tonically active.
2.7. 5-HT3R activation enhances mEPSCs
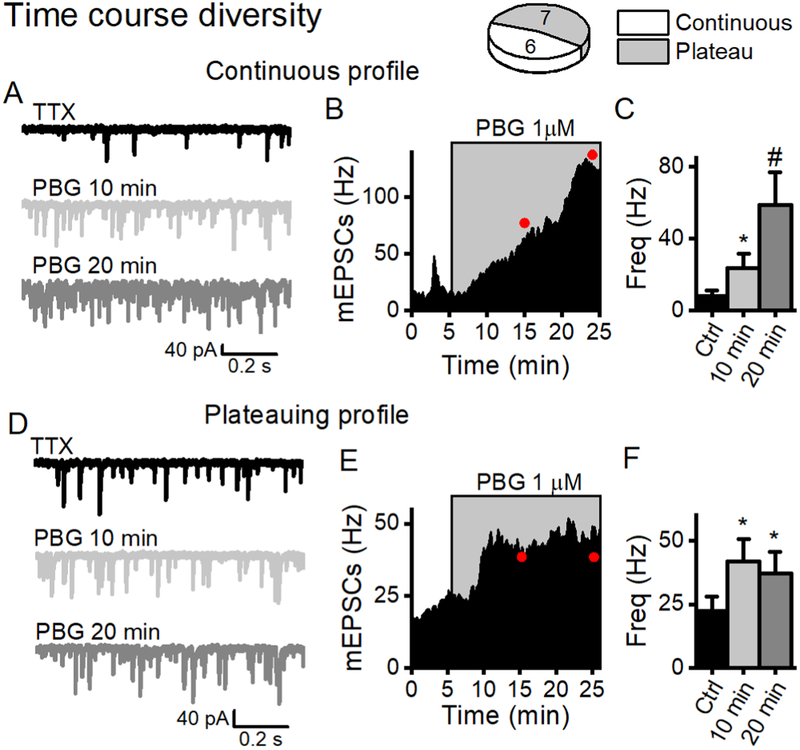
Basal rates of sEPSCs in second order NTS neurons are generally unaltered by blocking action potentials (Jin et al., 2004), but local circuits might contribute to 5-HT3R activation responses. For example, 5-HT3R activation increased sEPSC frequency that often continued to increase during prolonged exposure to PBG (Figure 2F). To test whether conducted responses contributed to the different response patterns of sEPSCs, we added TTX (1 μM) to isolate mEPSCs. Similar to sEPSCs with intact action potentials, response patterns included mEPSC frequencies that plateaued by 10 min and others that continuously increased throughout PBG exposure (Figure 6). Since PBG did not affect mEPSC amplitudes nor did it activate baseline postsynaptic currents (non-synaptic), activation of 5-HT3R is action potential-independent and confined to presynaptic elements with no functional evidence of postsynaptic expression.
Figure 6.
PBG enhanced presynaptic glutamate release that followed two time course profiles; one that continuously increased over 20 minutes and one that reached a steady rate (plateaued) by 10 minutes. We isolated mEPSCs with TTX (1μM) to test whether the amplifying response profiles of sEPSCs (see Figure 2) to prolonged 5-HT3R activation were exclusively from presynaptic contacts. A, Single traces from the same neuron demonstrate that PBG (1 μM, light grey trace) increased mEPSC frequency after 10 min compared to control (TTX, black trace), with a more pronounced effect after 20 min (dark grey trace). B, The diary plot of events in 10 s bins (filled black line) across time shows a trajectory of PBG-induced frequency (events in grey box) that increased 5-fold by 10 minutes (p < 0.01, KS test) and 10-fold by 20 minutes (compared to 10 min, p < 0.01, KS test). C, PBG increased mEPSC frequency in 6/13 neurons with a more pronounced effect after 20 minutes (p = 0.02, One Way RM ANOVA). D, Single traces from a different neuron demonstrate a robust increase in mEPSCs after 10 min in PBG (1μM, light grey) that remained elevated from control (black trace) after 20 min (dark grey). E, In contrast to (B), the diary plot shows an increase in mEPSC frequency after 10 min of PBG (p < 0.01, KS test) that remained at the same elevated rate after 20 min (10 vs. 20 min, p = 0.1, KS test). F, In neurons with this plateau profile (7/13), PBG increased mEPSC frequency after 10 min without any additional effects after 20 minutes (p = 0.3, One Way RM ANOVA). These data indicate that the prolonged increase in frequency was not due to network activity but alternatively a direct action at the presynaptic terminal.
2.8. 5-HT3Rs similarly modulate TRPV1- afferents
While 5-HT3Rs are often associated with C-fiber viscerosensory afferents (Coleridge et al., 1973; Wang et al., 1997), less evidence supports 5-HT3R expression on TRPV1- afferents. A minority of 2nd order NTS neurons failed to respond to RTX and was classified as TRPV1 (Figure 7). TRPV1- neurons had low basal sEPSC frequency and lacked asynchronous sEPSCs. PBG increased the frequency of sEPSCs and shifted ST-EPSC latency without changing amplitudes with similarly diverse response profiles as TRPV1+ afferents (Figure 7E–G). Likewise, a minority of neurons (2/7) were unresponsive to PBG. Since responses to PBG at 1 μM and 10 μM were similarly robust in TRPV1+ afferents, we combined the data from both concentrations for these rarer, TRPV1- afferents (across experiments: 14 out of 98 total neurons tested). In separate experiments, PBG significantly increased isolated mEPSC frequency in 2/6 TRPV1- neurons (individual KS tests, p values both < 0.01) but not amplitudes (KS tests, p values both ≥ 0.1) confirming the presynaptic location of 5-HT3Rs on TRPV1- afferents (data not shown). In the absence of TRPV1 receptors, 5-HT3Rs had comparable terminal and axonal sites-of-action.
Figure 7.
5-HT3 activation increases spontaneous glutamate release from TRPV1- afferents. A, Two overlaid sweeps from a single neuron receiving a TRPV1- afferent. Control (Ctrl, black) sweeps show low basal sEPSCs, characteristic of these afferents. Note that even with STEPSCs present, there is not an increase in post-synchronous events and hence no asynchronous release. After 10 minutes of PBG (10 μm, grey traces), basal sEPSC events have increased 3-fold (p < 0.01, KS test). B, Single traces of the first ST-EPSC in Ctrl and PBG are overlaid and illustrate that even with pronounced effect on sEPSCs, there was no effect on the amplitude of evoked glutamate release (p = 0.3, t test). The right panel expands the onset of the ST-EPSC outlined by the red circle. Three traces in Ctrl have near identical latencies that progressively get longer with PBG exposure (p < 0.01, t test). C, Overlaid histograms with events in 100 ms bins for each 6 sec sweep across two minutes (20 sweeps total). Note again that basal rates are equivalent to post-synchronous glutamate release. D, Diary plots of individual data points (black dots) are overlaid with data points that represent the mean ± SEM from 2 minutes in each condition (colored point with error bars). An asterisk marks significant differences from Ctrl (t test, p < 0.05). These plots illustrate a significant shift in latency and an increase in the number of basal events. Lack of an RTX (pink bar) response confirms this afferent as TRPV1-. E, PBG caused a 4 fold increase in basal sEPSC frequency (paired t test, p = 0.03) with no change in amplitudes (p = 0.9, paired t test) across responsive neurons (n = 3), indicating a presynaptic location of 5-HT3Rs. F, TRPV1- afferents had similar response diversity profiles as afferents with TRPV1. The most prominent response to PBG was a shift in latency (n = 5/6). G, Similar to TRPV1+ afferents, there was no change in ST-EPSC amplitudes (p = 0.7, n = 3, paired t test) with significant shifts in latency (p = 0.04, paired t test, n = 5).
2.9. Calcium dependence of 5-HT3R actions
Calcium entry is integral to vesicle release. At 2 mM external calcium, the probability of evoked ST-EPSC glutamate release averages ~90% (Bailey et al., 2006; Peters et al., 2008). To test whether calcium entry through CaVs saturated the vesicle pool and masked potential additional effects of calcium through 5-HT3Rs, we reduced the external bath calcium to 1 mM. As expected, reduced external calcium reduced all modes of glutamate release but did not alter ST-EPSC latencies (Figure 8–9). If the calcium entering terminals via 5-HT3R reached the evoked and/or asynchronous glutamate vesicle pools, PBG would be expected to increase the amplitude of ST-EPSCs and asynchronous release. However, in reduced external calcium PBG still failed to alter ST-EPSC amplitudes or asynchronous sEPSCs while basal sEPSC rates robustly increased. Thus, calcium saturation was not responsible for the lack of ST-EPSC responses to PBG. This suggests that calcium entering terminals through 5-HT3R acts selectively on spontaneously released vesicles but does not reach the evoked or asynchronous vesicle pools.
Figure 8.
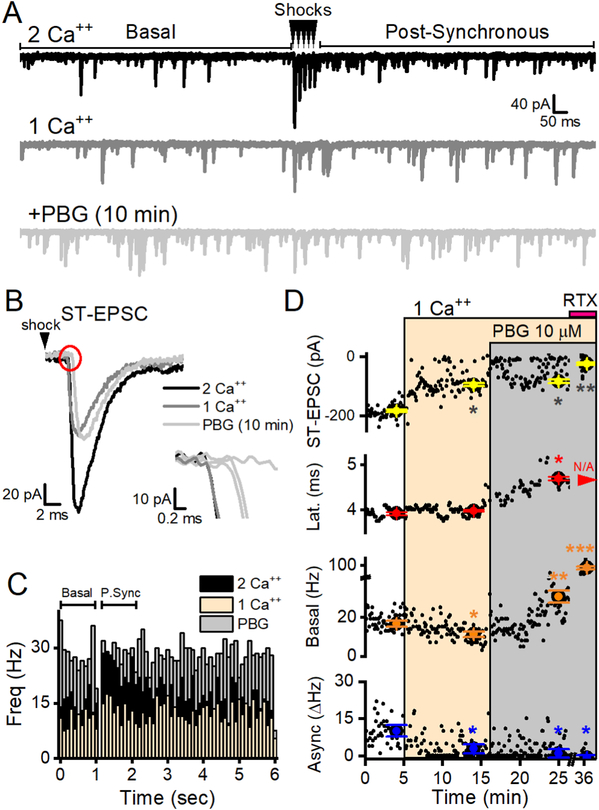
Reducing external calcium concentration reduced glutamate release but did not modify the effect of PBG. A, Two representative sweeps in each condition are overlaid. Reducing bath calcium from 2 mM (black) to 1 mM (dark grey) reduced basal sEPSC frequency, evoked ST-EPSC amplitudes and post-synchronous glutamate release. PBG still robustly increased basal EPSCs (light grey) compared to 1 mM Ca++ control. B, Reduced external calcium diminishes ST-EPSC amplitude but PBG did not have an additional effect on amplitude. The inset expands the onset of the ST-EPSC (red circle) and this higher magnification shows that bath calcium did not affect latency but PBG progressively increased the latency and caused failures. C, Overlaid histograms in control (2 Ca, black), reduced external calcium (1 Ca, light orange) and PBG in reduced external calcium (+PBG, light grey). Each histogram contains events (100 ms bins) from 20 consecutive, 6 sec sweeps. In 2 Ca, sEPSC events increase in the post-synchronous (P. Sync) period after the ST shocks compared to the sEPSC frequency during the basal time period. The change-in-rate (ΔHz) during the P. Sync period reflects asynchronous glutamate release. In 1 Ca, basal sEPSC frequency decreased with a proportionately similar reduction in asynchronous release. PBG boosts basal frequency and, during a time when ST-EPSCs were blocked, eliminated asynchronous release. D, Diary plots of the measured variables of glutamate release illustrate the effects of 1 mM Ca++ (light orange box) and PBG (grey box) over time. Individual data points (black dots) overlaid with larger, colored dots with error bars that represent the 2 minute average ± SEM. The ST-EPSC amplitude was significantly reduced in 1 mM Ca++ (p = 0.02, One Way RM ANOVA) but PBG did not further reduce the amplitude of successful events (p = 0.1, One Way RM ANOVA). Basal sEPSC activity was also reduced when bath calcium was lowered (p = 0.001, KS test) and PBG robustly increased them compared to both 1 Ca++ (p <0.001, KS test) and control (2 mM Ca++, p <0.001, KS test). Latencies were unchanged (p = 0.2, One Way ANOVA) until PBG was applied (p < 0.01, One Way ANOVA). RTX blocked ST-EPSCs and increased basal sEPSC frequency confirming that the connected afferent was TRPV1+.
Figure 9.
Reduced external calcium decreased glutamate release but did not change PBG responses. A, The amplitude of ST-EPSCs is calcium-dependent (p < 0.01, paired t test, n = 14) while the latency from the ST shock to the onset of glutamate release remained unchanged (p = 0.2, paired t test). B, Spontaneous glutamate release was also calcium sensitive (p < 0.01, paired t test) and the asynchronous component was strongly reduced in 1 mM Ca ++ (p = 0.01, paired t test). Similar to results in 2 mM external calcium, 1 μM PBG (C, E) and 10 μM (D, F) increased latencies (p = 0.03, n = 5; p = 0.048, n = 4, respectively, paired t tests) but not amplitudes (p = 0.1, n = 3; p = 0.1, n = 5, respectively, paired t tests) of ST-EPSCs and increased frequencies (p = 0.03, n = 6; p < 0.001, n = 5, paired t tests) but not amplitudes of basal sEPSC activity (both p values > 0.8, paired t test). These results demonstrate that reducing the calcium driving force does not change the diversity of PBG responses.
2.10. 5-HT3R-mediated glutamate release is susceptible to calcium chelation
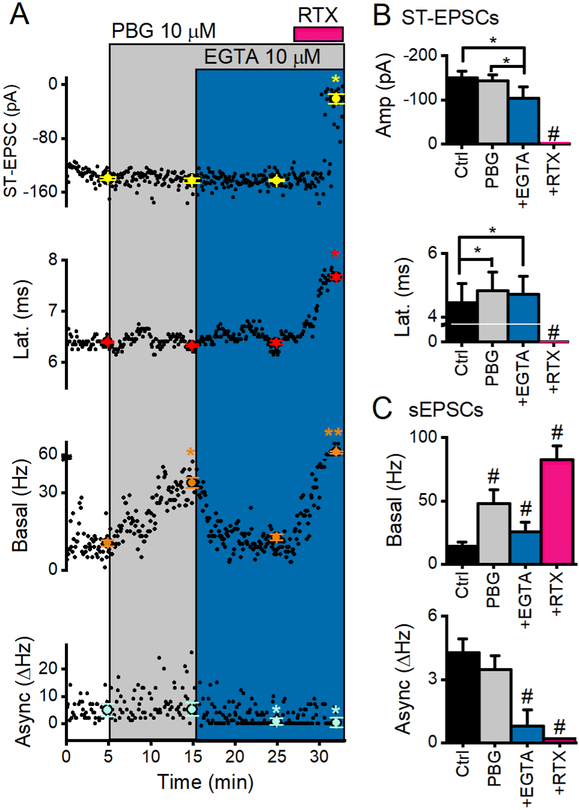
Calcium entering the terminals differentially affects evoked, asynchronous and spontaneous release and the intracellular calcium buffers, BAPTA-AM and EGTA-AM were equally effective on synaptic responses in NTS (Fawley et al., 2016). We therefore assessed the effects of calcium chelation by EGTA-AM on 5-HT3R actions (Figure 10). PBG increased sEPSC frequency by 408 ± 98% of control rates (n = 6). The addition of EGTA-AM reduced the maximal 5-HT3R-induced frequency by 55 ± 4% without reducing rates below control (Figure 10C). Thus, EGTA-AM failed to completely buffer 5-HT3-induced calcium before triggering glutamate release from the surrounding pool of vesicles (Figure 10C). The PBG-triggered vesicles vulnerable to EGTA-AM suggest that a longer diffusion distance of calcium is required while EGTA-AM resistant release may represent a protected nanodomain of vesicles arranged close to the mouth of 5-HT3Rs EGTA-AM nearly eliminated asynchronous release but evoked glutamate release persisted, consistent with vesicles with mixed diffusion distances from CaVs. RTX robustly increased basal sEPSC frequency, even in the presence of EGTA-AM, consistent with a short diffusion path of calcium from TRPV1 to its associated vesicles. These results indicate that 5-HT3R-sourced calcium activates vesicles that are located both near (persistent release) and more distant to the calcium source (EGTA-AM vulnerable).
Figure 10.
The cell-permeable calcium chelator, EGTA-AM (EGTA), buffers the effect of PBG on glutamate release. A, In a representative TRPV1+ NTS neuron, 4 simultaneous measures of glutamate release are plotted against time. Neither EGTA nor PBG reduced the amplitude of synchronous ST-EPSCs (p = 0.1, One Way ANOVA) or changed their latency (p = 0.6, One Way ANOVA) in this neuron. PBG selectivity increased basal glutamate release from control (p < 0.01, KS test) and EGTA buffered this effect (PBG vs. PBG+EGTA, p < 0.01, KS test), but did not reduce rates below control levels (frequencies in PBG+EGTA were still elevated compared to control, p <0.01, KS test). EGTA also reduced asynchronous release (p = 0.01, t test). Even though EGTA buffered PBG-induced sEPSCs, it did not block the response to RTX (pink trace). B, Across neurons (n = 6), EGTA reduced ST-EPSC amplitude by ~ 30% (p = 0.02, One Way RM ANOVA) but did not change the latency from that in PBG alone (p = 0.3, One Way RM ANOVA). C, On average (n = 6), PBG increased basal activity by nearly 400% and EGTA buffered about half of this increase (p < 0.001, One Way RM ANOVA). EGTA also buffered asynchronous release rates by ~70% (p < 0.01, n = 5, One Way RM ANOVA). While EGTA was effective in buffering PBG-induced increases of sEPSC frequency, it did not prevent RTX effects, indicating a tight association of TRPV1-triggered vesicles to the receptor. An * indicates significance from control *** indicates significance from each of the other (3) groups.
3. Discussion
The sensory neurons that give rise to ST afferent terminals are highly diverse with multiple CaVs, differentially expressed GPCRs, and utilize both glutamate and peptides for neurotransmission (Andresen et al., 2007; Andresen et al., 2012; Schild and Kunze, 2012). The complexity of synaptic signaling hinges on the entry and destination of calcium. The present study evaluated the interaction of calcium entry via 5-HT3Rs on the different forms of glutamate release. Collectively, several new findings indicate that 5-HT3Rs provide calcium that triggers release from a vesicle pool with distinct characteristics: 1) Calcium entry through 5-HT3Rs triggered a robust increase in sEPSCs frequency but 2) did not affect evoked or asynchronous release, forms of glutamate release mediated by CaVs. 3) 5-HT3R activation delayed ST-EPSC arrivals often to the point of complete synaptic failure. 4) 5-HT3R-triggered vesicles were only partially vulnerable to calcium chelation. Together, these data indicate two independent 5-HT3R locations on ST afferents – expression at the terminals that preferentially increases spontaneous glutamate release probability and expression outside of the terminal (probably axonal) that slows or blocks excitation and propagation of action potentials into the terminal release sites. Interestingly, these effects were not mutually exclusive and occurred in all ST afferent classes. These new findings reveal that 5-HT3R-sourced calcium releases vesicles from an independent pool and does not alter vesicle release from CaV calcium domains.
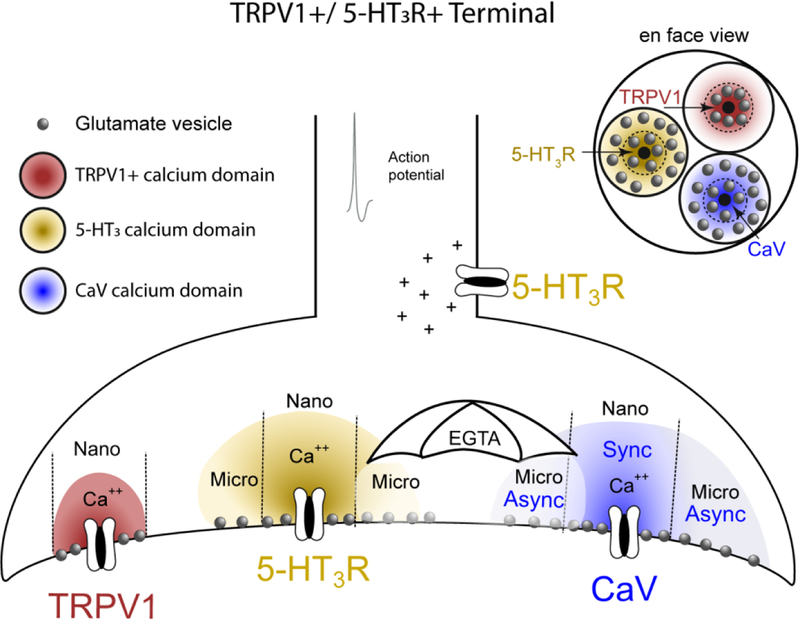
The spatial organization of vesicles in relation to a calcium entry point is crucial for calcium sensor activation and release timing. The calcium concentration is highest close to the pore and decreases substantially over a nanometer scale (Biederer et al., 2017; Chanaday and Kavalali, 2018; Oheim et al., 2006). While differences in vesicle release machinery are undoubtedly important, evidence for the existence and positioning of different binding proteins and calcium sensors is lacking in most native systems, including at the ST-NTS synapse. Differing calcium sensors within a single vesicle pool could account for our EGTA-AM results, but such resolution is beyond our experimental approach. Lacking other evidence, we attribute differing synaptic release kinetics to differences in calcium concentration and the spatial distributions of vesicles. The EGTA-AM results suggest that the diffusion path across distance defines functional calcium domains (Figure 11). The differences in EGTA-AM interventions as well as the lack of interaction among calcium sources in steady-state release responses suggest that the various modes of transmission (synchronous, asynchronous, and spontaneous) arise from spatially separated vesicle populations.
Figure 11.
Schematic illustration of the hypothesized calcium domains and vesicle arrangements of 5-HT3R, CaV and TRPV1 on a single ST afferent terminals. Calcium (Ca++, colored domes) enters the channel and mobilizes glutamate vesicles (gray spheres) at varying distances from the calcium source. Calcium spreads from the channel pore opening exposing the surrounding vesicles to calcium concentrations that decline with distance (represented by the color density gradient). 5-HT3Rs located on the axon slows action potential conduction, often preventing action potentials from invading the synapse. Calcium entry through terminal 5-HT3Rs mobilizes vesicles within both a nanodomain (nano) and microdomain (micro) that does not overlap the calcium domains and respective vesicle pools from other calcium channels. EGTAAM (EGTA, umbrella) defines calcium domains based on its time-dependent ability to chelate calcium. EGTA is ineffective at chelating calcium within an immediate nanodomain close to the pore. EGTA effectively chelates calcium and reduces calcium levels distal to the pore, and reduces release by “shielding” vesicles from release within the microdomain. Each calcium source has a vesicle population located within nanodomains whose release is unaffected by EGTA. 5-HT3R and CaV both have vesicles additionally located within a microdomain but TRPV1 does not.
Our results suggest that the functional actions of 5-HT3R activation are entirely presynaptic and are due to depolarization and calcium entry. The absence of postsynaptic responses correlates with widespread receptor expression in the antecedent nodose ganglion neurons (Morales and Wang, 2002) that disappears following nodosectomy (Pratt and Bowery, 1989). Latency changes and failures to evoke synchronous release likely represents depolarizing inactivation of voltage-dependent channels of the action potential and corresponds to the expected actions of depolarization on axons where 5-HT3R have been observed ultrastructurally within NTS (Miquel et al., 2002). Manipulation of extracellular and/or intracellular calcium concentration altered NTS synaptic responses to PBG consistent with alterations in calcium entry. Nodose afferents likely express heteromeric 5-HT3A/5-HT3B receptor assemblies (Mazzone and Undem, 2016; Morales and Wang, 2002) that that are highly calcium permeability (Barnes et al., 2009). Together with our results, the evidence supports a ST afferent presynaptic localization of 5-HT3Rs within the NTS region.
At the ST-NTS synapse, a single calcium source can trigger multiple forms of glutamate release. High frequencies of ST shocks activate CaVs that rapidly deplete the synchronous vesicle pool while simultaneously enhancing the release rate of asynchronous vesicles. This simultaneous and yet opposite effect on the probability of release triggered by CaV activation suggests two separate, differently regulated vesicle pools (Peters et al., 2010). Consistent with separate regulation, calcium chelation preferentially dampened asynchronous release while only modestly reducing synchronous release (Fawley et al., 2016). Presently, we found that EGTAAM only partially attenuated PBG-mediated increases in sEPSCs. This mixed susceptibility is consistent with vesicles situated in an immediate nanodomain of 5-HT3Rs and a population of vesicles with greater diffusional distances within a microdomain that are susceptible to chelation (Figure 11). We propose that calcium from both CaVs and 5-HT3Rs similarly access vesicles distributed within different micro- and nano-domains that do not overlap with those of the other channel.
Within ST-NTS transmission, different calcium sources mediate separate forms of glutamate release. Basal spontaneous release strongly depends on TRPV1 expression and temperature in most NTS neurons (Peters et al., 2010; Shoudai et al., 2010). While cooling or heating brain slices reduces or increases sEPSCs (respectively) from TRPV1+ afferents, these maneuvers do not alter ST-EPSC amplitude or asynchronous release – forms of release mediated by CaVs (Fawley et al., 2015). We propose that this independence in vesicle release regulation imbues the NTS with the framework necessary for differential signaling. One example of such differential synaptic modulation is the selective targeting of CaV function by the GPCR, cannabinoid 1 receptor (CB1R). CB1R activation reduced evoked ST-EPSC amplitudes without altering TRPV1-mediated vesicle release (Fawley et al., 2014). Similarly, 5-HT3R activation selectively targeted spontaneous release but had no effect on CaV-mediated release. Our studies suggest that other receptors and their modulatory mechanisms have the ability to target one or more modes of transmitter release (Andresen et al., 2013).
5-HT3Rs targeted conduction of the ST-EPSC independently from the distinct processes of vesicle release from the terminal. Sustained axonal depolarization via 5-HT3Rs should block conduction of the action potential into the synaptic terminal. The speculative reasoning that conduction failure is responsible includes the abrupt all-or-none failure of release. If terminal depolarization was responsible, then CaV inactivation would produce a graded reduction in evoked glutamate release – and this in not observed (Figure 11). In fact, other similar forms of conduction failure are reported in ST-NTS transmission including the local anesthetic QX-314 (Hofmann et al., 2014) and vasopressin-induced failures (Bailey et al., 2006). Latency changes occurred in the absence of sEPSC effects in some neurons and vice versa demonstrating the independence and complete segregation of the two actions. Such physical separation is consistent with structural evidence that 5-HT3R receptors are located on both axons and terminals within the NTS (Huang et al., 2004; Merahi et al., 1992; Miquel et al., 2002). However, such structural studies cannot identify the functional consequences of receptor activation on synaptic transmission nor the co-expression on individual ST afferents – features that our electrophysiological studies have detailed. Such discrete expression raises the possibility that the same receptor class can selectively target separate aspects of the neurotransmission process. While it is possible that serotonin separately modulated each function (conduction vs. terminal release), no such observations exist presently. Delays in ST-EPSC latency and failures to evoke glutamate release occurred similarly from TRPV1+ and TRPV1- afferents, despite the differences in vesicle release structures at their terminals (Fawley et al., 2016; Mendelowitz et al., 1995). Our results suggest comparable distribution of the receptor between A-/C-fiber afferent types that produce similar effects.
In brainstem-associated pathologies, deficiencies in 5-HT are thought to contribute to both sudden infant death syndrome (SIDS) and sudden unexpected death in epilepsy (SUDEP). Both conditions are associated with fatal cardiorespiratory events (Duncan et al., 2010; Feng and Faingold, 2017). The NTS integrates homeostatic and autonomic functions and 5-HT3R activation in the NTS broadly attenuates reflex cardiorespiratory responses to peripheral stimuli (Donnelly et al., 2016; Leal et al., 2001; Sevoz et al., 1997; Sévoz et al., 1996). Serotonin in the NTS originates from the raphe pallidus (Thor and Helke, 1987) and functional studies in intact animals suggests that raphe stimulation modulates afferent activated respiratory reflexes via 5-HT release within the NTS (Donnelly et al., 2017). Recent evidence suggests that vagal stimulation also triggers 5-HT release within the NTS (Hosford et al., 2015). 5-HT3Rs in the NTS may thus play an important role in acute fatal episodes in disease states.
This present work establishes functional evidence of multiple micro and nanodomains centered on calcium entry points that operate independently to shape unique synaptic transmission characteristics at NTS synapses. While the exact nature of these mechanisms remain to be resolved molecularly (Chanaday and Kavalali, 2018), the complex landscape of ST afferent terminals encompasses a repertoire of differential control of multiple vesicle pools by distinct neuromodulatory inputs. Our studies reveal that afferent synaptic transmission engages a highly heterogeneous mix of calcium entry mechanisms organized within both micro- and nanodomains (Figure 11). These highly localized spheres of calcium influence associated vesicles without affecting others within the same terminal. CaVs, TRPV1 and 5-HT3R generate unique calcium influxes for which diffusion distances and separate subsets of glutamate vesicles shape functional release characteristics.
4. Experimental Procedures
4.1. Ethical statements
The Institutional Animal Care and Use Committee at Oregon Health and Science University approved all animal procedures and they conform to the guidelines of the National Institutes of Health publication “Guide for the Care and Use of Laboratory Animals”.
4.2. Experimental animals
Male Sprague-Dawley rats (100–300 g, Charles Rivers Laboratory) were housed under a 12h/12h light/dark cycle.
4.3. Brain slice preparation
Under deep anesthesia (5% isoflurane), hindbrains were removed, tilted and cut with a vibrating microtome (Leica VT-1000S, Leica Microsystems Inc.) and sapphire blade (Delaware Diamond Knives) so that 250–300 μm thick horizontal slice contained a 1–3 mm segment of the ST in the same plane as the caudal NTS neurons as previously described (Doyle and Andresen, 2001). Slices were submerged in a perfusion chamber and continuously perfused (1.5 – 2 ml/min) with artificial cerebrospinal fluid (ACSF; pH 7.4, 300 mOsm) composed of (mM): 125 NaCl, 3 KCl, 1.2 KH2PO4, 1.2 MgSO4, 25 NaHCO3, 10 glucose, and 2 CaCl2 bubbled with 95% O2/ 5% CO2. In select experiments, 2 CaCl2 was replaced with 1 CaCl2 and 1 MgCl2. ACSF was held at 32°C within 1° C using an in-line heating system (TC2BIP with a HPRE2 preheater and TH-10Km bath probe, Cell MicroControls) and bath temperature was continuously measured immediately downstream to the slice.
4.4. Voltage clamp recordings
Patch electrodes (2–3.5 MΩ) were pulled from borosilicate glass and filled with an intracellular solution composed of (mM): 6 NaCl, 4 NaOH,130 K-Gluconate, 11 EGTA, 2 CaCl2, 2 MgCl2, 10 HEPES; 2 Na2 ATP, 0.2 Na2 GTP; pH adjusted to 7.3 – 7.32. Neurons were visualized using infrared differential interference contrast optics (Zeiss Axioskop2) and selected for recording within the medial NTS (250 μm rostral of obex and medial to the ST). Neurons were voltage clamped to −60 mV (Multiclamp 700B) and currents were sampled at 20 kHz and digitally filtered at 10 kHz with pClamp 9.2 software (Axon Instruments, Union City, CA). Gabazine (SR-95531, 3 μM, R&D Systems) was added to all ACSF to block GABAA synaptic currents. To classify ST inputs, the potent TRPV1 selective agonist, resiniferatoxin (RTX, 2nM, R&D Systems) was superfused at the end of each experiment (Doyle et al., 2002). All other drugs were applied as indicated: 5-HT3R specific agonist, m-chlorophenylbiguanide HCl (PBG, 1 or 10 μM, Sigma Aldrich); 5-HT3R specific antagonist Ondansetron HCl (OND, 0.5 μM R&D Systems); cell-permeable calcium chelator EGTA-AM (10 μM, Molecular Probes).
4.5. ST-evoked synchronous EPSCs
A concentric bipolar stimulating electrode (200 μm outer tip diameter; Frederick Haer Co., Bowdoinham, ME) was placed on the ST >1 mm from the recorded neuron and minimal current shocks were delivered using a Master-8 or Master-9 stimulator (A.M.P.I., Jerusalem, Israel). Stimulus shock intensity was increased until a fixed latency EPSC was evoked. Latency was measured as the time from the stimulus shock artifact to the onset of the first EPSC and was averaged across at least 20 ST shocks. The standard deviation (jitter) of this latency is calculated to determine monosynaptic inputs with jitter values < 200 μs (Doyle and Andresen, 2001). The stimulus intensity was adjusted to the lowest intensity that evoked a single EPSC with an abrupt, all-or-none recruitment intensity profile that remained constant through the control period of the recording (Bailey et al., 2008).
4.6. Experimental Design and Statistical Analysis
Each N reported is data collected from a single neuron from a single animal. We used a single, consolidated ST stimulus protocol to maximize experimental efficiency and assess multiple forms of release near simultaneously. This protocol measured multiple modes of glutamate release within distinct time periods of ST activation interspersed with periods of no stimulation (Peters et al., 2010). Basal release was measured as the rate of sEPSCs that occur in the 1 sec preceding each ST activation period. ST activation consisted of five constant current shocks (50 Hz, 100 μs duration) that evoked synchronous EPSCs. This evoked release was measured as the amplitude of the first EPSC (ST-EPSC) in each train. Spontaneous EPSCs occurring in the 1 sec following the last ST-shock (post-synchronous time period) were counted and the asynchronous rate was calculated by subtracting the basal rate from the post-synchronous rate to yield the net asynchronous response (Δ Hz increment above the basal rate). The remaining 4 s following stimulation was sufficient for the sEPSC frequency to return to basal levels. We thus measured the basal, synchronous and asynchronous forms of release repeatedly over time (see Figure 1D). For the statistical comparisons of treatments, we used measurements across 20 successive, 6 s trials (2 min) immediately preceding drug application (control) and during the last 2 min of a 10 min drug exposure. The sampling was extended to 50 trials (5 min) for neurons with low spontaneous EPSC rates (i.e. TRPV1- afferents). Each neuron served as its own control (repeated measures design). Individual neurons were considered responsive to PBG only if statistically significant changes occurred for either sEPSC rates and/or latency. Only results for individually responsive neurons (e.g. 5-HT3R+) were included in aggregate group summaries. The sEPSCs were collected into 100 ms bins using MiniAnalysis (Synaptosoft Inc., Decatur, GA).
ST-EPSC amplitudes and latencies were measured using Clampfit (Axon Instruments). A minimum of 3 successful ST-EPSCs in the last 2 min (20 trials) of the drug exposure was required for ST-EPSC amplitude and latency determinations, and for asynchronous measures from individual neurons to be included in group data. An additional requirement for accurate asynchronous measures was for basal frequency to be ˂100 Hz in PBG because distinguishing individual events exceeding this frequency becomes unreliable. Synaptic failures (zero amplitude) were not included in the averages of amplitude or latency. To assess the onset timing of the drug-induced changes, data (sEPSC rates and/or latencies) were collected into 1 min bins. Time “0” marked the start of the PBG exposure and elevated values were extrapolated back to the intersection with the control, pre-drug values to mark the onset time.
Data were statistically analyzed with either MiniAnalysis or SigmaStat 3.5 (Systat Software) and plotted with Origin (OriginLab, Northampton, Massachusetts). Throughout, p < 0.05 was considered statistically significant and all data are expressed as mean ± SEM. Tests assessed normal distributions and then appropriate parametric or nonparametric tests were conducted including Kolmogorov–Smirnov (KS) tests of inter-event intervals and sEPSC amplitudes, t tests (two group comparisons) or one/two-way repeated-measures (RM) ANOVA with post hoc comparisons for more than two groups. The statistical test and calculated p values for each data set are indicated in the text and figure legends.
Highlights.
5-HT3R activation increased sEPSCs.
5-HT3R activation did not alter voltage-activated calcium channel-mediated glutamate release.
5-HT3R activation delayed latencies of evoked synchronous events, often blocking transmission.
EGTA-AM attenuated 5-HT3R responses consistent with vesicles in both micro- and nanodomains.
5-HT3R-sourced calcium is isolated from CaV calcium domains.
Acknowledgements:
This work was supported by grants from the National Institutes of Health, HL-105703 and HL-133505 (MCA). The content is solely the responsibility of the authors and does not necessarily represent the official views of the National Heart, Lung and Blood Institute or the NIH.
Abbreviations
- 5-HT3R
serotonin 3 receptor
- CaVs
voltage-dependent calcium channels
- TRPV1
transient receptor potential vanilloid type 1 receptor
- NTS
nucleus of the solitary tract
- PBG
mchlorophenyl biguanide hydrochloride
Footnotes
Publisher's Disclaimer: This is a PDF file of an unedited manuscript that has been accepted for publication. As a service to our customers we are providing this early version of the manuscript. The manuscript will undergo copyediting, typesetting, and review of the resulting proof before it is published in its final citable form. Please note that during the production process errors may be discovered which could affect the content, and all legal disclaimers that apply to the journal pertain.
Conflicts of Interest: None.
References
- Andresen MC, Bailey TW, Jin Y-H, McDougall SJ, Peters JH, Aicher SA, 2007. Cellular heterogeneity within the solitary tract nucleus and visceral afferent processing – electrophysiological approaches to discerning pathway performance. Tzu Chi Medical Journal. 19, 181–185. [Google Scholar]
- Andresen MC, Paton JF, 2011. The nucleus of the solitary tract: Processing information from viscerosensory afferents. In Central Regulation of Autonomic Functions. Vol., Llewellyn-Smith IJ, Verberne AJ, ed.êds. Oxford, London, pp. 23–46. [Google Scholar]
- Andresen MC, Hofmann ME, Fawley JA, 2012. Invited Review: The un-silent majority - TRPV1 drives “spontaneous” transmission of unmyelinated primary afferents within cardiorespiratory NTS. Am J Physiol Regul Integr Comp Physiol. 303, R1207–R1216. [DOI] [PMC free article] [PubMed] [Google Scholar]
- Andresen MC, Fawley JA, Hofmann ME, 2013. Peptide and lipid modulation of glutamatergic afferent synaptic transmission in the solitary tract nucleus. Frontiers in Neuroscience. 6, 191. [DOI] [PMC free article] [PubMed] [Google Scholar]
- Atlas D, 2013. The voltage-gated calcium channel functions as the molecular switch of synaptic transmission. Annual Review of Biochemistry. 82, 607–635. [DOI] [PubMed] [Google Scholar]
- Bailey TW, Jin Y-H, Doyle MW, Smith SM, Andresen MC, 2006. Vasopressin inhibits glutamate release via two distinct modes in the brainstem. J Neurosci. 26, 6131–6142. [DOI] [PMC free article] [PubMed] [Google Scholar]
- Bailey TW, Appleyard SM, Jin YH, Andresen MC, 2008. Organization and properties of GABAergic neurons in solitary tract nucleus (NTS). J Neurophysiol. 99, 1712–1722. [DOI] [PubMed] [Google Scholar]
- Barnes NM, Hales TG, Lummis SC, Peters JA, 2009. The 5-HT3 receptor--the relationship between structure and function. Neuropharmacology. 56, 273–84. [DOI] [PMC free article] [PubMed] [Google Scholar]
- Biederer T, Kaeser PS, Blanpied TA, 2017. Transcellular Nanoalignment of Synaptic Function. Neuron. 96, 680–696. [DOI] [PMC free article] [PubMed] [Google Scholar]
- Browning KN, 2015. Role of central vagal 5-HT receptors in gastrointestinal physiology and pathophysiology. Front Neurosci. 9, 413. [DOI] [PMC free article] [PubMed] [Google Scholar]
- Chanaday NL, Kavalali ET, 2018. Presynaptic origins of distinct modes of neurotransmitter release. Curr Opin Neurobiol. 51, 119–126. [DOI] [PMC free article] [PubMed] [Google Scholar]
- Coleridge HM, Coleridge JCG, Dangel A, Kidd C, Luck J, Sleight P, 1973. Impulses in slowly conducting vagal fibers from afferent endings in the veins, atria, and arteries of dogs and cats. Circ.Res 33, 87–97. [DOI] [PubMed] [Google Scholar]
- Cui RJ, Roberts BL, Zhao H, Zhu M, Appleyard SM, 2012. Serotonin activates catecholamine neurons in the solitary tract nucleus by increasing spontaneous glutamate inputs. The Journal of Neuroscience. 32, 16530–16538. [DOI] [PMC free article] [PubMed] [Google Scholar]
- Donnelly WT, Bartlett D Jr., Leiter JC, 2016. Serotonin in the solitary tract nucleus shortens the laryngeal chemoreflex in anaesthetized neonatal rats. Experimental physiology. 101, 946–61. [DOI] [PMC free article] [PubMed] [Google Scholar]
- Donnelly WT, Xia L, Bartlett D, Leiter JC, 2017. Activation of serotonergic neurons in the medullary caudal raphe shortens the laryngeal chemoreflex in anaesthetized neonatal rats. Exp Physiol. 102, 1007–1018. [DOI] [PubMed] [Google Scholar]
- Doyle MW, Andresen MC, 2001. Reliability of monosynaptic transmission in brain stem neurons in vitro. J Neurophysiol. 85, 2213–2223. [DOI] [PubMed] [Google Scholar]
- Doyle MW, Bailey TW, Jin Y-H, Andresen MC, 2002. Vanilloid receptors presynaptically modulate visceral afferent synaptic transmission in nucleus tractus solitarius. J Neurosci. 22, 8222–8229. [DOI] [PMC free article] [PubMed] [Google Scholar]
- Duncan JR, Paterson DS, Hoffman JM, Mokler DJ, Borenstein NS, Belliveau RA, Krous HF, Haas EA, Stanley C, Nattie EE, Trachtenberg FL, Kinney HC, 2010. Brainstem serotonergic deficiency in sudden infant death syndrome. JAMA. 303, 430–437. [DOI] [PMC free article] [PubMed] [Google Scholar]
- Dutta A, Deshpande SB, 2010. Cardio-respiratory reflexes evoked by phenylbiguanide in rats involve vagal afferents which are not sensitive to capsaicin. Acta Physiol (Oxf). 200, 87–95. [DOI] [PubMed] [Google Scholar]
- Fawley JA, Hofmann ME, Andresen MC, 2014. Cannabinoid 1 and Transient Receptor Potential Vanilloid 1 receptors discretely modulate evoked glutamate separately from spontaneous glutamate transmission. . J Neurosci. 34, 8324–8332. [DOI] [PMC free article] [PubMed] [Google Scholar]
- Fawley JA, Hofmann ME, Largent-Milnes TM, Andresen MC, 2015. Temperature differentially facilitates spontaneous but not evoked glutamate release from cranial visceral primary afferents. PloS One. 10, e0127764. [DOI] [PMC free article] [PubMed] [Google Scholar]
- Fawley JA, Hofmann ME, Andresen MC, 2016. Distinct calcium sources support multiple modes of synaptic release from cranial sensory afferents. Journal of Neuroscience. 36, 8957–8966. [DOI] [PMC free article] [PubMed] [Google Scholar]
- Feng HJ, Faingold CL, 2017. Abnormalities of serotonergic neurotransmission in animal models of SUDEP. Epilepsy Behav. 71, 174–180. [DOI] [PMC free article] [PubMed] [Google Scholar]
- Hayes MR, Covasa M, 2006. Dorsal hindbrain 5-HT3 receptors participate in control of meal size and mediate CCK-induced satiation. Brain Res. 1103, 99–107. [DOI] [PubMed] [Google Scholar]
- Hofmann ME, Largent-Milnes TM, Fawley JA, Andresen MC, 2014. External QX-314 inhibits evoked cranial primary afferent synaptic transmission independent of TRPV1. J Neurophysiol. 112, 2697–706. [DOI] [PMC free article] [PubMed] [Google Scholar]
- Hosford PS, Mifflin SW, Ramage AG, 2014. 5-hydroxytryptamine-mediated neurotransmission modulates spontaneous and vagal-evoked glutamate release in the nucleus of the solitary tract effect of uptake blockade. J Pharmacol Exp Ther. 349, 288–96. [DOI] [PubMed] [Google Scholar]
- Hosford PS, Millar J, Ramage AG, 2015. Cardiovascular afferents cause the release of 5-HT in the nucleus tractus solitarii; this release is regulated by the low- (PMAT) not the high-affinity transporter (SERT). J Physiol. 5937, 1715–1729. [DOI] [PMC free article] [PubMed] [Google Scholar]
- Huang J, Spier AD, Pickel VM, 2004. 5-HT3A receptor subunits in the rat medial nucleus of the solitary tract: subcellular distribution and relation to the serotonin transporter. Brain Res. 1028, 156–169. [DOI] [PubMed] [Google Scholar]
- Jeggo RD, Kellett DO, Wang Y, Ramage AG, Jordan D, 2005. The role of central 5-HT3 receptors in vagal reflex inputs to neurones in the nucleus tractus solitarius of anaesthetized rats. Journal of Physiology. 566, 939–953. [DOI] [PMC free article] [PubMed] [Google Scholar]
- Jin Y-H, Bailey TW, Li BY, Schild JH, Andresen MC, 2004. Purinergic and vanilloid receptor activation releases glutamate from separate cranial afferent terminals. J Neurosci. 24, 4709–4717. [DOI] [PMC free article] [PubMed] [Google Scholar]
- Julius D, Basbaum AI, 2001. Molecular mechanisms of nociception. Nature. 413, 203–210. [DOI] [PubMed] [Google Scholar]
- Kaeser PS, Regehr WG, 2014. Molecular mechanisms for synchronous, asynchronous, and spontaneous neurotransmitter release. Annu Rev Physiol. 76, 333–363. [DOI] [PMC free article] [PubMed] [Google Scholar]
- Leal DM, Callera JC, Bonagamba LG, Nosjean A, Laguzzi R, Machado BH, 2001. Microinjection of a 5-HT(3) receptor agonist into the NTS of awake rats inhibits the bradycardic response to activation of the von Bezold-Jarisch reflex. Brain Res Bull. 54, 7–11. [DOI] [PubMed] [Google Scholar]
- Mazzone SB, Undem BJ, 2016. Vagal afferent innervation of the airways in health and disease. Physiol Rev. 96, 975–1024. [DOI] [PMC free article] [PubMed] [Google Scholar]
- Mendelowitz D, Yang M, Reynolds PJ, Andresen MC, 1995. Heterogeneous functional expression of calcium channels at sensory and synaptic regions in nodose neurons. J Neurophysiol. 73, 872–875. [DOI] [PubMed] [Google Scholar]
- Merahi N, Orer HS, Laporte A-M, Gozlan H, Hamon M, Laguzzi R, 1992. Baroreceptor reflex inhibition induced by the stimulation of serotonin3 receptors in the nucleus tractus solitarius of the rat. Neuroscience. 46, 91–100. [DOI] [PubMed] [Google Scholar]
- Merahi N, Laguzzi R, 1995. Cardiovascular effects of 5HT2 and 5HT3 receptor stimulation in the nucleus tractus solitarius of spontaneously hypertensive rats. Brain Res. 669, 130–134. [DOI] [PubMed] [Google Scholar]
- Miquel MC, Emerit MB, Nosjean A, Simon A, Rumajogee P, Brisorgueil MJ, Doucet E, Hamon M, Verge D, 2002. Differential subcellular localization of the 5-HT3-As receptor subunit in the rat central nervous system. Eur.J.Neurosci 15, 449–457. [DOI] [PubMed] [Google Scholar]
- Morales M, Wang SD, 2002. Differential composition of 5-hydroxytryptamine3 receptors synthesized in the rat CNS and peripheral nervous system. Journal of Neuroscience. 22, 6732–6741. [DOI] [PMC free article] [PubMed] [Google Scholar]
- Oheim M, Kirchhoff F, Stuhmer W, 2006. Calcium microdomains in regulated exocytosis. Cell Calcium. 40, 423–39. [DOI] [PubMed] [Google Scholar]
- Palkovits M, 1985. Distribution of neuroactive substances in the dorsal vagal complex of the medulla oblongata. Neurochem.Int 7, 213–219. [DOI] [PubMed] [Google Scholar]
- Peters JH, McDougall SJ, Kellett DO, Jordan D, Llewellyn-Smith IJ, Andresen MC, 2008. Oxytocin enhances cranial visceral afferent synaptic transmission to the solitary tract nucleus. J Neurosci. 28, 11731–11740. [DOI] [PMC free article] [PubMed] [Google Scholar]
- Peters JH, McDougall SJ, Fawley JA, Smith SM, Andresen MC, 2010. Primary afferent activation of thermosensitive TRPV1 triggers asynchronous glutamate release at central neurons. Neuron. 65, 657–669. [DOI] [PMC free article] [PubMed] [Google Scholar]
- Pratt GD, Bowery NG, 1989. The 5-HT3 receptor ligand, [3H]BRL 43694, binds to presynaptic sites in the nucleus tractus solitarius of the rat. Neuropharmacology. 28, 1367–1376. [DOI] [PubMed] [Google Scholar]
- Ronde P, Nichols RA, 1998. High calcium permeability of serotonin 5-HT3 receptors on presynaptic nerve terminals from rat striatum. J Neurochem. 70, 1094–103. [DOI] [PubMed] [Google Scholar]
- Schild JH, Kunze DL, 2012. Differential distribution of voltage-gated channels in myelinated and unmyelinated baroreceptor afferents. Autonomic Neuroscience. 172, 4–12. [DOI] [PubMed] [Google Scholar]
- Sevoz C, Callera JC, Machado BH, Hamon M, Laguzzi R, 1997. Role of serotonin3 receptors in the nucleus tractus solitarii on the carotid chemoreflex. Am J Physiol. 272, H1250–9. [DOI] [PubMed] [Google Scholar]
- Sévoz C, Nosjean A, Callera JC, Machado B, Hamon M, Laguzzi R, 1996. Stimulation of 5-HT3 receptors in the NTS inhibits the cardiac Bezold-Jarisch reflex response. American Journal of Physiology. 271, H80–H87. [DOI] [PubMed] [Google Scholar]
- Shoudai K, Peters JH, McDougall SJ, Fawley JA, Andresen MC, 2010. Thermally active TRPV1 tonically drives central spontaneous glutamate release. J Neurosci. 30, 14470–14475. [DOI] [PMC free article] [PubMed] [Google Scholar]
- Stanley EF, 2016. The nanophysiology of fast transmitter release. Trends Neurosci. 39, 183–197. [DOI] [PubMed] [Google Scholar]
- Thompson AJ, 2013. Recent developments in 5-HT3 receptor pharmacology. Trends in Pharmacological Sciences. 34, 100–109. [DOI] [PubMed] [Google Scholar]
- Thor KB, Helke CJ, 1987. Serotonin and substance P-containing projections to the nucleus tractus solitarii of the rat. J.Comp.Neurol 265, 275–293. [DOI] [PubMed] [Google Scholar]
- Van Giersbergen PLM, Palkovits M, De Jong W, 1992. Involvement of neurotransmitters in the nucleus tractus solitarii in cardiovascular regulation. Physiol.Rev 72, 789–824. [DOI] [PubMed] [Google Scholar]
- Wang Y, Ramage AG, Jordan D, 1997. In vivo effects of 5-hydroxytryptamine receptor activation on rat nucleus tractus solitarius neurones excited by vagal C-fibre afferents. Neuropharmacology. 36, 489–498. [DOI] [PubMed] [Google Scholar]
- Yu S, Ru F, Ouyang A, Kollarik M, 2008. 5-Hydroxytryptamine selectively activates the vagal nodose C-fibre subtype in the guinea-pig oesophagus. Neurogastroenterol Motil. 20, 1042–50. [DOI] [PubMed] [Google Scholar]


