

Abstract
Development of chemoresistance remains a major challenge in treating esophageal squamous cell carcinoma (ESCC) patients despite treatment advances. However, the role of RAC1 in chemoresistance of ESCC and the underlying mechanisms remain largely unknown. In this study, we found that higher levels of RAC1 expression were associated with poorer prognosis in ESCC patients. Enhanced RAC1 expression increased cell proliferation, migration, and chemoresistance in vitro. Combination therapy using RAC1 inhibitor EHop‐016 and cisplatin significantly promoted cell viability inhibition, G2/M phase cycle arrest, and apoptosis when compared to each monotherapy. Mechanistically, glycolysis was significantly downregulated in the RAC1 inhibitor monotherapy group and the combination group via inhibiting AKT/FOXO3a signaling when compared to the control group. Moreover, the silencing of RAC1 inhibited AKT/FOXO3a signaling and cell glycolysis while the upregulation of RAC1 produced an opposite effect. In murine xenograft models, the tumor volume and the expression of glycolytic enzymes were significantly reduced in combination therapy when compared to each monotherapy group. Overall, our study demonstrates that targeting RAC1 with an inhibitor overcomes cisplatin resistance in ESCC by suppressing glycolytic enzymes, which provides a promising strategy for treatment of ESCC in clinical practice.
Keywords: chemoresistance, cisplatin, esophageal squamous cell carcinoma, glycolysis, RAC1
Abbreviations
- ALDOA
aldolase A
- CI
confidence interval
- DDP
cisplatin
- DFS
disease‐free survival
- EdU
5‐ethynyl‐2′‐deoxyuridine
- EHOP
EHop‐016
- ESCC
esophageal squamous cell carcinoma
- GEF
guanine nucleotide exchange factor
- GO
gene ontology
- H&E
hematoxylin and eosin
- HK1
hexokinase 1
- IHC
immunohistochemistry
- LDHA
lactate dehydrogenase A
- mTOR
mammalian target of rapamycin
- OS
overall survival
- PI
propidium iodide
- PKM
pyruvate kinase
- qRT‐PCR
quantitative reverse transcription polymerase chain reaction
- RAC1
Rac family small GTPase 1
- RNA‐seq
RNA sequencing
1. Introduction
Esophageal cancer is the eighth most common cancer worldwide (Jemal et al., 2011; Sakai et al., 2013). Esophageal squamous cell carcinoma (ESCC), a malignancy of esophageal epithelial cells, accounts for about 90% of esophageal cancer cases over the world (Abnet et al., 2017; Song et al., 2017).
In clinical practice, surgery remains the gold standard for esophageal cancer treatment (Allum et al., 2014). However, prognosis of esophageal cancer patients is poor with a 5‐year survival rate of around 25% among patients undergoing surgery alone because most of the patients are only symptomatic in the advanced stage (Allum et al., 2014; D’Amico, 2007). In addition, approximately half of the patients who undergo esophageal resection will develop systemic or local recurrences (Wang et al., 2014). As a result, chemotherapy is used in combination with traditional surgery to optimize therapeutic outcomes. Cisplatin is a widely used chemotherapeutic agent for esophageal cancer (Yu et al., 2014). When combining surgery with neoadjuvant chemotherapy using cisplatin, the 5‐year survival rate of patients can be significantly raised (D’Amico, 2007). However, great variations are seen in the drug resistance of different esophageal cancer patients, and certain patients are prone to develop chemoresistance toward cisplatin and other chemotherapeutic drugs (Alfarouk et al., 2015; Kihara et al., 2001; Schilsky, 2010). The resistance that ensues in esophageal cancer patients will lead to treatment failure and death (Alfarouk et al., 2015; Takashima et al., 2008; Zhu et al., 2013), which remains a major challenge in treating esophageal cancer patients. Consequently, reversing chemoresistance and enhancing therapeutic efficacy are of great importance in terms of esophageal cancer treatments.
RAC1, as a member of RHO family GTPase, can be activated by guanine nucleotide exchange factors (GEFs) to a GTP‐bound state or be inactivated by GTPase‐activating proteins to a GDP‐bound state (Cardama et al., 2017; Um et al., 2014). In its GTP‐bound state, RAC1 activates a broad spectrum of downstream pathways and is important in modulating various cellular processes, including metastasis, migration, invasion, and cytoskeletal reorganization (Kamai et al., 2010; Myant et al., 2013; Wang et al., 2015). According to the Genotype‐Tissue Expression (GTEx) database, the expression level of RAC1 is the highest in the esophagus among all human organs (Pontén et al., 2011). RAC1 was also described to regulate chemotherapeutic sensitivity. For example, in lung cancer, silencing of RAC1 is related to an increase in chemosensitivity (Chen et al., 2011). However, in epidermoid carcinoma and liver carcinoma cells, downregulation of RAC1 results in an increase in cisplatin resistance (Shen et al., 2004). These contradictory findings draw our attention to this field. To date, the role of RAC1 in chemoresistance of ESCC remains unclear, and the mechanisms by which RAC1 regulates chemoresistance are largely unknown.
Therefore, we explored the relationship between RAC1 and the prognosis of ESCC patients and further investigated the role of RAC1 in ESCC development and chemoresistance. Additionally, we examined the effectiveness and the associated mechanisms of combination therapy of cisplatin and RAC1 inhibitor for ESCC.
2. Materials and methods
2.1. Patients and samples
One hundred and six human ESCC tumor samples (mean age: 58.0 years; 79 males and 27 females) were obtained from Shantou Central Hospital between October 2007 and July 2009, with approval for experiments from the Ethics Committee of Shantou University Medical College. The patients without local or systemic treatment before surgery were eligible for this study. The data of patient characteristics and histological examinations were obtained from medical reports and/or confirmed by two independent pathologists. Follow‐up by routine visits was performed, and the information was reviewed from outpatient records. Written informed consent was obtained from all patients, and the study methodologies conformed to the standards set by the Declaration of Helsinki. Table S1 demonstrates the clinical information of the patients in detail.
2.2. Immunohistochemistry
Immunohistochemistry (IHC) was performed on human specimens and xenograft mouse tumors as described previously (Li et al., 2015b) using anti‐RAC1 (1 : 200 dilution; Abcam, Cambridge, UK), anti‐Ki67 (ZM0166, ready‐to‐use; ZSGB‐BIO, Beijing, China), anti‐PKM (1 : 200 dilution; Santa Cruz Biotechnology, Santa Cruz, CA, USA), anti‐LDHA (1 : 200 dilution; Santa Cruz Biotechnology, Santa Cruz, CA, USA), and anti‐HK1 (1 : 200 dilution; Santa Cruz Biotechnology, Santa Cruz, CA, USA) antibodies according to the manufacturers’ instructions.
2.3. Cell lines and reagents
Three ESCC cell lines, namely KYSE150, KYSE510, and TE5, were used in our study. The culture of these cell lines was described in our study before (Jiang et al., 2018; Zou et al., 2016). The cells were maintained at 37 °C under a humidified atmosphere of 5% CO2 and 95% air.
Cisplatin and EHop‐016, which were purchased from Selleck Chemicals (Houston, TX, USA) and MedChem Express (Monmouth Junction, NJ, USA), were dissolved in dimethylformamide and dimethylsulfoxide for storage, respectively.
2.4. Transfection of siRNAs and plasmids
Three RAC1 siRNAs (siRAC1‐1, siRAC1‐2, and siRAC1‐3) and three FOXO3a siRNAs (siFOXO3a‐1, siFOXO3a‐2, and siFOXO3a‐3) were purchased from GenePharma (Shanghai, China). Subsequently, siRAC1‐3 (RAC1 target sequence: 5′‐CUAAGGAGAUUGGUGCUGUTT‐3′) and siFOXO3a‐2 (FOXO3a target sequence: 5′‐CGUGAUGCUUCGCAAUGAUTT‐3′) were selected for experiment due to their best silencing effect. HiPerFect Transfection Reagent (QIAGEN, Valencia, CA, USA) was used for siRNA transfections with the manufacturer’s protocols.
Total RNA was isolated from the KYSE150 cell line by TRIzol reagent (Invitrogen, Carlsbad, CA, USA), and cDNA was synthesized using a Reverse Transcription System (TaKaRa, Otsu, Japan). Full‐length human RAC1 cDNAs (lacking the TAA stop condon and containing EcoRI and XhoI restriction sites) were amplified using a forward primer (5'‐TCACCTATCCGCAGGGTCTA‐3') and a reverse primer (5'‐TCGCTTCGTCAAACACTGTC‐3'). After purification of the PCR products, the EcoRI/XhoI fragment of RAC1 was subcloned into pcDNA3.1 vector (Invitrogen), with a FLAG epitope tag at the N terminus. Sequencing was used to validate the recombinant plasmids. The cells were transfected using Lipofectamine 3000 (Invitrogen) following the manufacturer's instructions.
2.5. Western blotting
Protein extraction and western blot were performed as described previously (Li et al., 2015b). Anti‐RAC1 (1 : 250 dilution) antibody was acquired from Cytoskeleton, Inc. (Denver, CO, USA). Anti‐PKM (1 : 500 dilution), anti‐LDHA (1 : 500 dilution), anti‐ALDOA (1 : 500 dilution), and anti‐HK1 (1 : 500 dilution) antibodies were obtained from Santa Cruz Biotechnology. Anti‐phospho‐AKT (Ser473) (1 : 1000 dilution), anti‐AKT (1 : 1000 dilution), anti‐phospho‐FoxO1 (Thr24)/FoxO3a (Thr32) (1 : 1000 dilution), anti‐FOXO3A (75D8) (1 : 1000 dilution), anti‐phospho‐S6 (Ser240/244) (1 : 1000 dilution), and anti‐S6 (5G10) (1 : 1000 dilution) antibodies were purchased from Cell Signaling Technology (Danvers, MA, USA).
2.6. Cell viability assay
For examination of cell proliferation ability, the assays were conducted as described before (Li et al., 2015a). Briefly, transfected cells were first starved in a serum‐free medium for 12 h and further reseeded into 96‐well plates at an initial density of 7000 cells per well. After 0, 24, and 48 h, cell proliferation assays were performed using CellTiter 96 Aqueous One Solution Cell Proliferation Assay Kit (Promega, Shanghai, China), also known as MTS assay, according to the manufacturer’s instructions. BioTek ELx800 microplate reader (Bio‐Tek Instruments, Winooski, VT, USA) was used to detect the absorbance of each well at 490 nm.
For evaluation of drug sensitivity, an initial density of 10 000 cell per well was adopted to reseed the cells into 96‐well plates (Zhang et al., 2016). The cells were incubated for 24 h until adherence. The medium was replaced by freshly prepared medium containing cisplatin and EHop‐016, which were both added at the indicated concentrations. The cells were cultivated for 24 h and treated with the MTS method. The IC50 and inhibition ratio were calculated using graphpad prism 7 software (Graphpad Prism Software Inc., San Diego, CA, USA).
2.7. EdU (5‐ethynyl‐2′‐deoxyuridine) incorporation assay
Cell proliferation assays were implemented using BeyoClick™ EdU Cell Proliferation Kit with Alexa Fluor 488 (Beyotime Biotechnology, Haimen, China) according to the manufacturer’s instructions. After receiving treatments identical to those in MTS assays, KYSE150 and KYSE510 cells were incubated with 10 µm EdU for 2 h at 37 °C. The cells were then proceeded to the fixation step with 3% paraformaldehyde in PBS and to the permeabilization step with 0.5% Triton X‐100 at room temperature. The fixatives were removed and the cells were washed by 3% BSA in PBS. Subsequently, ESCC cells were incubated and protected from light in Click Additive Solution and stained with DAPI. The fluorescence images of EdU incorporation samples were then obtained under ZEISS Axio Observer A1 (Carl Zeiss, Oberkochen, Germany) and photographed. The cells were further analyzed by calculating the ratio of EdU incorporation cells to the total number of the cells.
2.8. Wound healing assay
Wound healing assays were performed as described in our previous research (Zhang et al., 2008). Transfected cells were incubated in 6‐well plates until full confluence, and cultured using serum‐free medium for 12 h in order to achieve quiescence. The scratches were produced by sterile pipette tips. Cell washing by PBS was performed, and the cells were incubated in the medium supplemented with 2% FBS.
To make sure that the measurements were taken at the same locations, calibrated scale on the IX73 inverted microscope (Olympus, Tokyo, Japan) was used to record the locations. Micrographs of the assigned areas were taken after 0, 24, and 48 h of incubations. The areas of wound healing were analyzed from 6 images, using imagej software (US National Institutes of Health, Bethesda, MD, USA).
2.9. Transwell assay
Cells were treated with serum starvation for 12 h (Li et al., 2017) and further resuspended in serum‐free medium and reseeded onto the Falcon Chambers (BD Biosciences, Franklin Lakes, NJ, USA) with a density of 1 × 10⁵ cells per well. After 48 h, the cells that migrated toward the lower chambers were stained with 0.5% crystal violet. Each assay was photographed for 9 views under the IX73 inverted microscope (Olympus), and the number of cells within each chamber was counted by imagej software.
2.10. RAC1 activity assay
RAC1 activity was evaluated using Rac1 Pull‐down Activation Assay Biochem Kit (Cytoskeleton). In brief, cell lysis buffer was used to lyse the cells under different treatments (at 24 h after treatment with drug or 48 h after RAC1 transfection), and western blot was performed for quantification of total RAC1 using the collected lysates. The mixture of the sample and 20 μg GST‐PAK PBD beads, which bind to the active GTP‐RAC1 form, was rotated at 4 °C for 1 h. Beads were washed by wash buffer and resuspended by loading buffer. Proteins were separated on 10% SDS/PAGE and transferred to PVDF membranes for western blot. The total and activated RAC1 were detected by western blot using an anti‐RAC1 monoclonal antibody as described by the manufacturer.
2.11. Flow cytometry assay
Cell cycle and apoptosis were evaluated by the propidium iodide (PI) staining and the Annexin V–PI double staining assay. Cells were incubated with different drugs for 24 h and washed by ice‐cold PBS twice. After centrifugation, cells were resuspended and stained with PI or Annexin V–PI using the Cell Cycle Detection Kit (Beyotime Biotechnology) or the Annexin V‐FITC/PI Apoptosis Detection kit (Beyotime Biotechnology) according to the manufacturer's protocols. The flow cytometry data for cell cycle and apoptosis were analyzed by the modfit (Verity Software House, Topsham, ME, USA) and flowjo (TreeStar, Ashland, OR, USA) software. The synergistic effect of the combination of cisplatin and EHop‐016 was calculated using the response additivity approach (Foucquier and Guedj, 2015; Slinker, 1998).
2.12. RNA‐sequencing analysis and identification of differentially expressed mRNAs
Total RNA was extracted using the TRIzol (Invitrogen) method 24 h after cells were treated with drugs. Further library construction and Illumina’s HiSeq 2000 technology sequencing were performed by Novogene (Beijing, China). Data were extracted using tophat (v2.0.6; Tophat, Washington, MD, USA), and differentially expressed mRNAs were identified by deseq version 1.14.0 (Anders and Huber, 2010). A fold change cutoff of log2 < −1.5 or > 0.5 and a P‐value cutoff of P < 0.05 were adopted to select differentially expressed and significantly regulated gene sets. Functional enrichment by Gene Ontology (GO) and Kyoto Encyclopedia of Genes and Genomes (KEGG) analysis was performed to infer potential biological processes and pathways of methylation‐associated genes through the david Bioinformatics Tool (version 6.8; Ashburner et al., 2000; Huang et al., 2009). Results with a P‐value < 0.05 were considered as significant functional categories.
2.13. Quantitative reverse transcription polymerase chain reaction
Total RNA was extracted by the TRIzol (Invitrogen) method. The cDNAs were generated from reverse transcription using PrimeScript™ RT‐PCR kit (TaKaRa). Reverse transcription and quantitative reverse transcription polymerase chain reaction (qRT‐PCR) were conducted as described previously (Wu et al., 2013). qRT‐PCR assays were performed on ABI 7500 Real‐Time PCR system with the primers (Table S3) using SYBR Premix Ex Taq (TaKaRa) under the manufacturer's instructions. The relative expression values of RAC1 were calculated by the ΔΔ C t method and normalized to β‐actin in each sample.
2.14. Cellular metabolism assays
Alterations of cellular metabolism about glycolysis were measured using Glucose‐Glo™ Assay, Lactate‐Glo™ Assay, CellTiter‐Glo® Luminescent Cell Viability Assay, and Glucose Uptake‐Glo™ Assay (Promega, Madison, WI, USA).
To detect the effects of RAC1 silencing and overexpression, KYSE150 and KYSE510 cells were seeded in 6‐well plates and transfected with siRAC1, siNC, empty vector, or RAC1 plasmid. After transfection, these cells were transplanted in 96‐well plates. To investigate the effectiveness of EHop‐016 in overcoming cisplatin resistance, ESCC cells were seeded in 96‐well opaque luminescent plates, and then, cisplatin and EHop‐016 were introduced according to the MTS assay. After proper cultivation, the culture medium and the original medium (baseline control) were completely removed and collected. Glucose (Glucose‐Glo™ Assay) and lactate (Lactate‐Glo™ Assay) levels were quantified using the medium according to the manufacturer’s instructions. After removal of the medium, the remaining cells were washed by PBS twice and harvested. Cellular ATP production levels were measured using the firefly luciferase method (CellTiter‐Glo® Luminescent Cell Viability Assay). The bioluminescent glucose uptake assay (Glucose Uptake‐Glo™ Assay) was also conducted using the standard protocol provided by the manufacturer. Luminescence of all of the above metabolism assays was determined by the luminometer (Promega GloMax® 96 Microplate Luminometer). All experiments were performed in triplicate and repeated three times.
2.15. Xenograft studies
This study was approved by the Ethics Committee of Shantou University Medical College, and all mice were treated humanely. Twenty‐eight female nu/nu mice (Vital River Laboratories Animal Technology, Beijing, China) at 6–8 weeks of age were housed in a specific pathogen‐free environment and allowed for adaption to their environment before experiments. For cell inoculation, KYSE150 cells (2 × 10⁶ cells·mL−1) were injected subcutaneously into the armpit of the mice. Drug injection began when the average tumor volume reached 100 mm3. Cisplatin (2 mg·kg−1 body weight; Selleck), EHop‐016 (20 mg·kg−1 body weight; MedChem Express), or combination therapy (cisplatin plus EHop‐016) was administered by intraperitoneal injection every 3 days. Animals were monitored every 3 days, and tumor volume was determined by the formula (width2 × length)/2 using a slide caliper. Twenty‐seven days after inoculation of tumor cells, the mice were euthanized with an overdose of diethyl ether, and the tumors were resected surgically. Examination of the tumor cells was conducted by hematoxylin and eosin (H&E) staining and IHC detection.
2.16. Statistical analysis
Experiments were performed in triplicate and repeated three times. Statistics obtained from each assay were imported into graphpad prism 7 (Graphpad Prism Software Inc., San Diego, CA, USA) and spss 17.0 software (SPSS Inc., Chicago, IL, USA) for graphing and analysis. All experimental results are presented as mean ± SD. Statistical differences between samples were analyzed using Student’s t‐tests for independent samples. P‐value < 0.05 was defined as statically significant.
3. Results
3.1. High RAC1 expression is related to poor prognosis in patients with ESCC
We evaluated RAC1 expression in 106 tumor samples of ESCC patients using IHC and anti‐RAC1 monoclonal antibody. As illustrated in Fig. 1A, 39 (36.8%) tumors expressed low RAC1 levels, whereas 67 (63.2%) tumors expressed high levels of RAC1. Poorer overall survival (OS; P = 0.013; Fig. 1B) and disease‐free survival (DFS; P = 0.014; Fig. 1C) in the high‐RAC1‐expression group were revealed by Kaplan–Meier analysis. Additionally, as illustrated in Table S2, higher RAC1 expression in tumors was significantly associated with larger tumor sizes (P < 0.05), lymph node metastasis (P = 0.001), and poorer clinical stages (P < 0.001). Analysis by multiple Cox regression analysis illustrated that expression of RAC1 was an independent factor for both OS [HR = 2.092, 95% confidence interval (CI) = 1.204–3.635, P < 0.01] and DFS (HR = 1.958, 95% CI = 1.170–3.275, P = 0.011; Fig. 1D).
Figure 1.
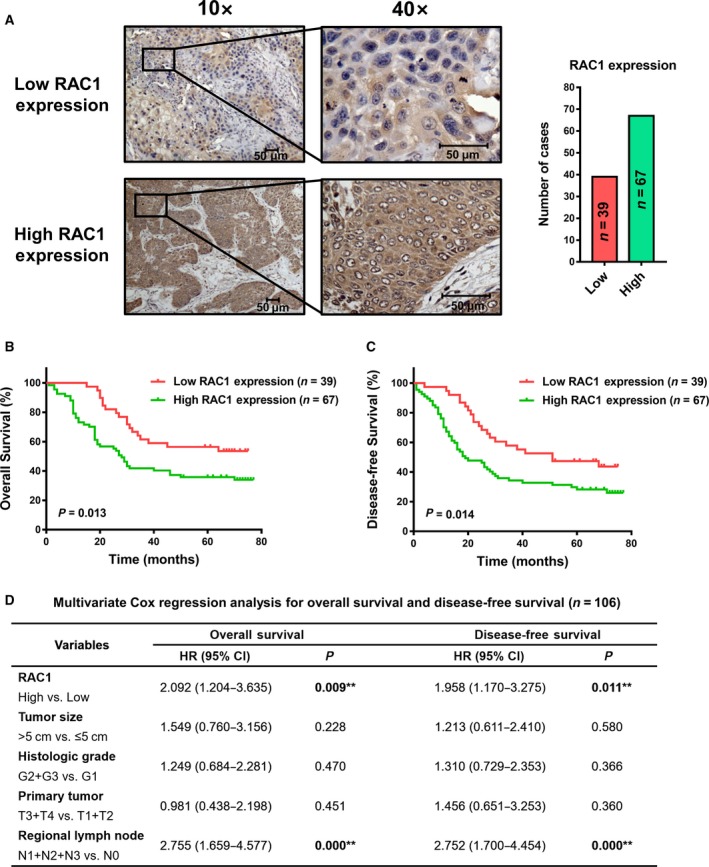
IHC staining of RAC1 and prognostic significance evaluation in ESCC patient samples. (A) IHC detection of RAC1 expression in 106 ESCC patient samples. (B, C) Kaplan–Meier survival analysis with log‐rank test evaluating the OS and DFS in patients expressing high or low levels of RAC1. (D) Multivariate Cox regression models for OS and DFS were performed. All scale bars, 50 μm.
3.2. RAC1 promotes proliferation and migration of ESCC cells
To identify the role of RAC1 in development and progression of ESCC cells, we set up a RAC1 downregulation model by siRNA transfection, which was examined by western blot at 48 h after transfection (Fig. 2A). Next, we performed MTS, EdU, wound healing, and Transwell assays to explore the role of RAC1 in tumor proliferation and migration. When RAC1 was downregulated by siRAC1, the proliferation ability was decreased in both KYSE150 and TE5 cells (Fig. 2B, Fig. S1A). In the wound healing assays, the siRNA‐induced downregulation of RAC1 led to the decrease in wound healing rate, that is, decrease in the cell migration ability (Fig. 2C). In the Transwell assays, the decrease in RAC1 expression gave rise to a decrease in the number of cells invading through the chamber (Fig. 2D). In contrast to the RAC1 downregulation model, we set up an upregulation model through plasmid transfection, which was determined by western blot at 48 h after transfection (Fig. 2E). In the MTS and EdU assays, when RAC1 was upregulated by RAC1 plasmids, the proliferation ability of the cells was increased, compared to those cells transfected with empty vector (Fig. 2F, Fig. S1B). In the wound healing assays, the upregulation of RAC1 resulted in the increase in wound healing rate (Fig. 2G). In the Transwell assays, the increase in RAC1 expression resulted in the increase in cell migration ability (Fig. 2H). Taken together, the data indicated that RAC1 plays a tumor‐promoting role in ESCC cells.
Figure 2.
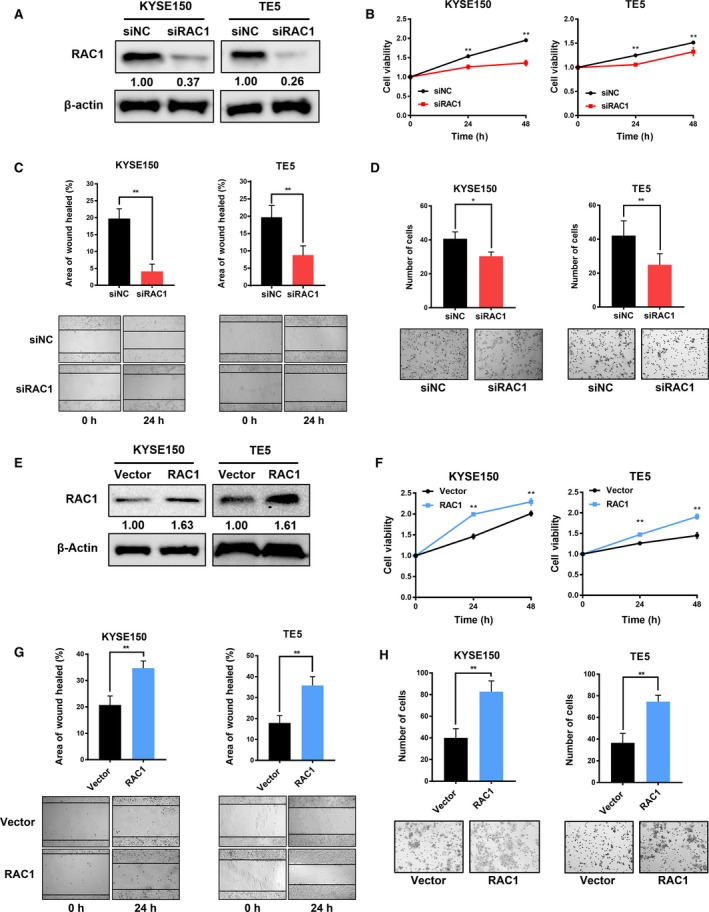
Effects of RAC1 on the proliferation and migration of ESCC cells. (A) Western blot analysis of RAC1 expression in both KYSE150 and TE5 cells at 48 h after transfection with siNC (control siRNA) or siRAC1. (B) MTS assay was performed at 24 and 48 h after siRNA transfection. (C) Representative images and quantitative analysis of the results from the wound healing assay. (D) Migration rate was measured using Transwell assay. (E) RAC1 expression in ESCC cells transfected with the empty vectors (control) or RAC1 plasmids was measured by western blot at 48 h after transfection. (F) MTS assay was performed at 24 and 48 h after the transfection of empty vectors and RAC1 plasmids. (G) Migration rate was measured using wound healing assay. (H) Representative images and quantitative analysis of the results from the Transwell assay. *P < 0.05; **P < 0.01. Statistical differences were analyzed using Student’s t‐tests. Error bars represent SD from triplicate experiments.
3.3. RAC1 confers cisplatin resistance to ESCC in vitro
Chemoresistance remains the leading cause of treatment failure in clinical practice (Perez et al., 1990; Riganti et al., 2015), and no study has revealed the relationship between RAC1 and chemoresistance of ESCC. We therefore evaluated the impact of RAC1 on chemoresistance of ESCC cells, using the gold‐standard chemotherapeutic drug cisplatin. The expression of RAC1 under knockdown or overexpression was examined using western blot at 48 h after transfection as shown in Fig. 3A,B. We analyzed the response of ESCC cells to cisplatin after RAC1 knockdown or overexpression using cell viability assay. The cisplatin resistance of KYSE150 or KYSE510 cells transfected with siRAC1 was markedly decreased than that of the cells transfected with siNC (Fig. 3A, Fig. S1C). In contrast, the cisplatin resistance of RAC1‐plasmid‐transfected cells was markedly increased than that of the empty‐vector‐transfected cells (Fig. 3B, Fig. S1D).
Figure 3.
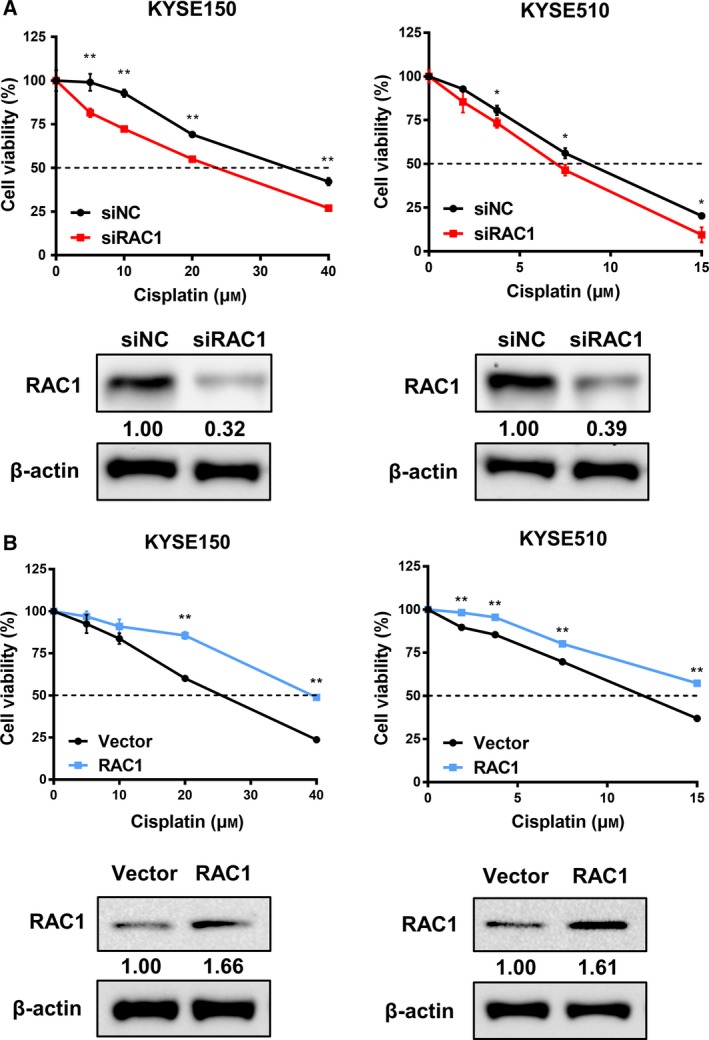
Correlation between RAC1 and cisplatin resistance in ESCC cells. (A) Chemoresistance was measured using MTS assay, and expression of protein in the siRNA‐transfected KYSE150 and KYSE510 cells was evaluated by western blot. (B) Chemoresistance was determined using MTS assay, and protein level was detected by western blot in the KYSE150 and KYSE510 cells transfected with empty vectors or RAC1 plasmids. *P < 0.05; **P < 0.01. Statistical differences were analyzed using Student’s t‐tests. Error bars represent SD from triplicate experiments.
3.4. Combination therapy of cisplatin and RAC1 inhibitor reverses the chemoresistance to cisplatin in vitro
Due to the promoting role of RAC1 in cisplatin resistance of ESCC cells, we hypothesized that RAC1 inhibitor could overcome cisplatin resistance. The chosen concentrations of EHop‐016 were derived from our pre‐experiment that examined the effect of EHop‐016 treatment alone on the cell viability of different ESCC cell lines (Fig. S2). Figure 4A demonstrates the inhibition of RAC1 activity under different concentrations of EHop‐016. Then, we used both cisplatin and RAC1 inhibitor EHop‐016 to treat ESCC cells and observed the survival rate of cells using cell viability assay. As shown in Fig. 4B and Fig. S1E, the cisplatin resistance of KYSE150 and KYSE510 cells was decreased proportionally to the concentration of EHop‐016 when compared to the control group (0 μm EHop‐016).
Figure 4.

Antitumor effects of combination therapy of cisplatin and RAC1 inhibitor in ESCC cells. (A) RAC1 activity in KYSE150 and KYSE510 cells treated with 0.0, 2.5, 5.0, and 10.0 μm RAC1 inhibitor EHop‐016 was measured by pull‐down assay for RAC1‐GTP. Representative western blot images demonstrate positive bands for RAC1‐GTP and total RAC1. (B) Cell viability was evaluated at 48 h after cisplatin and EHop‐016 treatment. (C) RAC1 activity in KYSE150 and KYSE510 cells after treatment with the indicated concentration of cisplatin (DDP), EHop‐016 (EHOP), or combination therapy (DDP and EHOP) was determined by pull‐down assay and western blot. (D) Cell cycle analysis using flow cytometry in KYSE150 and KYSE510 cells treated with the indicated concentration of cisplatin, EHop‐016, or combination therapy for 24 h. (E) The apoptotic rates of KYSE150 and KYSE510 cells treated with the indicated concentration of cisplatin, EHop‐016, or combination therapy for 24 h were measured by flow cytometry. *P < 0.05 vs. control; # P < 0.05 vs. cisplatin. Student’s t‐tests were used to analyze statistical differences. Error bars represent SD from triplicate experiments.
3.5. Combination therapy of cisplatin and RAC1 inhibitor enhances cisplatin‐induced G2/M phase cycle arrest and apoptosis in vitro
The effectiveness of combination therapy to cisplatin‐induced cell cycle arrest and apoptosis was further investigated. Cells were treated with either cisplatin monotherapy (KYSE150: 20 μm; KYSE510: 5 μm), EHop‐016 monotherapy (KYSE150, KYSE510: 10 μm), or combination therapy (cisplatin and EHop‐016) for 24 h, followed by PI staining or Annexin V–PI double staining for flow cytometry. Figure 4C shows the changes in RAC1 activity under different treatments. As shown in Fig. 4D, the combination therapy induced a strong cell cycle arrest effect. Compared to monotherapy of cisplatin, the G2/M cell cycle arrest rate was significantly elevated (KYSE150: 30.3% vs. 23.14%; KYSE510: 33.13% vs. 27.32%). As demonstrated in Fig. 4E, when cisplatin was combined with EHop‐016, the cell apoptotic rate was significantly increased, compared to monotherapy of cisplatin (KYSE150: 25.5% vs. 13.46%; KYSE510: 38.5% vs. 24.5%). After calculation through the response additivity approach, the combination therapy showed a synergistic effect in inducing cell apoptosis (data not shown).
3.6. RAC1 inhibition suppresses glycolysis in ESCC cells
To explore the molecular mechanisms by which RAC1 inhibitor reverses chemoresistance of ESCC cells to cisplatin, RNA sequencing (RNA‐seq) (SRP173519) was used to compare mRNA profiles among each treatment group. The heatmap demonstrated that after being treated with RAC1 inhibitor or combination therapy, the glycolysis, cell cycle, and p53 pathways in both KYSE150 and KYSE510 cells were significantly inhibited, when compared to the control group or cisplatin monotherapy (Fig. 5A). A large number of genes were significantly up‐ or downregulated under different treatments (Fig. 5B). GO and DAVID enrichment analysis yielded the top 10 most significantly changed terms as demonstrated in Fig. 5C. Importantly, the GO term glycolysis/gluconeogenesis was the third and the most significantly changed term in the RAC1 inhibitor monotherapy group and the combination therapy group, respectively (Fig. 5C).
Figure 5.
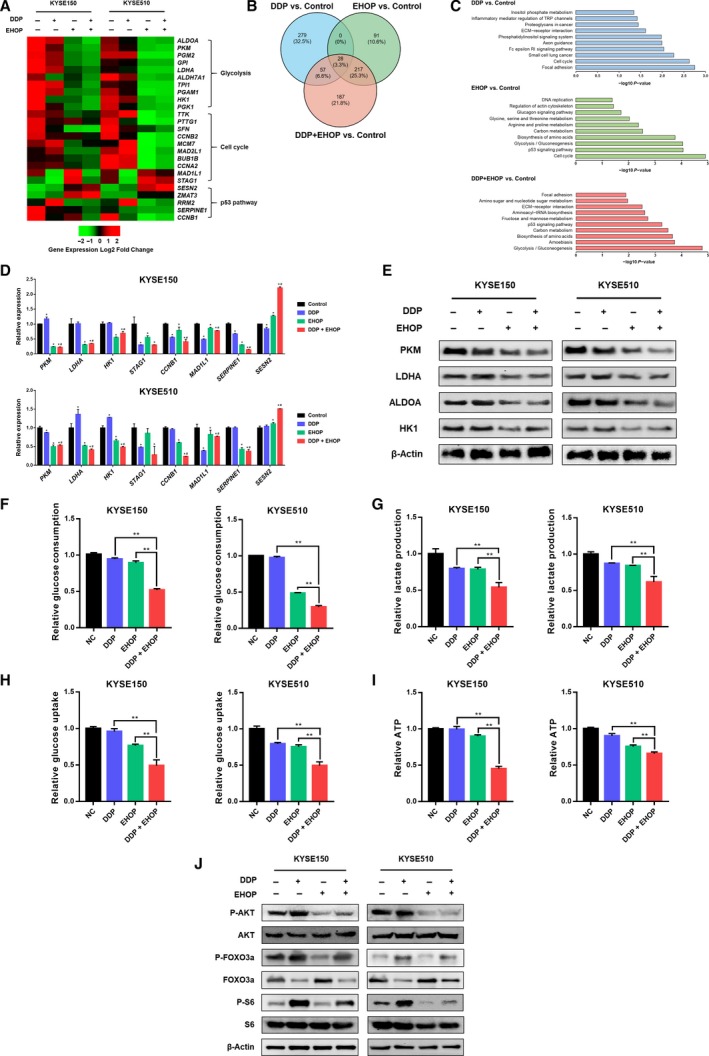
Inhibition of RAC1 dampens glycolysis via inhibition of AKT signaling. (A) RNA‐seq analysis represented by a heatmap of gene expression for glycolysis, cell cycle and p53 pathway in KYSE150 and KYSE510 cells after treatment with cisplatin (DDP), EHop‐016 (EHOP), or combination therapy (DDP and EHOP) (P < 0.001, and fold change > 1.5 log2). (B) A Venn diagram demonstrates the number of differentially expressed mRNAs for cisplatin monotherapy, EHOP‐016 monotherapy, or combination therapy versus control. (C) Differentially expressed mRNAs in each treatment group versus control were categorized using GO enrichment analysis. (D) Validation of RNA‐seq data of selected genes by qRT‐PCR (*P < 0.05 vs. control; # P < 0.05 vs. cisplatin). (E) The expression of glycolytic enzymes PKM, LDHA, ALDOA, and HK1 was examined using western blot. (F) Glucose consumption in KYSE150 and KYSE510 cells after being treated with cisplatin, EHop‐016, or combination therapy. (G) Lactate production of KYSE150 and KYSE510 cells was measured under the treatment of cisplatin, EHop‐016, or combination therapy. (H) Glucose uptake was determined after KYSE150 and KYSE510 cells were treated with cisplatin, EHop‐016, or combination therapy. (I) ATP production in KYSE150 and KYSE510 cells that were treated with cisplatin, EHop‐016, or combination therapy. *P < 0.05; **P < 0.01. (J) Western blot analysis of phospho‐AKT (P‐AKT), AKT, phospho‐FOXO3a (P‐FOXO3a), FOXO3a, phospho‐S6 (P‐S6), and S6. Statistical differences were analyzed using Student’s t‐tests. Error bars represent SD from triplicate experiments.
For further validation, the assays for detecting the effect of RAC1 inhibition on glycolysis were performed subsequently on the RNA level, the protein level, and finally the cellular metabolism level. First of all, as illustrated in Fig. 5D, qRT‐PCR validation for eight selected differentially expressed mRNAs was consistent with the RNA‐seq results (Fig. 5A). Next, we determined whether the same results were observed on the protein level. The enzymes critical for aerobic glycolysis, including PKM, LDHA, ALDOA, and HK1, were suppressed under treatment with RAC1 inhibitor or combination therapy (Fig. 5E). Finally, we determined whether the effect of combination therapy on RAC1 inhibition eventually altered the cellular metabolism. In our study, we mainly focus on the effect of RAC1 inhibition on reversing the cisplatin resistance in ESCC cells from the aspect of glycolysis. As illustrated in Fig. 5F–I, with the combination of cisplatin and EHop‐016, significant decreases in glucose consumption (Fig. 5F), lactate (Fig. 5G) and ATP production (Fig. 5I), and glucose uptake (Fig. 5H) were observed in both the KYSE150 and KYSE510 cells, when compared to the cisplatin or EHop‐016 single‐treatment groups (P < 0.001). Based on these results, inhibition of RAC1 overcomes the cisplatin resistance and suppresses ESCC cell glycolysis.
To further verify the relationship between RAC1 suppression/overexpression and glycolysis, RAC1 was directly knocked down or overexpressed. The consequences on glycolysis corroborated our proposed mechanism. The critical enzymes for aerobic glycolysis, including PKM, LDHA, ALDOA, and HK1, were suppressed under RAC1 silencing but upregulated in RAC1 overexpression as shown Fig. 6A. Similarly, the alterations of cellular metabolism were detected under RAC1 silencing or overexpression. According to our results on glucose consumption (Fig. 6B), lactate production (Fig. 6C), glucose uptake (Fig. 6D), and ATP production (Fig. 6E), significant reduction of glycolysis under RAC1 silencing and increases under RAC1 overexpression were observed in both KYSE150 and KYSE510 cells. Taken together, these results are highly consistent with our proposed mechanism that RAC1 inhibition suppresses glycolysis in ESCC cells.
Figure 6.
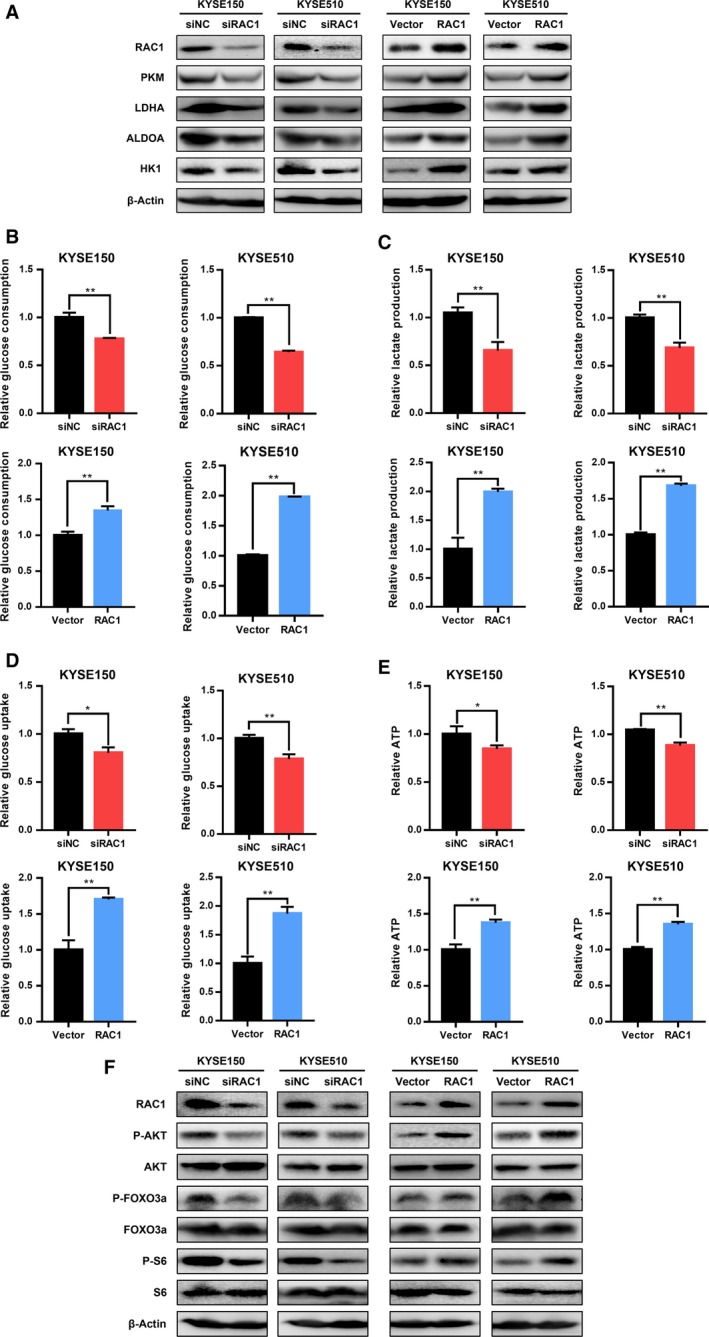
Effects of RAC1 on glycolysis in ESCC cells. (A) Western blot analysis of glycolytic enzymes PKM, LDHA, ALDOA, and HK1 under RAC1 silencing or overexpression. (B) Glucose consumption of KYSE150 and KYSE510 cells that were transfected with siRAC1 or RAC1 plasmid. (C) Lactate production in KYSE150 and KYSE510 cells transfected with siRAC1 or RAC1 plasmid was measured. (D) Glucose uptake was detected in KYSE150 and KYSE510 cells after transfection with siRAC1 or RAC1 plasmid. (E) ATP generation in KYSE150 and KYSE510 cells was determined under transfection of siRAC1 and RAC1 plasmid. *P < 0.05; **P < 0.01. (F) Western blot analysis of phospho‐AKT (P‐AKT), AKT, phospho‐FOXO3a (P‐FOXO3a), FOXO3a, phospho‐S6 (P‐S6) and S6 under RAC1 silencing or overexpression. Student’s t‐tests were used to analyze statistical differences. Error bars represent SD from triplicate experiments.
3.7. Inhibition of RAC1 suppresses glycolysis via blocking AKT/FOXO3a signaling in ESCC cells
It is well known that AKT exerts a direct influence on glucose metabolism (Robey and Hay, 2009). It is also reported that there exists a mutual regulation of RAC1 and AKT, which shows that RAC1 acts as an upstream regulator of AKT and vice versa (Kwon et al., 2000; Murga et al., 2002; Zhu et al., 2015). Knowing that RAC1 deletion suppresses the activation of downstream targets of AKT (Saci et al., 2011), therefore, we hypothesized that the suppressive effect of RAC1 inhibitor on the glycolytic enzymes was due to the inhibition of AKT pathway. As shown in Fig. 5J, phosphorylation of AKT was drastically suppressed by RAC1 inhibitor treatment or combination therapy. Interestingly, treatment with cisplatin significantly enhanced the phosphorylation of AKT, while the expression of AKT remained unchanged (Fig. 5J). Furthermore, we investigated the downstream proteins of AKT pathway such as FOXO3a and S6, which are also known to involve in regulation of glycolysis (Khatri et al., 2010). Their activation also tightly depended on the mammalian target of rapamycin (mTOR) activation, which indicated that mTOR can be critical in regulating cancer metabolism on the downstream of RAC1 (Esen et al., 2013). Our findings demonstrated that the phosphorylation of FOXO3a and S6, which served as the markers of mTOR activity (Gödel et al., 2011; Saci et al., 2011; Sarbassov et al., 2005), was drastically increased under cisplatin treatment and decreased under RAC1 inhibitor or combination therapy, when compared to the control group or the cisplatin monotherapy group (Fig. 5J). The levels of FOXO3a were inversely correlated to the levels of P‐FOXO3a, while S6 levels were not altered under different treatments (Fig. 5J). Consistently, the phosphorylation of AKT, FOXO3a, and S6 was also decreased with RAC1 downregulation and increased under RAC1 overexpression (Fig. 6F).
In order to validate the role of FOXO3a in regulating glycolytic enzymes, the effects of FOXO3a knockdown on the glycolytic enzymes were detected by western blot. As shown in Fig. S3, FOXO3a silencing decreased the expression of P‐FOXO3a, PKM, LDHA, ALDOA, and HK1, which indicated that FOXO3a silencing had an inhibitory effect on the glycolytic enzymes. In summary, inhibition of RAC1 suppresses glycolysis through the AKT/FOXO3a pathway.
3.8. Combining chemotherapy with RAC1 inhibitor results in enhanced antitumor effects by suppressing the glycolytic enzymes in ESCC xenograft mice
To assess the in vivo therapeutic effects of combination therapy of cisplatin and EHop‐016, we established an ESCC xenograft tumor model by implanting KYSE150 cells subcutaneously in nu/nu mice (females, 6–8 weeks of age). Cisplatin and EHop‐016 were injected intraperitoneally every 3 days for six times after the tumor volume reached approximately 100 mm3 (Fig. 7A). The combination of cisplatin and EHop‐016 significantly suppressed tumor volume and tumor weight, compared to the control group or each monotherapy (Fig. 7B–D). The tumor necrotic area was significantly increased, while the expression of Ki67 was significantly reduced in tumors of combination therapy group, compared to that of control group or each monotherapy (Fig. 7E). More importantly, the expression of enzymes for glycolysis, including PKM, LDHA, and HK1, was significantly suppressed under the injection of RAC1 inhibitor (Fig. 7E).
Figure 7.
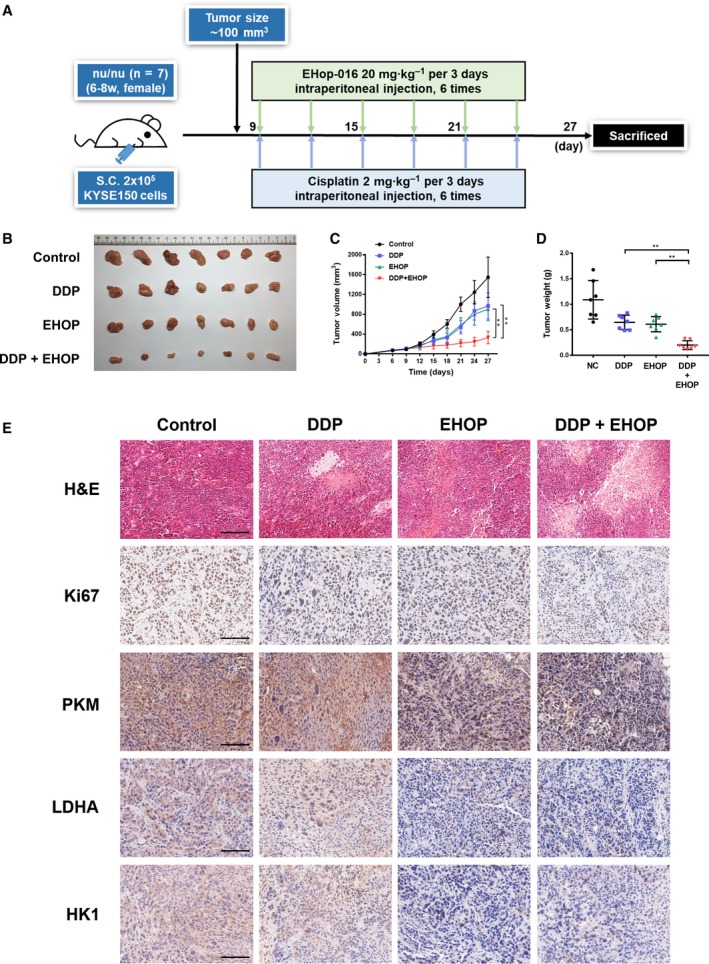
Combining chemotherapy with RAC1 inhibitor enhances therapeutic effects in ESCC xenograft mouse models. (A) Summary of in vivo study: Female nu/nu mice (6–8 weeks of age, n = 28) were inoculated with 2 × 10⁵ KYSE150 cells (2 × 10⁶ cells·mL−1, 100 μL per mouse). The mice received intraperitoneal injection of cisplatin (DDP), EHop‐016 (EHOP), or combination of drugs (DDP and EHOP) every 3 days when tumor volumes reached approximately 100 mm3. The mice were euthanized 27 days after the inoculation of cells. (B) Tumors were resected at day 27. (C) Tumor volumes were evaluated every 3 days. (D) Tumor weights were determined at day 27. (E) Representative images for H&E staining and immunohistochemical analysis of Ki67, PKM, LDHA, and HK1 in different treatment groups. All scale bars, 100 μm. *P < 0.05; **P < 0.01. Statistical differences were analyzed using Student’s t‐tests. Error bars represent SD.
4. Discussions
Accumulating evidence has shown that RAC1 is involved in the development and progression of tumors (Myant et al., 2013; Wang et al., 2015). However, the role of RAC1 remains controversial, indicating that RAC1 is involved in a complex network of regulation in tumors. For example, although RAC1 is generally thought to play a tumor‐promoting role in tumor development (Baugher et al., 2005; Chen et al., 2011; Frances et al., 2015), some research indicates that RAC1 suppresses tumor progression in renal carcinomas and skin cancers (Engers et al., 2001; Malliri et al., 2002). Our results indicate that high RAC1 levels in tumor correlate with poor prognosis in ESCC patients, and it is confirmed by our in vitro data, which demonstrate that RAC1 positively regulates proliferation and migration of ESCC cells. Thus, RAC1 plays a tumor‐promoting role in the progression and development of ESCC. In clinical practice, RAC1 possesses great potentials to be a biomarker to evaluate the prognosis of ESCC patients.
Clinically, cisplatin is one of the most effective chemotherapeutic drugs to treat various malignancies, such as testicular, ovarian, and esophageal cancers (Eljack et al., 2014). Despite treatment advances, tumor resistance to cisplatin remains the major cause of treatment failure (Perez et al., 1990; Riganti et al., 2015). Previous studies indicate that the involvement of RAC1 in regulating chemoresistance differs in various types of cancers. For example, in lung cancer and head and neck cell carcinoma, silencing of RAC1 is related to higher cisplatin sensitivity (Chen et al., 2011; Skvortsov et al., 2014). In contrast, in epidermoid carcinoma or liver carcinoma, downregulation of RAC1 results in a decrease in cisplatin sensitivity (Shen et al., 2004). However, to the best of our knowledge, there are two major limitations for the current studies about RAC1 and chemotherapy. First, no in vivo study for combination therapy using RAC1 inhibitor and chemotherapeutic drugs has been conducted. Second, the molecular mechanisms by which RAC1 regulates chemoresistance are largely unknown. Our study unveils that the expression of RAC1 is positively related to cisplatin resistance. Thus, inhibiting RAC1 can suppress both the development and chemoresistance of ESCC cells, and it is reasonable to use a RAC1 inhibitor for combination with chemotherapy. In comparison with RAC1 siRNA, a RAC1 inhibitor can produce a more potent effect, because siRNA does not completely eliminate the expression of RAC1 proteins (Gastonguay et al., 2012). NSC23766 is the first developed and most widely used RAC1 inhibitor targeting the RAC1‐GEF interaction (Dütting et al., 2015; Gao et al., 2004; Levay et al., 2013). However, the low potency (IC50 > 75 μm) of NSC23766 limits its use as a therapeutic agent (Gao et al., 2004). Similarly, other RAC inhibitors, including AZA1, EHT 1864, IA‐116, and ZINC69391, also have high effective concentrations (IC50 = 10–50 μm) (Cardama et al., 2014; Ferri et al., 2009; Montalvo‐Ortiz et al., 2012; Zins et al., 2013). A recently synthesized RAC1 inhibitor, EHop‐016, blocks the GEF‐RAC interaction and is specific for RAC1 at concentrations lower than its IC50 (Humphries‐Bickley et al., 2017; Montalvo‐Ortiz et al., 2012). The potency of EHop‐016 is approximately 100 times higher than that of NSC23766 and 10–50 times higher than that of other RAC inhibitors; therefore, it holds the greatest potential as a targeted therapeutic, and for combination therapy with chemotherapeutic drugs both in vitro and in vivo (Bid et al., 2013; Montalvo‐Ortiz et al., 2012). Our data suggest that RAC1 inhibitor can reverse chemoresistance in both ESCC cells and xenograft mouse models.
Even under normal oxygen concentrations, cancer cells produce energy mainly via glycolysis in high rates, and this phenomenon (aerobic glycolysis) is a hallmark of cancer (Cerella et al., 2014; Devic, 2016; Liberti and Locasale, 2016). Through overexpressing the corresponding key metabolic enzymes, this newly acquired metabolic profile is prone to decide multiple cancer hallmarks including resistance to cell demise (Cerella et al., 2014). These findings indicate that glycolytic enzymes can also act as direct modulators of cell death, by relocalizing to subcellular compartments, including the nucleus, the plasma membrane, and the mitochondria, rather than function simply at the cytosolic levels as they were primarily expected to do (Sirover, 2012; Tristan et al., 2011; Ucker et al., 2012). In addition to its tumor‐promoting effects, aerobic glycolysis provides an environment that exacerbates drug resistance of cancer cells (Bhattacharya et al., 2016). Hence, the enzymes that directly regulate glycolysis, especially hexokinase 1 (HK1), pyruvate kinase (PKM), lactate dehydrogenase A (LDHA), and aldolase A (ALDOA), are recruited in deteriorating chemoresistance (Li et al., 2015c). HK1, which involves in the first step of most glucose metabolism pathways, is a rate‐limiting enzyme in glucose oxidation reaction (Li et al., 2015c). PKM is responsible for catalyzing the last step of glycolysis and regarded as a rate‐limiting enzyme for glycolysis (Taniguchi et al., 2015). LDHA and ALDOA are key enzymes for glycolysis and have been proved to promote drug resistance (Long et al., 2014; Xie et al., 2014). Our RNA‐seq results indicate that almost all the enzymes for glycolysis are suppressed under RAC1 inhibitor or combination therapy. Further validation by qRT‐PCR, western blot, and IHC for the selected glycolytic enzymes confirms the RNA‐seq results. Therefore, our study underlines the significance of RAC1 in regulating glycolysis.
Interestingly, the AKT signaling, which is considered to be the ‘glycolytic kinase’ that contributes to aerobic glycolysis (Robey and Hay, 2009), is shown to be significantly activated by cisplatin and can be suppressed by the RAC1 inhibitor in our study. As indicated in the current research, there exists a mutual regulation of RAC1 and AKT, which should be considered comprehensively. There are some studies clarifying that AKT acts as a direct (Zhu et al., 2015) or indirect (Kwon et al., 2000) upstream modulator of RAC1. In contrast, other studies indicate that RAC1 can function as an upstream regulator of AKT (Murga et al., 2002). Our data indicate that under chemotherapy, ESCC cells utilize the activation of AKT signaling for adaptation and survival, while further administration of RAC1 inhibitor can reverse both the activation of AKT signaling and chemoresistance. These results are consistent with what we have interpreted previously that RAC1 is the upstream regulator of AKT in overcoming chemoresistance. In addition, over the past few years, drugs targeting AKT have been extensively developed and tested in clinical trials (Faes and Dormond, 2015). However, the negative feedback mechanisms have considerably decreased the potency of AKT inhibitors and caused undesired side effects (Chandarlapaty, 2012; Nitulescu et al., 2016). Consequently, inhibiting the activation of RAC1, which is located upstream of AKT, can be an admissible strategy to maximize the therapeutic effects of AKT inhibitor in clinical practice.
There is an intriguing issue that the phosphorylated form of FOXO3a was slightly affected by the combination therapy with respect to DDP treatment alone. We suggest that because of the further downstream position of FOXO3a, RAC1 inhibition may cause fewer effects on FOXO3a expression under cisplatin‐induced FOXO3a activation. Apart from the AKT/FOXO3a pathway which is modulated by RAC1 as we proposed, it is also possible that there exists a more complicated regulatory mechanism, where some complementary pathways may be activated to counteract the effect of RAC1 on FOXO3a expression.
In addition, one of the approaches that RAC1 uses to control cancer cell metabolism is by interacting with mTOR. RAC1 has been proved to critically regulate both mTORC1 and mTORC2 by binding directly to them, localizing mTOR to specific membranes, and mediating their activation in response to growth factors (Esen et al., 2013). RAC1 deletion inhibits the activation of the translational regulators 4eBP1 and p70 S6 kinase, which are the downstream targets of mTORC1 (Ma and Blenis, 2009), and suppresses the activation of AKT, which is controlled by mTORC2 (Saci et al., 2011). To be more specific, mTORC1 is well known to modulate protein synthesis via phosphorylation of 4eBP1 and S6K1, the latter of which will further phosphorylate the ribosomal protein S6 (Ma and Blenis, 2009). mTORC2, which is recruited by RAC1, is reported to activate AKT by AKT Ser473 phosphorylation (Hresko and Mueckler, 2005; Jacinto et al., 2006; Saci et al., 2011; Sarbassov et al., 2005). In order to detect the mTOR activation, several representative markers are chosen for the study. Gödel et al. reported that pS6 can serve as a marker of mTORC1 activity (Gödel et al., 2011), while the phosphorylation and activation of the kinases AKT represent the primary function of mTORC2 (Sarbassov et al., 2005). Therefore, the detection of the phosphorylated form of AKT and S6 can represent mTOR activity as shown in Fig. 5J in our study, where mTOR activation is decreased under EHop‐016 treatment alone and combination treatment.
5. Conclusions
Our study demonstrates that RAC1 promotes ESCC progression and development and is associated with poor prognosis in patients. Inhibition of RAC1 reverses cisplatin resistance in ESCC both in vivo and in vitro via suppressing glycolysis. These findings outline the significance of RAC1 in regulating glycolysis and provide a novel insight into the mechanisms of chemoresistance in ESCC. Thus, RAC1 is a promising therapeutic target for the treatment of ESCC patients.
Conflict of interest
The authors declare no conflict of interest.
Author contributions
R‐JZ, C‐WZ, L‐YX, and E‐ML conceptualized the study; R‐JZ, C‐WZ, L‐YX, and E‐ML developed the methodology; R‐JZ, C‐WZ, J‐EG, H‐XZ, LX, L‐YX, and E‐ML carried out investigation; R‐JZ and C‐WZ wrote the original draft of the manuscript; J‐EG, H‐XZ, LX, and E‐ML reviewed and edited the manuscript; R‐JZ, C‐WZ, J‐EG, LX, L‐YX, and E‐ML acquired funding; R‐JZ, L‐YX, and E‐ML provided resources; and L‐YX and E‐ML supervised the study.
Supporting information
Fig. S1 . Combination therapy of cisplatin and RAC1 inhibitor suppresses chemoresistance to cisplatin in preventing ESCC cell proliferation.
Fig. S2 . RAC1 inhibitor EHop‐016 inhibits ESCC cell viability.
Fig. S3 . FOXO3a modulates the expression of glycolytic enzymes.
Table S1 . Characteristics of the ESCC patients.
Table S2 . The correlation between RAC1 and clinicopathological characteristics in ESCC (n = 106).
Table S3 . Primers used in this study.
Acknowledgements
This work was supported by the Natural Science Foundation of China‐Guangdong Joint Fund (U1601229), the Special Funds for the Cultivation of Guangdong College Students’ Scientific and Technological Innovation (‘Climbing Program’ Special Funds, pdjh2019a0182), and the National Undergraduate Training Program for Innovation and Entrepreneurship (201810560037). The authors thank Liu Peng, Feng Pan, Yang Chen, Xiu‐E Xu, and Hui‐Xiang Zhang for technical support. The authors thank Dr Shao‐Hong Wang and Dr Zhi‐Yong Wu for kindly offering the patient samples and clinical data.
Rui‐Jie Zeng and Chun‐Wen Zheng contributed equally to this work
Contributor Information
Li‐Yan Xu, Email: lyxu@stu.edu.cn.
En‐Min Li, Email: nmli@stu.edu.cn.
References
- Abnet CC, Arnold M and Wei W‐Q (2017) Epidemiology of esophageal squamous cell carcinoma. Gastroenterology 154, 360–373. [DOI] [PMC free article] [PubMed] [Google Scholar]
- Alfarouk KO, Stock C‐M, Taylor S, Walsh M, Muddathir AK, Verduzco D, Bashir AHH, Mohammed OY, Elhassan GO, Harguindey S et al. (2015) Resistance to cancer chemotherapy: failure in drug response from ADME to P‐gp. Cancer Cell Int 15, 71. [DOI] [PMC free article] [PubMed] [Google Scholar]
- Allum WH, Bonavina L, Cassivi SD, Cuesta MA, Dong ZM, Felix VN, Figueredo E, Gatenby PA, Haverkamp L and Ibraev MA (2014) Surgical treatments for esophageal cancers. Ann N Y Acad Sci 1325, 242–268. [DOI] [PMC free article] [PubMed] [Google Scholar]
- Anders S and Huber W (2010) Differential expression analysis for sequence count data. Genome Biol 11, R106. [DOI] [PMC free article] [PubMed] [Google Scholar]
- Ashburner M, Ball CA, Blake JA, Botstein D, Butler H, Cherry JM, Davis AP, Dolinski K, Dwight SS, Eppig JT et al. (2000) Gene ontology: tool for the unification of biology. The Gene Ontology Consortium. Nat Genet 25, 25–29. [DOI] [PMC free article] [PubMed] [Google Scholar]
- Baugher PJ, Krishnamoorthy L, Price JE and Dharmawardhane SF (2005) Rac1 and Rac3 isoform activation is involved in the invasive and metastatic phenotype of human breast cancer cells. Breast Cancer Res 7, R965. [DOI] [PMC free article] [PubMed] [Google Scholar]
- Bhattacharya B, Omar MFM and Soong R (2016) The Warburg effect and drug resistance. Br J Pharmacol 173, 970–979. [DOI] [PMC free article] [PubMed] [Google Scholar]
- Bid HK, Roberts RD, Manchanda PK and Houghton PJ (2013) RAC1: an emerging therapeutic option for targeting cancer angiogenesis and metastasis. Mol Cancer Ther 12, 1925–1934. [DOI] [PMC free article] [PubMed] [Google Scholar]
- Cardama AG, Comin MJ, Hornos L, Gonzalez N, Defelipe L, Turjanski AG, Alonso DF, Gomez DE and Menna PL (2014) Preclinical development of novel Rac1‐GEF signaling inhibitors using a rational design approach in highly aggressive breast cancer cell lines. Anti‐Cancer Agents Med Chem (Formerly Current Medicinal Chemistry‐Anti‐Cancer Agents) 14, 840–851. [DOI] [PMC free article] [PubMed] [Google Scholar]
- Cardama G, Gonzalez N, Maggio J, Menna PL and Gomez D (2017) Rho GTPases as therapeutic targets in cancer. Int J Oncol 51, 1025–1034. [DOI] [PMC free article] [PubMed] [Google Scholar]
- Cerella C, Dicato M and Diederich M (2014) Modulatory roles of glycolytic enzymes in cell death. Biochem Pharmacol 92, 22–30. [DOI] [PubMed] [Google Scholar]
- Chandarlapaty S (2012) Negative feedback and adaptive resistance to the targeted therapy of cancer. Cancer Discov 2, 311–319. [DOI] [PMC free article] [PubMed] [Google Scholar]
- Chen Q‐Y, Xu L‐Q, Jiao D‐M, Yao Q‐H, Wang Y‐Y, Hu H‐Z, Wu Y‐Q, Song J, Yan J and Wu L‐J (2011) Silencing of Rac1 modifies lung cancer cell migration, invasion and actin cytoskeleton rearrangements and enhances chemosensitivity to antitumor drugs. Int J Mol Med 28, 769–776. [DOI] [PubMed] [Google Scholar]
- D’Amico TA (2007) Outcomes after surgery for esophageal cancer. Gastrointest Cancer Res 1, 188. [PMC free article] [PubMed] [Google Scholar]
- Devic S (2016) Warburg effect‐a consequence or the cause of carcinogenesis? Journal of Cancer 7, 817. [DOI] [PMC free article] [PubMed] [Google Scholar]
- Dütting S, Heidenreich J, Cherpokova D, Amin E, Zhang SC, Ahmadian MR, Brakebusch C and Nieswandt B (2015) Critical off‐target effects of the widely used Rac1 inhibitors NSC 23766 and EHT 1864 in mouse platelets. J Thromb Haemost 13, 827–838. [DOI] [PubMed] [Google Scholar]
- Eljack ND, Ma H‐YM, Drucker J, Shen C, Hambley TW, New EJ, Friedrich T and Clarke RJ (2014) Mechanisms of cell uptake and toxicity of the anticancer drug cisplatin. Metallomics 6, 2126–2133. [DOI] [PubMed] [Google Scholar]
- Engers R, Springer E, Michiels F, Collard JG and Gabbert HE (2001) Rac affects invasion of human renal cell carcinomas by up‐regulating tissue inhibitor of metalloproteinases (TIMP)‐1 and TIMP‐2 expression. J Biol Chem 276, 41889–41897. [DOI] [PubMed] [Google Scholar]
- Esen E, Chen J, Karner CM, Okunade AL, Patterson BW and Long F (2013) WNT‐LRP5 signaling induces Warburg effect through mTORC2 activation during osteoblast differentiation. Cell Metab 17, 745–755. [DOI] [PMC free article] [PubMed] [Google Scholar]
- Faes S and Dormond O (2015) PI3K and AKT: unfaithful partners in cancer. Int J Mol Sci 16, 21138–21152. [DOI] [PMC free article] [PubMed] [Google Scholar]
- Ferri N, Corsini A, Bottino P, Clerici F and Contini A (2009) Virtual screening approach for the identification of new Rac1 inhibitors. J Med Chem 52, 4087–4090. [DOI] [PubMed] [Google Scholar]
- Foucquier J and Guedj M (2015) Analysis of drug combinations: current methodological landscape. Pharmacol Res Perspect 3, e00149. [DOI] [PMC free article] [PubMed] [Google Scholar]
- Frances D, Sharma N, Pofahl R, Maneck M, Behrendt K, Reuter K, Krieg T, Klein C, Haase I and Niemann C (2015) A role for Rac1 activity in malignant progression of sebaceous skin tumors. Oncogene 34, 5505. [DOI] [PubMed] [Google Scholar]
- Gao Y, Dickerson JB, Guo F, Zheng J and Zheng Y (2004) Rational design and characterization of a Rac GTPase‐specific small molecule inhibitor. Proc Natl Acad Sci USA 101, 7618–7623. [DOI] [PMC free article] [PubMed] [Google Scholar]
- Gastonguay A, Berg T, Hauser AD, Schuld N, Lorimer E and Williams CL (2012) The role of Rac1 in the regulation of NF‐kB activity, cell proliferation, and cell migration in non‐small cell lung carcinoma. Cancer Biol Ther 13, 647–656. [DOI] [PMC free article] [PubMed] [Google Scholar]
- Gödel M, Hartleben B, Herbach N, Liu S, Zschiedrich S, Lu S, Debreczeni‐Mór A, Lindenmeyer MT, Rastaldi M‐P, Hartleben G et al. (2011) Role of mTOR in podocyte function and diabetic nephropathy in humans and mice. J Clin Investig 121, 2197–2209. [DOI] [PMC free article] [PubMed] [Google Scholar]
- Hresko RC and Mueckler M (2005) mTOR·RICTOR is the ser kinase for Akt/protein kinase B in 3T3-L1 adipocytes. J Biol Chem 280, 40406–40416. [DOI] [PubMed] [Google Scholar]
- Huang DW, Sherman BT and Lempicki RA (2009) Bioinformatics enrichment tools: paths toward the comprehensive functional analysis of large gene lists. Nucleic Acids Res 37, 1–13. [DOI] [PMC free article] [PubMed] [Google Scholar]
- Humphries‐Bickley T, Castillo‐Pichardo L, Hernandez‐O‐Farrill E, Borrero‐Garcia LD, Forestier‐Roman I, Gerena Y, Blanco M, Rivera‐Robles MJ, Rodriguez‐Medina JR and Cubano LA (2017) Characterization of a dual Rac/Cdc42 inhibitor MBQ‐167 in metastatic cancer. Mol Cancer Ther 16, 805–818. [DOI] [PMC free article] [PubMed] [Google Scholar]
- Jacinto E, Facchinetti V, Liu D, Soto N, Wei S, Jung SY, Huang Q, Qin J and Su B (2006) SIN1/MIP1 maintains rictor-mTOR complex integrity and regulates Akt phosphorylation and substrate specificity. Cell 127, 125–137. [DOI] [PubMed] [Google Scholar]
- Jemal A, Bray F, Center MM, Ferlay J, Ward E and Forman D (2011) Global cancer statistics. CA Cancer J Clin 61, 69–90. [DOI] [PubMed] [Google Scholar]
- Jiang Y, Jiang YY, Xie JJ, Mayakonda A, Hazawa M, Chen L, Xiao JF, Li CQ, Huang ML, Ding LW et al. (2018) Co‐activation of super‐enhancer‐driven CCAT1 by TP63 and SOX2 promotes squamous cancer progression. Nat Commun 9, 3619. [DOI] [PMC free article] [PubMed] [Google Scholar]
- Kamai T, Shirataki H, Nakanishi K, Furuya N, Kambara T, Abe H, Oyama T and Yoshida K‐I (2010) Increased Rac1 activity and Pak1 overexpression are associated with lymphovascular invasion and lymph node metastasis of upper urinary tract cancer. BMC Cancer 10, 164. [DOI] [PMC free article] [PubMed] [Google Scholar]
- Khatri S, Yepiskoposyan H, Gallo CA, Tandon P and Plas DR (2010) FOXO3a regulates glycolysis via transcriptional control of tumor suppressor TSC1. J Biol Chem 285, 15960–15965. [DOI] [PMC free article] [PubMed] [Google Scholar]
- Kihara C, Tsunoda T, Tanaka T, Yamana H, Furukawa Y, Ono K, Kitahara O, Zembutsu H, Yanagawa R, Hirata K et al (2001) Prediction of sensitivity of esophageal tumors to adjuvant chemotherapy by cDNA microarray analysis of gene‐expression profiles. Cancer Res 61, 6474–6479. [PubMed] [Google Scholar]
- Kwon T, Kwon DY, Chun J, Kim JH and Kang SS (2000) Akt protein kinase inhibits Rac1‐GTP binding through phosphorylation at serine 71 of Rac1. J Biol Chem 275, 423–428. [DOI] [PubMed] [Google Scholar]
- Levay M, Krobert KA, Wittig K, Voigt N, Bermudez M, Wolber G, Dobrev D, Levy FO and Wieland T (2013) NSC23766, a widely used inhibitor of Rac1 activation, additionally acts as a competitive antagonist at muscarinic acetylcholine receptors. J Pharmacol Exp Ther 347, 69–79. [DOI] [PubMed] [Google Scholar]
- Li C, Huang G, Wu Z, Xu Y, Li X, Xue Y, Zhu Y, Zhao J, Li M and Zhang J (2017) Integrative analyses of transcriptome sequencing identify novel functional lncRNAs in esophageal squamous cell carcinoma. Oncogenesis 6, e297. [DOI] [PMC free article] [PubMed] [Google Scholar]
- Li L‐Y, Jiang H, Xie Y‐M, Liao L‐D, Cao H‐H, Xu X‐E, Chen B, Zeng F‐M, Zhang Y‐L and Du Z‐P (2015a) Macrolide analog F806 suppresses esophageal squamous cell carcinoma (ESCC) by blocking β1 integrin activation. Oncotarget 6, 15940. [DOI] [PMC free article] [PubMed] [Google Scholar]
- Li L‐Y, Zhang K, Jiang H, Xie Y‐M, Liao L‐D, Chen B, Du Z‐P, Zhang P‐X, Chen H and Huang W (2015b) Quantitative proteomics reveals the downregulation of GRB2 as a prominent node of F806‐targeted cell proliferation network. J Proteomics 117, 145–155. [DOI] [PubMed] [Google Scholar]
- Li XB, Gu JD and Zhou QH (2015c) Review of aerobic glycolysis and its key enzymes–new targets for lung cancer therapy. Thorac Cancer 6, 17–24. [DOI] [PMC free article] [PubMed] [Google Scholar]
- Liberti MV and Locasale JW (2016) The Warburg effect: how does it benefit cancer cells? Trends Biochem Sci 41, 211–218. [DOI] [PMC free article] [PubMed] [Google Scholar]
- Long F, Cai X, Luo W, Chen L and Li K (2014) Role of aldolase A in osteosarcoma progression and metastasis: in vitro and in vivo evidence. Oncol Rep 32, 2031–2037. [DOI] [PubMed] [Google Scholar]
- Ma XM and Blenis J (2009) Molecular mechanisms of mTOR‐mediated translational control. Nat Rev Mol Cell Biol 10, 307. [DOI] [PubMed] [Google Scholar]
- Malliri A, Van Der Kammen RA, Clark K, Van Der Valk M, Michiels F and Collard JG (2002) Mice deficient in the Rac activator Tiam1 are resistant to Ras‐induced skin tumours. Nature 417, 867. [DOI] [PubMed] [Google Scholar]
- Montalvo‐Ortiz BL, Castillo‐Pichardo L, Hernández E, Humphries‐Bickley T, De La Mota‐Peynado A, Cubano LA, Vlaar CP and Dharmawardhane S (2012) Characterization of EHop‐016, novel small molecule inhibitor of Rac GTPase. J Biol Chem 287, 13228–13238. [DOI] [PMC free article] [PubMed] [Google Scholar]
- Murga C, Zohar M, Teramoto H and Gutkind JS (2002) Rac1 and RhoG promote cell survival by the activation of PI3K and Akt, independently of their ability to stimulate JNK and NF‐κB. Oncogene 21, 207–216. [DOI] [PubMed] [Google Scholar]
- Myant KB, Cammareri P, McGhee EJ, Ridgway RA, Huels DJ, Cordero JB, Schwitalla S, Kalna G, Ogg E‐L and Athineos D (2013) ROS production and NF‐κB activation triggered by RAC1 facilitate WNT‐driven intestinal stem cell proliferation and colorectal cancer initiation. Cell Stem Cell 12, 761–773. [DOI] [PMC free article] [PubMed] [Google Scholar]
- Nitulescu GM, Margina D, Juzenas P, Peng Q, Olaru OT, Saloustros E, Fenga C, Spandidos DΑ, Libra M and Tsatsakis AM (2016) Akt inhibitors in cancer treatment: the long journey from drug discovery to clinical use. Int J Oncol 48, 869–885. [DOI] [PMC free article] [PubMed] [Google Scholar]
- Perez RP, Hamilton TC and Ozols RF (1990) Resistance to alkylating agents and cisplatin: insights from ovarian carcinoma model systems. Pharmacol Ther 48, 19–27. [DOI] [PubMed] [Google Scholar]
- Pontén F, Schwenk JM, Asplund A and Edqvist P‐HD (2011) The Human Protein Atlas as a proteomic resource for biomarker discovery. J Intern Med 270, 428–446. [DOI] [PubMed] [Google Scholar]
- Riganti C, Mini E and Nobili S (2015) Multidrug resistance in cancer: pharmacological strategies from basic research to clinical issues. Front Oncol 5, 105. [DOI] [PMC free article] [PubMed] [Google Scholar]
- Robey RB and Hay N (2009) Is Akt the “Warburg kinase”?—Akt‐energy metabolism interactions and oncogenesis. Sem Cancer Biol 19, 25–31. [DOI] [PMC free article] [PubMed] [Google Scholar]
- Saci A, Cantley LC and Carpenter CL (2011) Rac1 regulates the activity of mTORC1 and mTORC2 and controls cellular size. Mol Cell 42, 50–61. [DOI] [PMC free article] [PubMed] [Google Scholar]
- Sakai NS, Samia‐Aly E, Barbera M and Fitzgerald RC (2013) A review of the current understanding and clinical utility of miRNAs in esophageal cancer. Sem Cancer Biol 23, 512–521. [DOI] [PubMed] [Google Scholar]
- Sarbassov DD, Guertin DA, Ali SM and Sabatini DM (2005) Phosphorylation and regulation of Akt/PKB by the rictor‐mTOR complex. Scienece 307, 1098–1101. [DOI] [PubMed] [Google Scholar]
- Schilsky RL (2010) Personalized medicine in oncology: the future is now. Nat Rev Drug Discov 9, 363. [DOI] [PubMed] [Google Scholar]
- Shen D‐W, Liang X‐J, Gawinowicz MA and Gottesman MM (2004) Identification of cytoskeletal [14C] carboplatin‐binding proteins reveals reduced expression and disorganization of actin and filamin in cisplatin‐resistant cell lines. Mol Pharmacol 66, 789–793. [DOI] [PubMed] [Google Scholar]
- Sirover MA (2012) Subcellular dynamics of multifunctional protein regulation: mechanisms of GAPDH intracellular translocation. J Cell Biochem 113, 2193–2200. [DOI] [PMC free article] [PubMed] [Google Scholar]
- Skvortsov S, Dudas J, Eichberger P, Witsch‐Baumgartner M, Loeffler‐Ragg J, Pritz C, Schartinger V, Maier H, Hall J and Debbage P (2014) Rac1 as a potential therapeutic target for chemo‐radioresistant head and neck squamous cell carcinomas (HNSCC). Br J Cancer 110, 2677. [DOI] [PMC free article] [PubMed] [Google Scholar]
- Slinker BK (1998) The statistics of synergism. J Mol Cell Cardiol 30, 723–731. [DOI] [PubMed] [Google Scholar]
- Song Q, Jiang D, Wang H, Huang J, Liu Y, Xu C and Hou Y (2017) Chromosomal and genomic variations in esophageal squamous cell carcinoma: a review of technologies, applications, and prospections. J Cancer 8, 2492–2500. [DOI] [PMC free article] [PubMed] [Google Scholar]
- Takashima A, Shirao K, Hirashima Y, Takahari D, Okita N, Akatsuka S, Nakajima TE, Matsubara J, Yasui H, Asakawa T et al (2008) Chemosensitivity of patients with recurrent esophageal cancer receiving perioperative chemotherapy. Dis Esophagus 21, 607–611. [DOI] [PubMed] [Google Scholar]
- Taniguchi K, Sugito N, Kumazaki M, Shinohara H, Yamada N, Matsuhashi N, Futamura M, Ito Y, Otsuki Y and Yoshida K (2015) Positive feedback of DDX6/c‐Myc/PTB1 regulated by miR‐124 contributes to maintenance of the Warburg effect in colon cancer cells. Biochim Biophys Acta 1852, 1971–1980. [DOI] [PubMed] [Google Scholar]
- Tristan C, Shahani N, Sedlak TW and Sawa A (2011) The diverse functions of GAPDH: views from different subcellular compartments. Cell Signal 23, 317–323. [DOI] [PMC free article] [PubMed] [Google Scholar]
- Ucker DS, Jain MR, Pattabiraman G, Palasiewicz K, Birge RB and Li H (2012) Externalized glycolytic enzymes are novel, conserved, and early biomarkers of apoptosis. J Biol Chem 287, 10325–10343. [DOI] [PMC free article] [PubMed] [Google Scholar]
- Um K, Niu S, Duman JG, Cheng JX, Tu Y‐K, Schwechter B, Liu F, Hiles L, Narayanan AS and Ash RT (2014) Dynamic control of excitatory synapse development by a Rac1 GEF/GAP regulatory complex. Dev Cell 29, 701–715. [DOI] [PMC free article] [PubMed] [Google Scholar]
- Wang C, Yan G, Zhang Y, Jia X and Bu P (2015) Long non‐coding RNA MEG3 suppresses migration and invasion of thyroid carcinoma by targeting of Rac1. Neoplasma 62, 541–549. [DOI] [PubMed] [Google Scholar]
- Wang J, Ge J, Zhang X‐H, Liu J‐Y, Yang C‐M and Zhao S‐L (2014) Endoscopic submucosal dissection versus endoscopic mucosal resection for the treatment of early esophageal carcinoma: a meta‐analysis. Asian Pac J Cancer Prev 15, 1803–1806. [DOI] [PubMed] [Google Scholar]
- Wu Z‐Y, Chen T, Zhao Q, Huang J‐H, Chen J‐X, Zheng C‐P, Xu X‐E, Wu J‐Y, Xu L‐Y and Li E‐M (2013) Altered expression of endogenous soluble vascular endothelial growth factor receptor‐2 is involved in the progression of esophageal squamous cell carcinoma. J Histochem Cytochem 61, 340–347. [DOI] [PMC free article] [PubMed] [Google Scholar]
- Xie H, Hanai J‐I, Ren J‐G, Kats L, Burgess K, Bhargava P, Signoretti S, Billiard J, Duffy KJ and Grant A (2014) Targeting lactate dehydrogenase‐a inhibits tumorigenesis and tumor progression in mouse models of lung cancer and impacts tumor‐initiating cells. Cell Metab 19, 795–809. [DOI] [PMC free article] [PubMed] [Google Scholar]
- Yu L, Gu C, Zhong D, Shi L, Kong Y, Zhou Z and Liu S (2014) Induction of autophagy counteracts the anticancer effect of cisplatin in human esophageal cancer cells with acquired drug resistance. Cancer Lett 355, 34–45. [DOI] [PubMed] [Google Scholar]
- Zhang F‐R, Tao L‐H, Shen Z‐Y, Lv Z, Xu L‐Y and Li E‐M (2008) Fascin expression in human embryonic, fetal, and normal adult tissue. J Histochem Cytochem 56, 193–199. [DOI] [PMC free article] [PubMed] [Google Scholar]
- Zhang H‐F, Chen Y, Wu C, Wu Z‐Y, Tweardy DJ, Alshareef A, Liao L‐D, Xue Y‐J, Wu J‐Y and Chen B (2016) The opposing function of STAT3 as an oncoprotein and tumor suppressor is dictated by the expression status of STAT3β in esophageal squamous cell carcinoma. Clin Cancer Res 22, 691–703. [DOI] [PubMed] [Google Scholar]
- Zhu G, Fan Z, Ding M, Zhang H, Mu L, Ding Y, Zhang Y, Jia B, Chen L, Chang Z et al. (2015) An EGFR/PI3K/AKT axis promotes accumulation of the Rac1‐GEF Tiam1 that is critical in EGFR‐driven tumorigenesis. Oncogene 34, 5971. [DOI] [PubMed] [Google Scholar]
- Zhu L, Du H, Shi M, Chen Z and Hang J (2013) ATG7 deficiency promote apoptotic death induced by cisplatin in human esophageal squamous cell carcinoma cells. Bull Cancer 100, E15–E21. [DOI] [PubMed] [Google Scholar]
- Zins K, Lucas T, Reichl P, Abraham D and Aharinejad S (2013) A Rac1/Cdc42 GTPase‐specific small molecule inhibitor suppresses growth of primary human prostate cancer xenografts and prolongs survival in mice. PLoS ONE 8, e74924. [DOI] [PMC free article] [PubMed] [Google Scholar]
- Zou H‐Y, Lv G‐Q, Dai L‐H, Zhan X‐H, Jiao J‐W, Liao L‐D, Zhou T‐M, Li C‐Q, Wu B‐L and Xu L‐Y (2016) A truncated splice variant of human lysyl oxidase‐like 2 promotes migration and invasion in esophageal squamous cell carcinoma. Int J Biochem Cell Biol 75, 85–98. [DOI] [PubMed] [Google Scholar]
Associated Data
This section collects any data citations, data availability statements, or supplementary materials included in this article.
Supplementary Materials
Fig. S1 . Combination therapy of cisplatin and RAC1 inhibitor suppresses chemoresistance to cisplatin in preventing ESCC cell proliferation.
Fig. S2 . RAC1 inhibitor EHop‐016 inhibits ESCC cell viability.
Fig. S3 . FOXO3a modulates the expression of glycolytic enzymes.
Table S1 . Characteristics of the ESCC patients.
Table S2 . The correlation between RAC1 and clinicopathological characteristics in ESCC (n = 106).
Table S3 . Primers used in this study.