

Abstract
Bladder cancer (BC) is the ninth most malignant tumor worldwide. Some BC patients will develop muscle‐invasive BC (MIBC), which has a 5‐year survival rate of approximately 60% due to metastasis. As such, there is an urgent need for novel therapeutic and diagnostic targets for MIBC. Analysis of novel antitumor microRNA (miRNA)‐mediated cancer networks is an effective strategy for exploring therapeutic targets and prognostic markers in cancers. Our previous miRNA analysis revealed that miR‐140‐5p acts as an antitumor miRNA in BC cells. Here, we investigated miR‐140‐5p regulation of BC molecular pathogenesis. Procollagen‐lysine, 2‐oxoglutarate 5‐dioxygenase 1 (PLOD1) was found to be directly regulated by miR‐140‐5p, and aberrant expression of PLOD1 was observed in BC clinical specimens. High PLOD1 expression was significantly associated with a poor prognosis (disease‐free survival: P = 0.0204; overall survival: P = 0.000174). Multivariate analysis showed PLOD1 expression to be an independent prognostic factor in BC patients (hazard ratio = 1.51, P = 0.0099). Furthermore, downregulation of PLOD1 by siRNAs and a specific inhibitor significantly decreased BC cell aggressiveness. Aberrant expression of PLOD1 was closely associated with BC pathogenesis. In summary, the present study showed that PLOD1 may be a potential prognostic marker and therapeutic target for BC.
Keywords: bladder cancer, inhibitor, microRNA, miR‐140‐5p, passenger strand, PLOD1
Abbreviations
- BC
bladder cancer
- GEO
Gene Expression Omnibus
- miRNA
microRNA
- PLOD1
procollagen‐lysine, 2‐oxoglutarate 5‐dioxygenase 1
- RISC
RNA‐induced silencing complex
- TCGA
The Cancer Genome Atlas
1. Introduction
Bladder cancer (BC) is the ninth most malignant tumor worldwide, and approximately 430 000 cases were newly diagnosed in 2012 (Antoni et al., 2017). BC is clinically divided into two groups: muscle‐invasive BC (MIBC) and non‐muscle‐invasive BC (NMIBC) (Lemke and Shah, 2018). Patients with the latter have a favorable prognosis (5‐year survival rate: approximately 90%) after surgical resection. However, approximately 50% of cases develop intravesical recurrence after surgical resection, and approximately 15–40% of recurrent BC cases are invasive and exhibit distant metastasis (Lemke and Shah, 2018). Although radical cystectomy and cisplatin‐based combination chemotherapy are the standard treatments for MIBC, the 5‐year survival rate of patients with MIBC is approximately 60% (Chou et al., 2016; Lemke and Shah, 2018). In addition, the survival of patients with distant metastasis is only 15 months due to no effective treatment options (Abufaraj et al., 2018). Therefore, discovery of novel therapeutic and diagnostic targets is urgently needed.
A vast number of studies have shown that a large number of noncoding RNAs encoded by the human genome are functional and play critical roles in various cellular processes, for example, cell growth, migration, invasion, and apoptosis (Bartel, 2004). microRNAs (miRNAs), a class of noncoding RNAs, are endogenous single‐stranded RNA molecules comprising 19–22 nucleotides that function as fine‐tuners of RNA expression (Bartel, 2009; Goto et al., 2015b; Koshizuka et al., 2017a; Kurozumi et al., 2017). A single miRNA regulates a vast number of RNA transcripts, and a bioinformatics study showed that approximately 60% of protein‐coding genes are controlled by miRNAs (Bartel, 2009). Aberrantly expressed miRNAs are closely associated with cancer pathogenesis via disruption of RNA networks within cancer cells (Beermann et al., 2016).
Using the knowledge that a single miRNA controls numerous genes, we sequentially identified novel cancer pathways regulated by antitumor miRNAs in several cancers (Goto et al., 2015a, 2017; Miyamoto et al., 2016). Identification of dysregulated miRNAs in cancer cells is the first step, and the latest RNA‐sequencing technology is suitable for producing miRNA signatures. Interestingly, analyses of our RNA‐sequencing‐based signatures revealed that the passenger strand of some miRNAs is up‐ or downregulated in cancer tissues (Goto et al., 2017; Koshizuka et al., 2017b). During miRNA biogenesis, the passenger strand of the miRNA duplex is degraded and does not play a role in gene regulation in cells (Mah et al., 2010). Our recent studies revealed that the passenger strand of certain miRNAs (e.g., miR‐99a‐3p, miR‐144‐5p, miR‐145‐3p, miR‐455‐5p, and miR‐223‐5p) acts as an antitumor miRNA by targeting several oncogenic genes closely involved in cancer pathogenesis (Arai et al., 2018a,2018b; Goto et al., 2017; Matsushita et al., 2015; Sugawara et al., 2018; Yamada et al., 2018a,2018b).
Based on the miRNA signature of BC, we focused on miR‐140‐5p (the passenger strand of the miR‐140‐duplex) to investigate the function of miR‐140‐5p and identify its target oncogenes as therapeutic and diagnostic targets for BC. Our data showed that procollagen‐lysine, 2‐oxoglutarate 5‐dioxygenase 1 (PLOD1) is directly regulated by miR‐140‐5p in BC cells. Aberrant expression of PLOD1 was closely associated with BC pathogenesis. Notably, inhibition of PLOD1 by transfection of siRNA or a PLOD1 inhibitor significantly attenuated the malignant phenotype of BC cells.
2. Materials and methods
2.1. Clinical specimen collection and cell culture
We obtained 15 BC tissues and normal adjacent tissues from patients undergoing total cystectomy at Chiba University Hospital between 2014 and 2015 (Table S1). All patients provided informed written consent forms, and the study protocol was approved by the Institutional Review Board of Chiba University (number: 484). The study methodologies conformed to the standards set by the Declaration of Helsinki. We used the human BC cell lines T24 and BOY. These cell lines were cultured in RPMI 1640 Medium supplemented with 10% fetal bovine serum (HyClone, Logan, UT, USA) as described previously (Yamada et al., 2018d).
2.2. Transfection of mature miRNAs, siRNAs, and plasmid vectors
We used the following agents in this study: the precursor sequences of hsa‐miR‐140‐5p and hsa‐miR‐140‐3p (assay IDs: PM10205 and PM12503, respectively; Applied Biosystems, Foster City, CA, USA), negative control miRNA (miR‐control) (assay ID: AM 17111; Applied Biosystems), and PLOD1‐specific siRNA (si‐PLOD1) (Stealth Select RNAi siRNA, P/N: HSS108122 and HSS108123; Invitrogen, Carlsbad, CA, USA). A plasmid vector containing PLOD1 was provided by OriGene (cat. no. SC119956; Rockville, MD, USA). Transfection of the agents into cells was performed using previously described procedures (Yamada et al., 2018c). miRNAs and siRNAs were incubated with 10 nm Lipofectamine RNAiMax transfection reagent (Invitrogen) diluted in Opti‐MEM (Invitrogen). Plasmid vectors were incubated with Lipofectamine 3000 reagent (Invitrogen) in Opti‐MEM for forward transfection.
2.3. PLOD1 inhibitor studies
We used 2,2′‐dipyridyl (07‐5990; Sigma‐Aldrich, St. Louis, MO, USA), previously reported to be a small‐molecule PLOD1 inhibitor, to inhibit PLOD1 in in vitro assays (Jover et al., 2018).
2.4. Quantitative reverse transcription–polymerase chain reaction (qRT‐PCR)
TaqMan probes and primers specific to PLOD1 (P/N: Hs00609363_m1; Applied Biosystems), which are assay‐on‐demand gene expression products, were used to analyze PLOD1 expression. miR‐140‐5p (P/N:001187; Applied Biosystems) and miR‐140‐3p (P/N:002234; Applied Biosystems) expression was analyzed by qRT‐PCR. mRNA and miRNA expression levels were normalized to those of GUSB (P/N: Hs99999908_m1; Applied Biosystems) and RNU48 (assay ID: 001006; Applied Biosystems). PCR quantification was performed as described previously (Yamada et al., 2018d).
2.5. Cell proliferation, migration, and invasion assays
Cell proliferation was evaluated by the XTT assay using the Cell Proliferation Kit II (Sigma‐Aldrich). Cell migration was assessed by wound healing assays, and invasion was determined using modified Boyden chambers containing Matrigel‐coated Transwell membrane filter inserts.
2.6. Cell‐cycle assay
Bladder cancer cells were transiently transfected with either the transfection reagent only as the control or the 2,2′‐dipyridyl, PLOD1 inhibitor, in six‐well tissue culture plates. Cells were harvested by trypsinization 72 h after transfection. For cell‐cycle analysis, cells were stained with propidium iodide using the Cycletest Plus DNA Reagent Kit (BD Biosciences, Bedford, MA, USA) according to the manufacturer's instructions and examined using the CyAn ADP Analyzer (Beckman Coulter, Brea, CA, USA). The percentages of cells in the G0/G1, S, and G2/M phases were calculated and compared. Experiments were performed in triplicate (Matsushita et al., 2015).
2.7. Apoptosis assays
Apoptotic cells were detected using the FITC Annexin V Apoptosis Detection Kit (BD Biosciences) according to the manufacturer's instructions and the BD FACSCelesta Flow Cytometer (BD Biosciences). Cells were identified as viable, dead, or early or late apoptotic cells, and the percentages of apoptotic cells under each experimental condition were compared. Anti‐poly (ADP‐ribose) polymerase (PARP) (#9542; Cell Signaling Technology, Danvers, MA, USA) was evaluated as a marker of apoptosis in this study (Idichi et al., 2018).
2.8. Western blotting
Western blotting was performed using a polyclonal anti‐PLOD1 antibody (1:1000 dilution; SAB1301577; Sigma‐Aldrich) and an anti‐glyceraldehyde 3‐phosphate dehydrogenase (GAPDH) antibody (1:10 000 dilution; ab8245; Abcam, Cambridge, UK) as a control (Fukumoto et al., 2014, 2015).
2.9. miR‐140‐5p and miR‐140‐3p localization within the RNA‐induced silencing complex (RISC) using Ago2 immunoprecipitation
T24 cells were transfected with 10 nm miRNA by reverse transfection. After 72 h, immunoprecipitation of the RISC was performed using the Ago2 miRNA isolation kit (Wako, Osaka, Japan). The expression levels of miR‐140‐5p and miR‐140‐3p in the immunoprecipitates were analyzed by qRT‐PCR. miRNA expression levels were normalized to that of miR‐26a (P/N: 000405; Applied Biosystems), which was not affected by miR‐140‐5p or miR‐140‐3p transfection.
2.10. Identification of candidate target genes regulated by miR‐140
To identify candidate target genes regulated by miR‐140‐5p and miR‐140‐3p, we used a combination of in silico and genome‐wide gene expression analyses. Genes potentially regulated by miRNAs in a sequence‐dependent manner are listed in the TargetScan database (release 7.2) (http://www.targetscan.org/vert_70/). Genes upregulated in BC were identified from a publicly available dataset in the Gene Expression Omnibus (GEO; accession number: GSE31684), and we narrowed down the list of candidate genes. Gene expression was also analyzed by our own oligonucleotide microarray analyses (Human GE 60K; Agilent Technologies), the data of which were deposited into the GEO (on June 14, 2018; http://www.ncbi.nlm.nih.gov/geo/) under accession number GSE115800.
2.11. Dual‐luciferase reporter assay
The wild‐type sequence of the PLOD1 3′‐untranslated region (UTR) was inserted between the SgfI and PmeI restriction sites of the 3′‐UTR of the hRluc gene within the psiCHECK‐2 vector (C8021; Promega, Madison, WI, USA). We also generated PLOD1 3′‐UTR sequences containing deletions in the miR‐140‐5p target sites (positions 43–49 and 725–731) for insertion into the psiCHECK‐2 vector as described above. The psiCHECK‐2 vector was used as a cloning vector for the synthesized DNA sequences.
2.12. Immunohistochemistry
Immunohistochemistry procedures were performed according to a previously described method. Clinical tissue sections were incubated overnight at 4 °C with an anti‐PLOD1 antibody diluted 1:10 (SAB1301577; Sigma‐Aldrich).
2.13. Analysis of genes downstream of PLOD1
To investigate PLOD1‐regulated pathways in BC cells, we assessed gene expression changes in T24 and BOY cells transfected with the PLOD1 inhibitor. Microarray analysis was performed to obtain expression profiles in these cells, and the microarray data were deposited into the GEO (on December 4, 2018; accession number: GSE123318).
2.14. Analysis of the clinical significance of PLOD1 expression
We investigated the clinical importance of miRNAs and genes in BC patients using RNA‐sequencing data available in The Cancer Genome Atlas (TCGA; https://tcga-data.nci.nih.gov/tcga/). The gene expression and clinical data were obtained from cBioPortal (http://www.bioportal.org/), and provisional data were downloaded on October 5, 2018 (Anaya, 2016; Cerami et al., 2012; Gao et al., 2013).
2.15. Statistical analysis
Statistical comparisons involving two or three variables were performed using the Bonferroni‐adjusted Mann–Whitney U‐test. Spearman's rank tests were used to analyze the correlations among gene expression levels. These analyses were conducted using expert statview software (version 5.0, SAS Institute Inc., Cary, NC, USA). Multivariate analysis of prognostic factors for patient survival was conducted using jmp pro 13 (SAS Institute Inc.).
3. Results
3.1. Expression of miR‐140‐5p and miR‐140‐3p in BC tissues
hsa‐miR‐140 is located on chromosome 16q22.1 in humans. The mature sequences of miR‐140‐5p and miR‐140‐3p are 5′‐CAGUGGUUUUACCCUAUGGUAG‐3′ and 5′‐UACCACAGGGUAGAACCACGG‐3′, respectively. The expression levels of miR‐140‐5p and miR‐140‐3p were significantly downregulated in BC tissues compared with adjacent normal tissues (P = 0.0013 and P = 0.0004, respectively; Fig. 1A,B). Moreover, Spearman's rank test revealed a strong positive correlation between miR‐140‐5p and miR‐140‐3p expression levels (R = 0.637, P = 0.0006; Fig. 1C).
Figure 1.
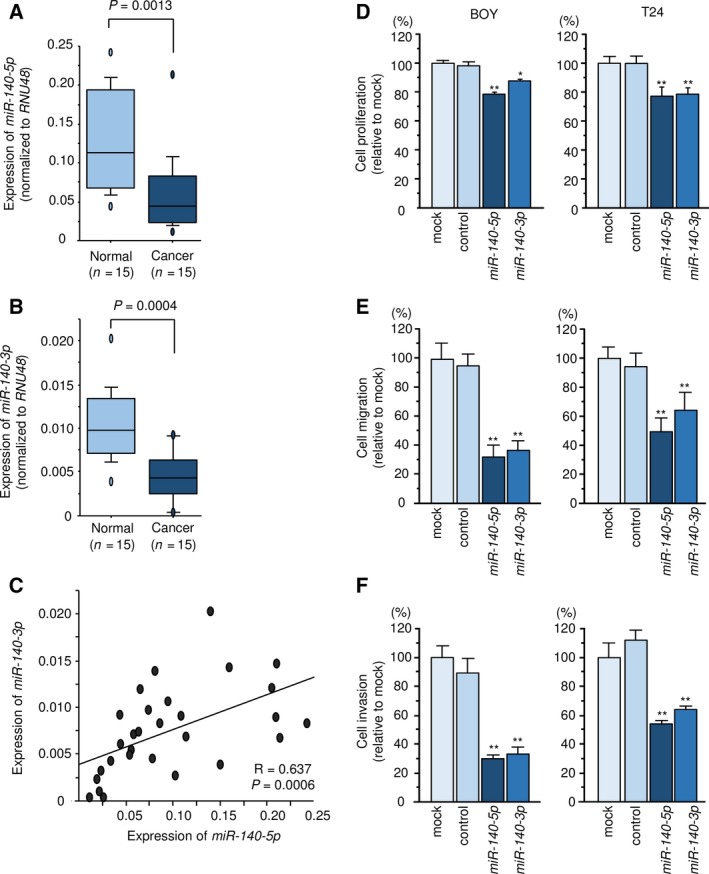
miR‐140 expression and antitumor functions in BC. (A–C) Expression levels of miR‐140‐5p and miR‐140‐3p in BC clinical specimens (P = 0.0013 and P = 0.0004, respectively). RNU48 was used as an internal control. P‐values were calculated using Bonferroni‐adjusted Mann–Whitney U‐test. A positive correlation between miR‐140‐5p and miR‐140‐3p expression levels was detected by Spearman's rank test (R = 0.637, P = 0.0006). (D–F) Cell proliferation, migration, and invasion activities. Error bars are represented as mean ± SD (n = 5, n = 8, and n = 8, respectively). P‐values were calculated using Bonferroni‐adjusted Mann–Whitney U‐test. *P < 0.001, **P < 0.0001.
3.2. Effect of miR‐140‐5p and miR‐140‐3p on the proliferation, migration, and invasion of BC cells
Restoration of miR‐140‐5p and miR‐140‐3p significantly suppressed BC cell proliferation, migration, and invasion abilities (Fig. 1D–F).
3.3. Effect of miR‐140‐5p and miR‐140‐3p on apoptosis and cell‐cycle assays in BOY cells
The percentage of apoptotic cells was significantly increased in miR‐140‐5p‐ and miR‐140‐3p‐transfected cells compared with the control cells (Fig. S1A,B). Moreover, transfection of miR‐140‐5p and miR‐140‐3p upregulated the level of cleaved PARP (Fig. S1C). In a cell‐cycle analysis, the proportion of cells in the G0/G1 phase was significantly higher transfected with miR‐140‐5p compared with the control cells (Fig. S1D).
3.4. miR‐140‐5p and miR‐140‐3p localization within the RISC
We performed immunoprecipitation assays using antibodies targeting Ago2, which plays a pivotal role in the uptake of miRNAs into the RISC. After transfection of T24 cells with miR‐140‐5p and immunoprecipitation using anti‐Ago2 antibodies, miR‐140‐5p levels in the immunoprecipitates were significantly higher than those in the immunoprecipitates from mock‐ or miR‐control‐transfected cells as well as miR‐140‐3p‐transfected cells (P < 0.0001; Fig. S2A). Similarly, after miR‐140‐3p transfection, substantial levels of miR‐140‐3p were detected in Ago2 immunoprecipitates compared with the controls (P < 0.0001; Fig. S2B).
3.5. Candidate target genes of miR‐140‐5p and miR‐140‐3p in BC cells
We identified genes containing putative target sites for miR‐140‐5p and miR‐140‐3p within their 3′‐UTR sequence that also showed upregulated expression levels (log2 > 0.5) in BC tissues and downregulated expression levels (log2 < −0.5) in T24 cells transfected with miR‐140‐5p or miR‐140‐3p (Fig. 2A). Using this strategy, we identified 31 and 33 genes as candidate target genes of miR‐140‐5p and miR‐140‐3p, respectively (Table 1A and 1B). Among these genes, we focused on PLOD1, which was found to be a target of the miR‐140‐5p passenger strand.
Figure 2.
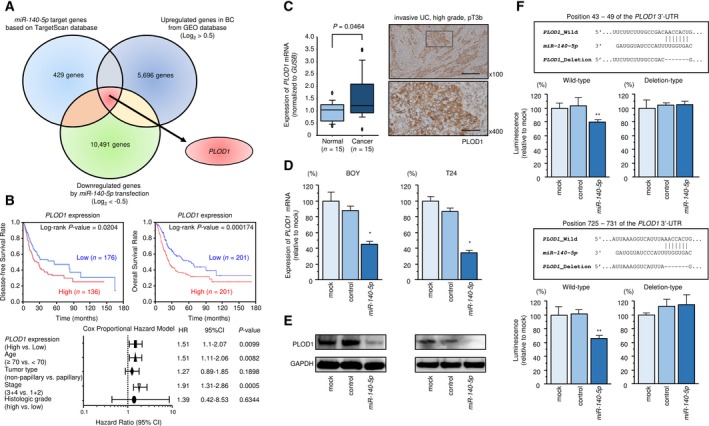
Clinical significance, expression, and regulation of PLOD1. (A) The strategy used to identify miR‐140‐5p candidate target genes, represented by a Venn diagram. (B) Clinical significance of PLOD1. (C) PLOD1 mRNA and protein expression in BC tissues. Scale bars of ×100 and ×400 represent 200 and 50 μm, respectively. P‐values were calculated using Bonferroni‐adjusted Mann–Whitney U‐test. (D) PLOD1 mRNA expression levels 48 h after transfection of BC cells with 10 nm miR‐140‐5p. GAPDH was used as the internal control gene. Error bars are represented as mean ± SD (n = 3). P‐values were calculated using Bonferroni‐adjusted Mann–Whitney U‐test. (E) PLOD1 protein expression 72 h after transfection with 10 nm miR‐140‐5p. GAPDH was used as the loading control. (F) Dual‐luciferase reporter assays using vectors encoding the wild‐type PLOD1 3′‐UTR sequence containing two putative miR‐140‐5p target sites and 3′‐UTR sequences with deletions of the target sites (Deletion). Normalized data were calculated as the ratio of Renilla/Firefly luciferase activities. Error bars are represented as mean ± SD (n = 3). P‐values were calculated using Bonferroni‐adjusted Mann–Whitney U‐test. *P < 0.0001, **P < 0.005.
Table 1.
Candidate target genes of miR‐140‐5p and miR‐140‐3p in BC.
| Gene symbol | Gene name | Entrez gene ID | Cytoband | GEO expression data fold change (tumor/normal) | miR‐140‐5p transfection in T24 (Log2 ratio) | Total binding sites | TCGA analysis for OS (high vs low expression: P value) |
|---|---|---|---|---|---|---|---|
| (A) miR‐140‐5p | |||||||
| CERCAM | Cerebral endothelial cell adhesion molecule | 51148 | hs|9q34.11 | 1.928 | −1.801 | 1 | 7.35E‐05 |
| PLOD1 | Procollagen‐lysine, 2‐oxoglutarate 5‐dioxygenase 1 | 5351 | hs|1p36.22 | 2.150 | −1.587 | 2 | 0.000174 |
| FADS1 | Fatty acid desaturase 1 | 3992 | hs|11q12.2 | 1.741 | −1.533 | 4 | 0.000384 |
| PAFAH1B2 | Platelet‐activating factor acetylhydrolase 1b, catalytic subunit 2 (30 kDa) | 5049 | hs|11q23.3 | 1.464 | −0.595 | 1 | 0.0169 |
| PAX6 | Paired box 6 | 5080 | hs|11p13 | 5.729 | −0.550 | 1 | 0.0281 |
| TNN | Tenascin N | 63923 | hs|1q25.1 | 2.521 | −0.514 | 1 | 0.0622 |
| HDAC7 | Histone deacetylase 7 | 51564 | hs|12q13.11 | 1.766 | −0.750 | 1 | 0.0858 |
| BMP2K | BMP2‐inducible kinase | 55589 | hs|4q21.21 | 2.025 | −0.731 | 2 | 0.134 |
| PSRC1 | Proline/serine‐rich coiled‐coil 1 | 84722 | hs|1p13.3 | 4.470 | −0.655 | 1 | 0.157 |
| ZNF74 | Zinc finger protein 74 | 7625 | hs|22q11.21 | 1.822 | −0.508 | 1 | 0.211 |
| SOX4 | SRY (sex‐determining region Y)‐box 4 | 6659 | hs|6p22.3 | 2.715 | −0.816 | 1 | 0.256 |
| FRAS1 | Fraser extracellular matrix complex subunit 1 | 80144 | hs|4q21.21 | 3.262 | −1.122 | 1 | 0.297 |
| TSC22D2 | TSC22 domain family, member 2 | 9819 | hs|3q25.1 | 1.520 | −0.918 | 1 | 0.318 |
| GIT1 | G protein‐coupled receptor kinase interacting ArfGAP 1 | 28964 | hs|17q11.2 | 3.992 | −1.293 | 1 | 0.367 |
| YES1 | YES proto‐oncogene 1, Src family tyrosine kinase | 7525 | hs|18p11.32 | 1.734 | −0.894 | 1 | 0.375 |
| MMD | Monocyte to macrophage differentiation‐associated | 23531 | hs|17q22 | 2.736 | −1.027 | 2 | 0.401 |
| SLC6A6 | Solute carrier family 6 (neurotransmitter transporter), member 6 | 6533 | hs|3p25.1 | 1.781 | −1.153 | 2 | 0.443 |
| FEN1 | Flap structure‐specific endonuclease 1 | 2237 | hs|11q12.2 | 4.028 | −0.941 | 1 | 0.446 |
| RALA | v‐ral simian leukemia viral oncogene homolog A (ras related) | 5898 | hs|7p14.1 | 1.786 | −2.318 | 1 | 0.462 |
| TTYH3 | Tweety family member 3 | 80727 | hs|7p22.3 | 3.114 | −1.493 | 2 | 0.61 |
| ZNF710 | Zinc finger protein 710 | 374655 | hs|15q26.1 | 1.642 | −0.501 | 1 | 0.649 |
| TTK | TTK protein kinase | 7272 | hs|6q14.1 | 43.335 | −0.520 | 2 | 0.686 |
| BCL2L1 | BCL2‐like 1 | 598 | hs|20q11.21 | 2.118 | −0.689 | 1 | 0.841 |
| PTP4A3 | Protein tyrosine phosphatase type IVA, member 3 | 11156 | hs|8q24.3 | 2.455 | −1.177 | 1 | 0.85 |
| RABIF | RAB interacting factor | 5877 | hs|1q32.1 | 1.435 | −0.871 | 1 | 0.889 |
| WASF1 | WAS protein family, member 1 | 8936 | hs|6q21 | 2.068 | −0.808 | 1 | 0.895 |
| ACSL6 | Acyl‐CoA synthetase long‐chain family member 6 | 23305 | hs|5q31.1 | 1.995 | −0.505 | 2 | 0.939 |
| LMNB1 | Lamin B1 | 4001 | hs|5q23.2 | 10.537 | −0.958 | 1 | 0.943 |
| C6orf47 | Chromosome 6 open reading frame 47 | 57827 | hs|6p21.33 | 1.692 | −1.018 | 1 | 0.0134a |
| PROX2 | Prospero homeobox 2 | 283571 | hs|14q24.3 | 5.328 | −0.513 | 1 | No data |
| NT5C1A | 5′‐nucleotidase, cytosolic IA | 84618 | hs|1p34.2 | 5.445 | −1.145 | 1 | No data |
| (B) miR‐140‐3p | |||||||
| ADAM17 | ADAM metallopeptidase domain 17 | 6868 | hs|2p25.1 | 2.062 | −0.552 | 1 | 0.0033 |
| CCDC103 | Coiled‐coil domain containing 103 | 388389 | hs|17q21.31 | 2.621 | −2.588 | 2 | 0.0471 |
| PLXNA4 | Plexin A4 | 91584 | hs|7q32.3 | 2.195 | −0.639 | 1 | 0.0487 |
| THPO | Thrombopoietin | 7066 | hs|3q27.1 | 3.383 | −0.615 | 1 | 0.0611 |
| NR4A3 | Nuclear receptor subfamily 4, group A, member 3 | 8013 | hs|9q22.33 | 5.420 | −0.693 | 1 | 0.0904 |
| AEN | Apoptosis‐enhancing nuclease | 64782 | hs|15q26.1 | 3.713 | −0.602 | 1 | 0.101 |
| DBNL | Drebrin‐like | 28988 | hs|7p13 | 2.543 | −0.585 | 3 | 0.132 |
| GABRB2 | Gamma‐aminobutyric acid (GABA) A receptor, beta 2 | 2561 | hs|5q34 | 1.944 | −0.641 | 1 | 0.143 |
| FAM53B | Family with sequence similarity 53, member B | 9679 | hs|10q26.13 | 1.880 | −0.669 | 4 | 0.165 |
| COL7A1 | Collagen, type VII, alpha 1 | 1294 | hs|3p21.31 | 2.370 | −0.831 | 1 | 0.211 |
| SIRPA | Signal‐regulatory protein alpha | 140885 | hs|20p13 | 1.573 | −0.509 | 1 | 0.236 |
| ABCA12 | ATP‐binding cassette, subfamily A (ABC1), member 12 | 26154 | hs|2q35 | 13.439 | −0.505 | 1 | 0.271 |
| KCNK17 | Potassium channel, two‐pore domain subfamily K, member 17 | 89822 | hs|6p21.2 | 1.633 | −0.683 | 1 | 0.332 |
| KCTD16 | Potassium channel tetramerization domain containing 16 | 57528 | hs|5q31.3 | 2.808 | −0.702 | 2 | 0.431 |
| DAND5 | DAN domain family member 5, BMP antagonist | 199699 | hs|19p13.2 | 2.449 | −0.529 | 1 | 0.481 |
| KIF5A | Kinesin family member 5A | 3798 | hs|12q13.3 | 2.610 | −0.691 | 4 | 0.592 |
| NUDT18 | Nudix (nucleoside diphosphate linked moiety X)‐type motif 18 | 79873 | hs|8p21.3 | 2.690 | −0.657 | 1 | 0.653 |
| SLC17A9 | Solute carrier family 17 (vesicular nucleotide transporter), member 9 | 63910 | hs|20q13.33 | 1.976 | −1.701 | 4 | 0.737 |
| HMGCS1 | 3‐hydroxy‐3‐methylglutaryl‐CoA synthase 1 (soluble) | 3157 | hs|5p12 | 1.971 | −1.187 | 2 | 0.808 |
| SNX22 | Sorting nexin 22 | 79856 | hs|15q22.31 | 2.226 | −0.676 | 2 | 0.861 |
| WDR55 | WD repeat domain 55 | 54853 | hs|5q31.3 | 1.736 | −0.646 | 1 | 0.942 |
| SRCIN1 | SRC kinase signaling inhibitor 1 | 80725 | hs|17q12 | 3.306 | −0.685 | 3 | 0.000248a |
| BAI2 | Brain‐specific angiogenesis inhibitor 2 | 576 | hs|1p35.2 | 1.864 | −0.724 | 1 | No data |
| VGLL2 | Vestigial‐like family member 2 | 245806 | hs|6q22.1 | 2.171 | −0.670 | 1 | No data |
| NOL4 | Nucleolar protein 4 | 8715 | hs|18q12.1 | 2.633 | −1.014 | 1 | No data |
| MOBP | Myelin‐associated oligodendrocyte basic protein | 4336 | hs|3p22.1 | 2.795 | −0.676 | 1 | No data |
| CYLC1 | Cylicin, basic protein of sperm head cytoskeleton 1 | 1538 | hs|Xq21.1 | 3.014 | −0.616 | 1 | No data |
| ELAVL3 | ELAV‐like neuron‐specific RNA‐binding protein 3 | 1995 | hs|19p13.2 | 3.171 | −0.656 | 1 | No data |
| SCN1A | Sodium channel, voltage‐gated, type I alpha subunit | 6323 | hs|2q24.3 | 3.609 | −0.674 | 1 | No data |
| PAX7 | Paired box 7 | 5081 | hs|1p36.13 | 3.899 | −0.653 | 1 | No data |
| KCNK10 | Potassium channel, two‐pore domain subfamily K, member 10 | 54207 | hs|14q31.3 | 3.933 | −0.679 | 1 | No data |
| SVOP | SV2‐related protein homolog (rat) | 55530 | hs|12q24.11 | 4.259 | −0.670 | 1 | No data |
| CAMKV | CaM kinase‐like vesicle‐associated | 79012 | hs|3p21.31 | 4.507 | −1.615 | 4 | No data |
Poor prognosis in patients with low expression.
3.6. Clinical significance and expression of PLOD1
Clinical data from BC patients were obtained from TCGA database, and information on survival revealed that patients with high PLOD1 expression had a significantly poorer prognosis compared with patients with low expression (disease‐free survival: P = 0.0204; overall survival: P = 0.000174; Fig. 2B). High PLOD1 expression was also related to a highly malignant tumor morphology, advanced stage, and metastasis (Fig. S3A). According to multivariate Cox proportional hazards regression, high expression of PLOD1 was an independent predictive factor for overall survival in BC patients (hazard ratio: 1.51; 95% confidence interval: 1.1–2.07, P = 0.0099) (Fig. 2B). PLOD1 mRNA expression levels were significantly upregulated in BC tissues compared with normal adjacent tissues (P = 0.0464) (Fig. 2C). Immunostaining of PLOD1 in BC clinical specimens indicated high expression of PLOD1 in cancer lesions compared with adjacent noncancerous tissues at the same staining intensity (Fig. 2C).
In addition, expression levels of PLOD2 and PLOD3 were detected in BC clinical specimens (Fig. S4A,B). Also, immunohistochemical staining showed that overexpressed PLOD2 and PLOD3 were detected in cancer lesions (Fig. S4G,H). Interestingly, high expression of PLOD2 was significantly associated with poor prognosis of the patients with BC (Fig. S3B). Among PLOD family, expression of PLOD1 was the highest in BC tissues (Fig. S4C). Clinicopathological analysis was performed between PLODs expression and BC (NMIBC or MIBC) clinical specimens. However, no significant association was found in this study (Fig. S4D–F).
3.7. PLOD1 was directly regulated by miR‐140‐5p
PLOD1 mRNA and protein levels were significantly decreased in T24 and BOY cells following transfection with miR‐140‐5p compared with mock‐transfected cells or those transfected with miR‐control (Fig. 2D,E). The TargetScan database indicated the presence of two miR‐140‐5p binding sites (positions 43–49 and 725–731) within the PLOD1 3′‐UTR. We performed luciferase reporter assays using a vector containing these sequences to assess whether miR‐140‐5p directly regulates PLOD1 expression in a sequence‐dependent manner. Cotransfection of miR‐140‐5p with vectors harboring the PLOD1 3′‐UTR deletion constructs significantly decreased luciferase activity compared with the activity levels in mock‐transfected and miR‐control‐transfected cells (Fig. 2F).
3.8. Knockdown and rescue studies of PLOD1
We confirmed that both PLOD1 mRNA and protein expression levels were suppressed by siRNA‐mediated PLOD1 knockdown in BC cells (Fig. 3A and B). Transfection of si‐PLOD1 suppressed cell proliferation, migration, and invasion activities (Fig 3C–E). The percentage of apoptotic cells was significantly increased in si‐PLOD1‐transfected cells compared with the control cells (Fig. S5A,B). Moreover, transfection of si‐PLOD1 upregulated the level of cleaved PARP (Fig. S5C). In a cell‐cycle analysis, the proportion of cells in the G0/G1 phase was significantly higher, transfected with si‐PLOD1_2 compared with the control cells, although G2/M phase was significantly elevated in si‐PLOD1_1 transfection (Fig. S5D).
Figure 3.
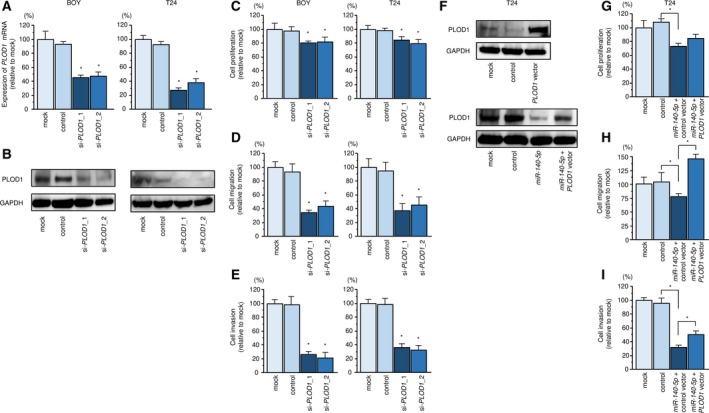
Knockdown and rescue studies of PLOD1. (A, B) PLOD1 mRNA and protein expression 72 h after transfection of si‐PLOD1_1 or si‐PLOD1_2 in BC cell lines. GAPDH was used as the control. Error bars are represented as mean ± SD (n = 3). P‐values were calculated using Bonferroni‐adjusted Mann–Whitney U‐test. (C) Cell proliferation, (D) migration, and (E) invasion activities in BC cells. Error bars are represented as mean ± SD (n = 5, n = 8, and n = 8, respectively). P‐values were calculated using Bonferroni‐adjusted Mann–Whitney U‐test. (F) PLOD1 protein expression was evaluated 72 h after reverse transfection of miR‐140‐5p and 48 h after forward transfection of PLOD1. GAPDH was used as the loading control. (G) Cell proliferation assay performed 72 h after reverse transfection of miR‐140‐5p and 48 h after forward transfection of PLOD1. (H) Cell migration assay performed 48 h after reverse transfection of miR‐140‐5p and 24 h after forward transfection of PLOD1. (I) Cell invasion assay performed 48 h after reverse transfection of miR‐140‐5p and 24 h after forward transfection of PLOD1. Error bars are represented as mean ± SD (n = 5, n = 8, and n = 8, respectively). P‐values were calculated using Bonferroni‐adjusted Mann–Whitney U‐test. *P < 0.0001.
In addition, we performed a PLOD1 rescue study in T24 cells to validate whether oncogenic pathways regulated by PLOD1/miR‐140‐5p are crucial for BC development. PLOD1 and miR‐140‐5p transfection restored PLOD1 protein expression (Fig. 3F). Functional assays demonstrated that BC cell migration and invasion were significantly recovered by PLOD1 and miR‐140‐5p transfection compared with miR‐140‐5p alone (Fig. 3G–I).
3.9. Functional analysis of a PLOD1 inhibitor
After transfection of the PLOD1 inhibitor 2,2′‐dipyridyl into BC cells, cell proliferation was suppressed in a dose‐dependent manner (Fig. 4A). The IC50 of 2,2′‐dipyridyl was 82.8 μm in BOY cells and 37.1 μm in T24 cells. Cell migration and invasion were also decreased in a dose‐dependent manner in cells transfected with the inhibitor (Fig. S6). In addition, the percentage of apoptotic cells was increased in PLOD1 inhibitor‐transfected cells compared with the control cells (Fig. 4B). Moreover, transfection of PLOD1 inhibitor upregulated the level of cleaved PARP (Fig. 4B). In a cell‐cycle analysis, the proportion of cells in the G0/G1 phase was significantly higher in BC cells transfected with the PLOD1 inhibitor compared with the control cells (Fig. 4C). In addition, we confirmed that the inhibitor suppressed the mRNA and protein levels of PLOD1 in a dose‐dependent manner (Fig. S7). Apoptosis and cell‐cycle experiments gave similar results in BOY cells (Fig. S8).
Figure 4.
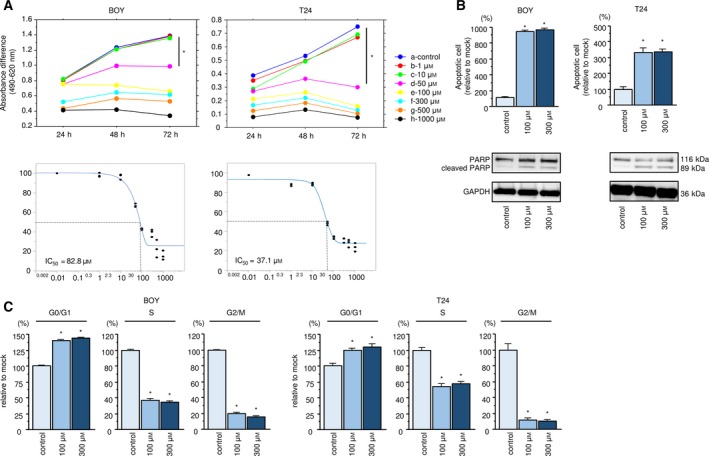
Functional analysis of a PLOD1 inhibitor. (A) Cell proliferation assay of BC cells transfected with an inhibitor of PLOD1 and the IC 50 values of the PLOD1 inhibitor. IC 50 values were calculated using jmp software. Error bars are represented as mean ± SD (n = 5). P‐values were calculated using Bonferroni‐adjusted Mann–Whitney U‐test. (B) Effect of the PLOD1 inhibitor on apoptosis, as assessed by apoptosis assays, and western blot analysis of cleaved PARP, as a marker of apoptosis. GAPDH was used as the loading control. Error bars are represented as mean ± SD (n = 3). P‐values were calculated using Bonferroni‐adjusted Mann–Whitney U‐test. (C) Effect of the PLOD1 inhibitor on the cell cycle. The bar charts represent the percentages of inhibitor‐transfected cells relative to the control cells in the G0/G1, S, and G2/M phases, respectively. Error bars are represented as mean ± SD (n = 3). P‐values were calculated using Bonferroni‐adjusted Mann–Whitney U‐test. *P < 0.0001.
3.10. Genes affected by the PLOD1 inhibitor
PLOD1 acts as lysyl hydroxylases that catalyze hydroxylation of collagen lysines, and it works under the following conditions, extracellular matrix maturation and remodeling. In order to explore the functional significance of PLOD1 on tumor progression, we examined the PLOD1‐mediated downstream genes and pathways. As shown in the Venn diagram in Fig. S9, 1518 genes were considerably downregulated after transfection of the PLOD1 inhibitor in BOY and T24 cells. In a KEGG analysis of these genes, we identified 39 pathways enriched among the PLOD1‐affected genes, including pathways related to cell cycle and apoptosis (Table 2).
Table 2.
Molecular pathways significantly enriched among the genes affected by PLOD1 inhibitor treatment in BC cells.
| Number of genes | Annotations | P‐value |
|---|---|---|
| 18 | (KEGG) 04110: Cell cycle | 2.37E‐05 |
| 28 | (KEGG) 05200: Pathways in cancer | 1.90E‐04 |
| 13 | (KEGG) 04512: ECM–receptor interaction | 2.36E‐04 |
| 15 | (KEGG) 04114: Oocyte meiosis | 3.29E‐04 |
| 7 | (KEGG) 00760: Nicotinate and nicotinamide metabolism | 4.73E‐04 |
| 13 | (KEGG) 05146: Amebiasis | 1.02E‐03 |
| 8 | (KEGG) 00310: Lysine degradation | 4.59E‐03 |
| 6 | (KEGG) 00410: Beta‐alanine metabolism | 4.74E‐03 |
| 15 | (KEGG) 00230: Purine metabolism | 5.32E‐03 |
| 6 | (KEGG) 00640: Propanoate metabolism | 1.00E‐02 |
| 10 | (KEGG) 04914: Progesterone‐mediated oocyte maturation | 1.06E‐02 |
| 10 | (KEGG) 04540: Gap junction | 1.06E‐02 |
| 6 | (KEGG) 03030: DNA replication | 1.21E‐02 |
| 9 | (KEGG) 04070: Phosphatidylinositol signaling system | 1.24E‐02 |
| 16 | (KEGG) 04510: Focal adhesion | 1.32E‐02 |
| 10 | (KEGG) 04916: Melanosis | 1.84E‐02 |
| 9 | (KEGG) 05222: Small‐cell lung cancer | 2.10E‐02 |
| 14 | (KEGG) 04020: Calcium signaling pathway | 2.26E‐02 |
| 11 | (KEGG) 04142: Lysosome | 2.34E‐02 |
| 4 | (KEGG) 00670: One carbon pool by folate | 2.51E‐02 |
| 9 | (KEGG) 05414: Dilated cardiomyopathy | 2.54E‐02 |
| 4 | (KEGG) 00100: Steroid biosynthesis | 2.58E‐02 |
| 6 | (KEGG) 00280: Valine, leucine, and isoleucine degradation | 2.68E‐02 |
| 6 | (KEGG) 04962: Vasopressin‐regulated water reabsorption | 2.68E‐02 |
| 14 | (KEGG) 04062: Chemokine signaling pathway | 2.73E‐02 |
| 8 | (KEGG) 04146: Peroxisome | 2.83E‐02 |
| 6 | (KEGG) 00561: Glycerolipid metabolism | 2.97E‐02 |
| 5 | (KEGG) 03410: Base excision repair | 3.06E‐02 |
| 11 | (KEGG) 04910: Insulin signaling pathway | 3.08E‐02 |
| 8 | (KEGG) 04974: Protein digestion and absorption | 3.08E‐02 |
| 6 | (KEGG) 04961: Endocrine and other factor‐regulated calcium reabsorption | 3.43E‐02 |
| 8 | (KEGG) 04350: TGF‐beta signaling pathway | 3.52E‐02 |
| 4 | (KEGG) 03430: Mismatch repair | 3.87E‐02 |
| 8 | (KEGG) 04210: Apoptosis | 4.40E‐02 |
| 6 | (KEGG) 00590: Arachidonic acid metabolism | 4.46E‐02 |
| 10 | (KEGG) 04724: Glutamatergic synapse | 4.46E‐02 |
| 4 | (KEGG) 00563: Glycosylphosphatidylinositol(GPI)‐anchor biosynthesis | 4.68E‐02 |
| 6 | (KEGG) 05217: Basal cell carcinoma | 4.91E‐02 |
| 4 | (KEGG) 03440: Homologous recombination | 4.98E‐02 |
BC, bladder cancer.
4. Discussion
RNA sequencing is a suitable technology for creating miRNA expression signatures in cancer cells. Analyses of our miRNA signatures in cancers revealed that the passenger strand of some miRNA duplexes is functional in cancer cells by targeting cancer‐related genes (Arai et al., 2018b; Goto et al., 2017; Matsushita et al., 2015; Sugawara et al., 2018; Yamada et al., 2018a,2018b). This makes it possible to identify novel cancer pathways based on aberrantly expressed passenger strand miRNAs.
In this study, we focused on both strands of pre‐miR‐140 (miR‐140‐5p and miR‐140‐3p) and revealed their antitumor functions in BC cells. Previous reports showed that miR‐140‐3p is downregulated in squamous cell lung cancer and functions as a tumor suppressor by targeting bromodomain containing 9 in vitro and in vivo (Huang et al., 2019). As with miR‐140‐3p, a tumor‐suppressive function of miR‐140‐5p has been reported in several cancers. miR‐140‐5p exerted a tumor‐suppressive function and enhanced the effect of existing therapeutic drugs in non‐small‐cell lung cancer (Flamini et al., 2017). Another report showed that miR‐140‐5p suppressed cell aggressiveness and suggested that miR‐140‐5p is a prognostic marker in gastric cancer (Fang et al., 2017). Downregulation of miRNAs was reported to be caused by epigenetic factors such as DNA methylation or histone deacetylation. Previous study showed that suppression of miR‐140 expression was influenced by the hypermethylation of the promoter region in breast cancer (Wolfson et al., 2014). Elucidation of the detailed molecular mechanism of downregulation of miR‐140‐5p and miR‐140‐3p is also essential in BC cells. These studies indicate that both strands of pre‐miR‐140 act as critical miRNAs that prevent malignant transformation in cells. To our knowledge, this is the first study to identify a functional role of the miR‐140 duplex and its oncogene targets in BC.
Our next focus was to investigate the molecular networks regulated by these miRNAs in BC cells. A total of 31 genes regulated by miR‐140‐5p and 33 genes regulated by miR‐140‐3p were identified as putative oncogenic targets in BC cells. Among these targets, the expression levels of eight genes (CERCAM, PLOD1, FADS1, PAFAH1B2, PAX6, ADAM17, CCDC103, and PLXNA4) were closely associated with BC pathogenesis. These genes are promising as therapeutic targets and prognostic markers, and further analysis is necessary to elucidate the molecular pathogenesis of BC. We focused on PLOD1 to investigate its oncogenic functions and clinical significance in BC. PLOD genes encode lysyl hydroxylases, which are crucial for collagen biosynthesis, cross‐linking, and deposition (Qi and Xu, 2018). Collagen is a major component of the extracellular matrix (ECM), and collagen cross‐linking is related to the stiffness of the ECM, which enhances cancer cell migration, invasion, and focal adhesion (Du et al., 2017; Peinado et al., 2008). The PLOD family consists of PLOD1, PLOD2, and PLOD3. A number of studies have demonstrated that overexpression of PLOD2 and PLOD3 promotes cancer progression and metastasis. Our previous studies showed that aberrant expression of PLOD2 was detected in BC and renal cell carcinoma tissues, and its overexpression enhanced cancer cell malignant transformation (Kurozumi et al., 2016; Miyamoto et al., 2016). We hypothesized that members of the PLOD family member are deeply involved in the molecular pathogenesis of BC. On the other hand, there are not many reports on the role of PLOD1 in cancer (Qi and Xu, 2018). Previous studies showed that aberrant expression of PLOD1 was significantly associated with shorter survival in patients with gastric or colorectal cancer (Wang et al., 2018). Overexpression of PLOD1 was also detected in esophageal squamous cell carcinoma and breast cancer (Gilkes et al., 2013; Li et al., 2017). Mutations in PLOD1 are the cause of PLOD1‐related kyphoscoliotic Ehlers–Danlos syndrome, an autosomal recessive generalized connective tissue disorder (Giunta et al., 2005).
The data from a large number of cohort analyses in TCGA database show that high expression of PLOD1 is significantly associated with a poor prognosis (overall survival: P = 0.000174), more strongly than are PLOD2 and PLOD3 (OS: P = 0.0097 and P = 0.315, respectively) (Fig. S3B,C). Furthermore, multivariate analysis showed that PLOD1 expression was an independent prognostic factor in patients with BC (hazard ratio = 1.51, P = 0.0099). Moreover, high expression of PLOD1 was significantly associated with tumor stage and presence of metastasis. Aberrant expression of PLOD1 has been shown to be closely related to the malignant phenotype of BC. Development of a new diagnostic strategy for BC using PLOD1 expression as a marker is desired.
Aberrant expression of PLOD1 was detected in BC clinical specimens, and inhibition of PLOD1 by siRNA‐mediated knockdown or treatment with a PLOD1 inhibitor significantly reduced the malignant phenotype of BC cells (e.g., decreases in proliferation, migration, and invasion and an increase in apoptosis). We used 2,2′‐dipyridyl, an iron chelator, as an inhibitor of PLOD1 in this study (Bernardes et al., 2018; Jover et al., 2018). Collagen lysyl hydroxylases reportedly depend on Fe2+ binding for stabilization, and 2,2′‐dipyridyl prevents prolyl and lysyl hydroxylation (Barsh and Byers, 1981; Guo et al., 2018). A previous report showed that inhibition of PLOD1 and lysyl oxidase suppressed arterial smooth muscle cell calcification via ECM remodeling (Jover et al., 2018). Another study was conducted to investigate the effect of 2,2′‐dipyridyl in combination with doxorubicin in breast cancer cells (Bernardes et al., 2018). In this study, we showed that PLOD1 expression and cell proliferation were suppressed after transfection of a PLOD1 inhibitor in a dose‐dependent manner. Moreover, the PLOD1 inhibitor induced apoptosis and cell‐cycle arrest at the G1‐to‐S phase transition.
The molecular mechanism of the antitumor effect of the PLOD1 inhibitor in BC cells was evaluated by global gene expression analysis. As a result, genes associated with cell cycle, ECM–receptor interactions, and apoptosis were differentially expressed in cells transfected with the PLOD1 inhibitor, supporting our current data. We focused on several genes (e.g., CCNB1, CCNB2, and SKP2) involved in ‘cell‐cycle pathway’. Expression of CCNB2 (cyclin B2) was upregulated in BC tissues, and suppression of its expression significantly inhibited invasive and metastatic abilities (Lei et al., 2016). Our recent study showed that CCNB1 (cyclin B1) was regulated by antitumor miR‐223‐5p in BC cells and its high expression was closely associated with poor prognosis of the patients with BC by TCGA database analysis (Sugawara et al., 2018). Moreover, overexpression of SKP2 (S‐phase kinase‐associated protein 2) was significantly related to advanced tumor stage and grade of the patients with BC (Kawakami et al., 2007).
Moreover, we performed rescue experiments by overexpressing PLOD1 and miR‐140‐5p. The results revealed that PLOD1 can counteract the antitumor effects, in terms of cell migration and invasion, of miR‐140‐5p in BC cells, indicating that the PLOD1/miR‐140‐5p axis plays an important role in BC development.
5. Conclusion
Both strands of the miR‐140 duplex (miR‐140‐5p and miR‐140‐3p) suppressed BC cell malignant transformation. Genes controlled by the miR‐140‐5p were found to be related to BC pathogenesis. PLOD1 expression was directly regulated by the miR‐140‐5p in BC cells. Aberrant expression of PLOD1 was closely contributed to BC development. Furthermore, inhibition of PLOD1 expression significantly attenuated to BC cell aggressive phenotypes. PLOD1 might be a novel biomarker and therapeutic target in BC. Further investigation is required for clinical application.
Conflict of interest
The authors declare no conflict of interest.
Author contributions
YY, NS, and TI designed the whole study and wrote the manuscript. MK, TA, HS, AU, SM, SS, and AK contributed to experimental design and data collection. All authors have agreed with the manuscript and provide their consent for publication.
Supporting information
Fig. S1. Effect of miR‐140‐5p and miR‐140‐3p on apoptosis and cell‐cycle assays in BOY cells.
Fig. S2. miR‐140‐5p and miR‐140‐3p localization within the RISC.
Fig. S3. Clinical database analysis of PLOD1, PLOD2 and PLOD3 expression in BC patients.
Fig. S4. Expression analysis of PLOD1, PLOD2 and PLOD3 in BC tissues.
Fig. S5. Effect of si‐PLOD1 on apoptosis and cell‐cycle assays in BOY cells.
Fig. S6. Effect of a PLOD1 inhibitor on the migration and invasion of BC cells.
Fig. S7. Effect of a PLOD1 inhibitor on PLOD1 expression.
Fig. S8. Effect of a PLOD1 inhibitor on apoptosis and cell‐cycle assays in BC cells.
Fig. S9. Downstream pathways affected by treatment with a PLOD1 inhibitor in BC cells.
Table S1. Background characteristics of the BC patients.
Acknowledgements
The present study was supported by KAKENHI grants 18K16685, 18K16724, 18K16723, 16H05462, and 18K09338.
Data accessibility
Data acquired during the course of this study are available in GEO: GSE115800 and GSE123318.
References
- Abufaraj M, Dalbagni G, Daneshmand S, Horenblas S, Kamat AM, Kanzaki R, Zlotta AR and Shariat SF (2018) The role of surgery in metastatic bladder cancer: a systematic review. Eur Urol 73, 543–557. [DOI] [PMC free article] [PubMed] [Google Scholar]
- Anaya J (2016) OncoLnc: linking TCGA survival data to mRNAs, miRNAs, and lncRNAs. PeerJ Comput Sci 2, e67. [Google Scholar]
- Antoni S, Ferlay J, Soerjomataram I, Znaor A, Jemal A and Bray F (2017) Bladder cancer incidence and mortality: a global overview and recent trends. Eur Urol 71, 96–108. [DOI] [PubMed] [Google Scholar]
- Arai T, Kojima S, Yamada Y, Sugawara S, Kato M, Yamazaki K, Naya Y, Ichikawa T and Seki N (2018a) Pirin: a potential novel therapeutic target for castration‐resistant prostate cancer regulated by miR‐455‐5p. Mol Oncol 13, 322–337. [DOI] [PMC free article] [PubMed] [Google Scholar]
- Arai T, Okato A, Yamada Y, Sugawara S, Kurozumi A, Kojima S, Yamazaki K, Naya Y, Ichikawa T and Seki N (2018b) Regulation of NCAPG by miR‐99a‐3p (passenger strand) inhibits cancer cell aggressiveness and is involved in CRPC. Cancer Med 7, 1988–2002. [DOI] [PMC free article] [PubMed] [Google Scholar]
- Barsh GS and Byers PH (1981) Reduced secretion of structurally abnormal type I procollagen in a form of osteogenesis imperfecta. Proc Natl Acad Sci USA 78, 5142–5146. [DOI] [PMC free article] [PubMed] [Google Scholar]
- Bartel DP (2004) MicroRNAs: genomics, biogenesis, mechanism, and function. Cell 116, 281–297. [DOI] [PubMed] [Google Scholar]
- Bartel DP (2009) MicroRNAs: target recognition and regulatory functions. Cell 136, 215–233. [DOI] [PMC free article] [PubMed] [Google Scholar]
- Beermann J, Piccoli MT, Viereck J and Thum T (2016) Non‐coding RNAs in development and disease: background, mechanisms, and therapeutic approaches. Physiol Rev 96, 1297–1325. [DOI] [PubMed] [Google Scholar]
- Bernardes JR, Faria CC, Andrade IS, Ferreira ACF, Carvalho DP, Leitao AC, de Alencar TAM and Fortunato RS (2018) Effect of the FE(2+) chelation by 2,2′‐dipyridyl in the doxorubicin‐induced lethality in breast tumor cell lines. Life Sci 192, 128–135. [DOI] [PubMed] [Google Scholar]
- Cerami E, Gao J, Dogrusoz U, Gross BE, Sumer SO, Aksoy BA, Jacobsen A, Byrne CJ, Heuer ML, Larsson E et al (2012) The cBio cancer genomics portal: an open platform for exploring multidimensional cancer genomics data. Cancer Discov 2, 401–404. [DOI] [PMC free article] [PubMed] [Google Scholar]
- Chou R, Selph SS, Buckley DI, Gustafson KS, Griffin JC, Grusing SE and Gore JL (2016) Treatment of muscle‐invasive bladder cancer: a systematic review. Cancer 122, 842–851. [DOI] [PubMed] [Google Scholar]
- Du H, Pang M, Hou X, Yuan S and Sun L (2017) PLOD2 in cancer research. Biomed Pharmacother 90, 670–676. [DOI] [PubMed] [Google Scholar]
- Fang Z, Yin S, Sun R, Zhang S, Fu M, Wu Y, Zhang T, Khaliq J and Li Y (2017) miR‐140‐5p suppresses the proliferation, migration and invasion of gastric cancer by regulating YES1. Mol Cancer 16, 139. [DOI] [PMC free article] [PubMed] [Google Scholar]
- Flamini V, Jiang WG and Cui Y (2017) Therapeutic role of MiR‐140‐5p for the treatment of non‐small cell lung cancer. Anticancer Res 37, 4319–4327. [DOI] [PubMed] [Google Scholar]
- Fukumoto I, Hanazawa T, Kinoshita T, Kikkawa N, Koshizuka K, Goto Y, Nishikawa R, Chiyomaru T, Enokida H, Nakagawa M et al (2015) MicroRNA expression signature of oral squamous cell carcinoma: functional role of microRNA‐26a/b in the modulation of novel cancer pathways. Br J Cancer 112, 891–900. [DOI] [PMC free article] [PubMed] [Google Scholar]
- Fukumoto I, Kinoshita T, Hanazawa T, Kikkawa N, Chiyomaru T, Enokida H, Yamamoto N, Goto Y, Nishikawa R, Nakagawa M et al (2014) Identification of tumour suppressive microRNA‐451a in hypopharyngeal squamous cell carcinoma based on microRNA expression signature. Br J Cancer 111, 386–394. [DOI] [PMC free article] [PubMed] [Google Scholar]
- Gao J, Aksoy BA, Dogrusoz U, Dresdner G, Gross B, Sumer SO, Sun Y, Jacobsen A, Sinha R, Larsson E et al (2013) Integrative analysis of complex cancer genomics and clinical profiles using the cBioPortal. Sci Signal 6, pl1. [DOI] [PMC free article] [PubMed] [Google Scholar]
- Gilkes DM, Bajpai S, Wong CC, Chaturvedi P, Hubbi ME, Wirtz D and Semenza GL (2013) Procollagen lysyl hydroxylase 2 is essential for hypoxia‐induced breast cancer metastasis. Mol Cancer Res 11, 456–466. [DOI] [PMC free article] [PubMed] [Google Scholar] [Retracted]
- Giunta C, Randolph A and Steinmann B (2005) Mutation analysis of the PLOD1 gene: an efficient multistep approach to the molecular diagnosis of the kyphoscoliotic type of Ehlers‐Danlos syndrome (EDS VIA). Mol Genet Metab 86, 269–276. [DOI] [PubMed] [Google Scholar]
- Goto Y, Kojima S, Nishikawa R, Kurozumi A, Kato M, Enokida H, Matsushita R, Yamazaki K, Ishida Y, Nakagawa M et al (2015a) MicroRNA expression signature of castration‐resistant prostate cancer: the microRNA‐221/222 cluster functions as a tumour suppressor and disease progression marker. Br J Cancer 113, 1055–1065. [DOI] [PMC free article] [PubMed] [Google Scholar]
- Goto Y, Kurozumi A, Arai T, Nohata N, Kojima S, Okato A, Kato M, Yamazaki K, Ishida Y, Naya Y et al (2017) Impact of novel miR‐145‐3p regulatory networks on survival in patients with castration‐resistant prostate cancer. Br J Cancer 117, 409–420. [DOI] [PMC free article] [PubMed] [Google Scholar]
- Goto Y, Kurozumi A, Enokida H, Ichikawa T and Seki N (2015b) Functional significance of aberrantly expressed microRNAs in prostate cancer. Int J Urol 22, 242–252. [DOI] [PubMed] [Google Scholar]
- Guo HF, Tsai CL, Terajima M, Tan X, Banerjee P, Miller MD, Liu X, Yu J, Byemerwa J, Alvarado S et al (2018) Pro‐metastatic collagen lysyl hydroxylase dimer assemblies stabilized by Fe(2+) binding. Nat Commun 9, 512. [DOI] [PMC free article] [PubMed] [Google Scholar]
- Huang H, Wang Y, Li Q, Fei X, Ma H and Hu R (2019) miR‐140‐3p functions as a tumor suppressor in squamous cell lung cancer by regulating BRD9. Cancer Lett 446, 81–89. [DOI] [PubMed] [Google Scholar]
- Idichi T, Seki N, Kurahara H, Fukuhisa H, Toda H, Shimonosono M, Yamada Y, Arai T, Kita Y, Kijima Y et al (2018) Involvement of anti‐tumor miR‐124‐3p and its targets in the pathogenesis of pancreatic ductal adenocarcinoma: direct regulation of ITGA3 and ITGB1 by miR‐124‐3p. Oncotarget 9, 28849–28865. [DOI] [PMC free article] [PubMed] [Google Scholar]
- Jover E, Silvente A, Marin F, Martinez‐Gonzalez J, Orriols M, Martinez CM, Puche CM, Valdes M, Rodriguez C and Hernandez‐Romero D (2018) Inhibition of enzymes involved in collagen cross‐linking reduces vascular smooth muscle cell calcification. FASEB J 32, 4459–4469. [DOI] [PubMed] [Google Scholar]
- Kawakami K, Enokida H, Tachiwada T, Nishiyama K, Seki N and Nakagawa M (2007) Increased SKP2 and CKS1 gene expression contributes to the progression of human urothelial carcinoma. J Urol 178, 301–307. [DOI] [PubMed] [Google Scholar]
- Koshizuka K, Hanazawa T, Fukumoto I, Kikkawa N, Okamoto Y and Seki N (2017a) The microRNA signatures: aberrantly expressed microRNAs in head and neck squamous cell carcinoma. J Hum Genet 62, 3–13. [DOI] [PubMed] [Google Scholar]
- Koshizuka K, Nohata N, Hanazawa T, Kikkawa N, Arai T, Okato A, Fukumoto I, Katada K, Okamoto Y and Seki N (2017b) Deep sequencing‐based microRNA expression signatures in head and neck squamous cell carcinoma: dual strands of pre‐miR‐150 as antitumor miRNAs. Oncotarget 8, 30288–30304. [DOI] [PMC free article] [PubMed] [Google Scholar]
- Kurozumi A, Goto Y, Okato A, Ichikawa T and Seki N (2017) Aberrantly expressed microRNAs in bladder cancer and renal cell carcinoma. J Hum Genet 62, 49–56. [DOI] [PubMed] [Google Scholar]
- Kurozumi A, Kato M, Goto Y, Matsushita R, Nishikawa R, Okato A, Fukumoto I, Ichikawa T and Seki N (2016) Regulation of the collagen cross‐linking enzymes LOXL2 and PLOD2 by tumor‐suppressive microRNA‐26a/b in renal cell carcinoma. Int J Oncol 48, 1837–1846. [DOI] [PMC free article] [PubMed] [Google Scholar]
- Lei CY, Wang W, Zhu YT, Fang WY and Tan WL (2016) The decrease of cyclin B2 expression inhibits invasion and metastasis of bladder cancer. Urol Oncol 34, 237.e231-210. [DOI] [PubMed] [Google Scholar]
- Lemke EA and Shah AY (2018) Management of advanced bladder cancer: an update. J Adv Pract Oncol 9, 410–416. [PMC free article] [PubMed] [Google Scholar]
- Li L, Wang W, Li X and Gao T (2017) Association of ECRG4 with PLK1, CDK4, PLOD1 and PLOD2 in esophageal squamous cell carcinoma. Am J Transl Res 9, 3741–3748. [PMC free article] [PubMed] [Google Scholar]
- Mah SM, Buske C, Humphries RK and Kuchenbauer F (2010) miRNA*: a passenger stranded in RNA‐induced silencing complex? Crit Rev Eukaryot Gene Expr 20, 141–148. [DOI] [PubMed] [Google Scholar]
- Matsushita R, Seki N, Chiyomaru T, Inoguchi S, Ishihara T, Goto Y, Nishikawa R, Mataki H, Tatarano S, Itesako T et al (2015) Tumour‐suppressive microRNA‐144‐5p directly targets CCNE1/2 as potential prognostic markers in bladder cancer. Br J Cancer 113, 282–289. [DOI] [PMC free article] [PubMed] [Google Scholar]
- Miyamoto K, Seki N, Matsushita R, Yonemori M, Yoshino H, Nakagawa M and Enokida H (2016) Tumour‐suppressive miRNA‐26a‐5p and miR‐26b‐5p inhibit cell aggressiveness by regulating PLOD2 in bladder cancer. Br J Cancer 115, 354–363. [DOI] [PMC free article] [PubMed] [Google Scholar]
- Peinado H, Moreno‐Bueno G, Hardisson D, Perez‐Gomez E, Santos V, Mendiola M, de Diego JI, Nistal M, Quintanilla M, Portillo F et al (2008) Lysyl oxidase‐like 2 as a new poor prognosis marker of squamous cell carcinomas. Can Res 68, 4541–4550. [DOI] [PubMed] [Google Scholar]
- Qi Y and Xu R (2018) Roles of PLODs in collagen synthesis and cancer progression. Front Cell Dev Biol 6, 66. [DOI] [PMC free article] [PubMed] [Google Scholar]
- Sugawara S, Yamada Y, Arai T, Okato A, Idichi T, Kato M, Koshizuka K, Ichikawa T and Seki N (2018) Dual strands of the miR‐223 duplex (miR‐223‐5p and miR‐223‐3p) inhibit cancer cell aggressiveness: targeted genes are involved in bladder cancer pathogenesis. J Hum Genet 63, 657–668. [DOI] [PubMed] [Google Scholar]
- Wang D, Zhang S and Chen F (2018) High expression of PLOD1 drives tumorigenesis and affects clinical outcome in gastrointestinal carcinoma. Genet Test Mol Biomarkers 22, 366–373. [DOI] [PubMed] [Google Scholar]
- Wolfson B, Eades G and Zhou Q (2014) Roles of microRNA‐140 in stem cell‐associated early stage breast cancer. World J Stem Cells 6, 591–597. [DOI] [PMC free article] [PubMed] [Google Scholar]
- Yamada Y, Arai T, Kojima S, Sugawara S, Kato M, Okato A, Yamazaki K, Naya Y, Ichikawa T and Seki N (2018a) Anti‐tumor roles of both strands of the miR‐455 duplex: their targets SKA1 and SKA3 are involved in the pathogenesis of renal cell carcinoma. Oncotarget 9, 26638–26658. [DOI] [PMC free article] [PubMed] [Google Scholar]
- Yamada Y, Arai T, Kojima S, Sugawara S, Kato M, Okato A, Yamazaki K, Naya Y, Ichikawa T and Seki N (2018b) Regulation of antitumor miR‐144‐5p targets oncogenes: direct regulation of syndecan‐3 and its clinical significance. Cancer Sci 109, 2919–2936. [DOI] [PMC free article] [PubMed] [Google Scholar]
- Yamada Y, Arai T, Sugawara S, Okato A, Kato M, Kojima S, Yamazaki K, Naya Y, Ichikawa T and Seki N (2018c) Impact of novel oncogenic pathways regulated by anti‐tumor miR‐451a in renal cell carcinoma. Cancer Sci 109, 1239–1253. [DOI] [PMC free article] [PubMed] [Google Scholar]
- Yamada Y, Sugawara S, Arai T, Kojima S, Kato M, Okato A, Yamazaki K, Naya Y, Ichikawa T and Seki N (2018d) Molecular pathogenesis of renal cell carcinoma: impact of the anti‐tumor miR‐29 family on gene regulation. Int J Urol 25, 953–965. [DOI] [PubMed] [Google Scholar]
Associated Data
This section collects any data citations, data availability statements, or supplementary materials included in this article.
Supplementary Materials
Fig. S1. Effect of miR‐140‐5p and miR‐140‐3p on apoptosis and cell‐cycle assays in BOY cells.
Fig. S2. miR‐140‐5p and miR‐140‐3p localization within the RISC.
Fig. S3. Clinical database analysis of PLOD1, PLOD2 and PLOD3 expression in BC patients.
Fig. S4. Expression analysis of PLOD1, PLOD2 and PLOD3 in BC tissues.
Fig. S5. Effect of si‐PLOD1 on apoptosis and cell‐cycle assays in BOY cells.
Fig. S6. Effect of a PLOD1 inhibitor on the migration and invasion of BC cells.
Fig. S7. Effect of a PLOD1 inhibitor on PLOD1 expression.
Fig. S8. Effect of a PLOD1 inhibitor on apoptosis and cell‐cycle assays in BC cells.
Fig. S9. Downstream pathways affected by treatment with a PLOD1 inhibitor in BC cells.
Table S1. Background characteristics of the BC patients.
Data Availability Statement
Data acquired during the course of this study are available in GEO: GSE115800 and GSE123318.