

Abstract
Aims/Introduction
We have previously reported that glycine suppresses the advanced glycation end‐products signaling pathway and mitigates subsequent oxidative stress in the kidneys of diabetic rats. In the present study, we investigated whether this beneficial effect was associated with upregulation of glyoxalase‐1 (Glo1) and activation of the nuclear factor erythroid 2‐related factor 2 (Nrf2).
Materials and Methods
Both healthy rats and streptozotocin‐induced diabetic rats were administrated with glycine (1% added to the drinking water) for 12 weeks. The function of Glo1, messenger ribonucleic acid (mRNA) and protein expressions of Nrf2, and markers of oxidative status were measured in the kidneys. The mRNA expressions of other downstream signaling molecules of the Nrf2 pathway were also determined.
Results
The mRNA and protein expressions, as well as the activity of Glo1, were decreased in the kidneys of diabetic rats, accompanied by diminished glutathione levels. After glycine treatment, these parameters of Glo1 function were markedly increased. Compared with the control group, the levels of Nrf2 mRNA and protein in the total kidney lysis were both markedly elevated in the diabetic group and glycine‐treated group. However, the nuclear translocation of Nrf2 was significantly increased in the glycine‐treated group than in the diabetic group. In addition, the anti‐oxidant capacity and the expressions of other downstream molecules of the Nrf2 signaling pathway were significantly increased after glycine treatment.
Conclusions
The present study shows that glycine might enhance the function of Glo1 and restore anti‐oxidant defense by promoting the nuclear translocation of Nrf2, thus inhibiting advanced glycation end‐products formation and protecting against renal oxidative stress.
Keywords: Glycine, Glyoxalase‐1, Nuclear factor erythroid 2‐related factor 2
Introduction
Oxidative stress plays a central role in the development of diabetic nephropathy1, 2. The advanced glycation end‐products (AGEs) signaling pathway is one of the five major mechanisms of oxidative stress3. In the traditional view, AGEs mainly result from a slow, non‐enzymatic reaction between glucose and large biomolecules4. Once formed, AGEs can activate the receptor for AGEs (RAGE), thus triggering a vicious loop of inflammation and oxidative stress3, 5, which eventually leads to renal damages. Recent findings suggest that methylglyoxal (MG), a highly‐reactive byproduct of glycolysis, is much more potent than glucose in promoting the formation of AGEs and in activating the AGE/RAGE signaling pathway6, 7.
The glyoxalase system plays a crucial role in detoxifying MG. Using glutathione (GSH) as a cofactor, glyoxalase‐1 (Glo1) and glyoxalase‐2 efficiently catalyze the conversion of MG into lactate, thus reducing the precursor of AGEs8. Studies have shown that knockdown of Glo1, the rate‐limiting enzyme of the glyoxalase system, can mimic diabetic nephropathy in healthy mice9; whereas upregulation of Glo1 suppresses the AGE/RAGE pathway, thus attenuating renal damage, such as mesangial matrix expansion10 and podocytes apoptosis11. Therefore, the enhancement of Glo1 function might suppress the AGE/RAGE signaling pathway and the subsequent renal damage.
It was reported that Glo1 is a target gene of nuclear factor erythroid 2‐related factor 2 (Nrf2), a transcription factor. Under basal conditions, the activation of Nrf2 is inhibited by Kelch‐like ECH‐associated protein 1, which binds to Nrf2 and forms a suppressive complex in the cytoplasm12. Under oxidative stress, Nrf2 dissociates from the complex and translocates from the cytoplasm to the nucleus, where it binds to the anti‐oxidant response element and promotes the transcription of numerous genes that encode anti‐oxidant enzymes, including superoxide dismutase (SOD), catalase (CAT), glutathione peroxidase (GPx), heme oxygenase‐1 (HO‐1) and NAD(P)H (the reduced form of either nicotinamide adenine dinucleotide or nicotinamide adenine dinucleotide phosphate) quinone dehydrogenase 1 (NQO1)13. Nrf2 also regulates genes that encode GSH‐related enzymes, such as glutathione peroxidase‐1 (GPx‐1), glutathione synthetase (GSS) and glutamate‐cysteine ligase13. However, when oxidative stress persists, the nuclear translocation of Nrf2 is hampered. As a result, the anti‐oxidant response of Nrf2 is impaired14, leading to uncontrolled oxidative stress in the kidney15, 16. Therefore, activation of Nrf2 might be beneficial for increasing the function of Glo1, as well as ameliorating oxidative stress.
Glycine is one of the predecessors of GSH, a major endogenous anti‐oxidant in the human body. GSH is crucial for the detoxifying process catalyzed by Glo1, and depletion of GSH can suppress the function of Glo117, 18, 19 and induce significant MG accumulation20. In individuals with either diabetes or metabolic syndrome, the levels of glycine and GSH are reduced as compared with healthy individuals, but this reduction can be reversed after oral glycine treatment21, 22, 23. We have previously reported that oral supplement of glycine can inhibit the AGE/RAGE signaling pathway and the subsequent oxidative stress in the kidneys of diabetic rats24, 25, but whether this beneficial effect is associated with the upregulation of Glo1 still remains unknown. Glycine also increases the activity of anti‐oxidant enzymes, such as SOD, CAT and GPx, under oxidative stress26, 27, 28, 29, but the mechanism is unclear. Therefore, we speculate that the beneficial effects of glycine on suppressing the formation of AGEs and increasing anti‐oxidant capacity might be related to the activation of Nrf2.
In the present study, we investigated the effect of oral glycine treatment on the function of Glo1 and the anti‐oxidant defense in the kidneys of STZ‐induced diabetic rats, and explored whether this effect is associated with Nrf2 activation.
Methods
Experimental animals
All protocols and procedures of the present study were approved by the Ethics Committee for Animal Experimentation of the Faculty of Peking University First Hospital. All animal experiments were conducted following the national guidelines and the relevant national laws on the protection of animals. Six‐week‐old male Wistar rats were housed under a 12‐h light–dark cycle. After 2 weeks of acclimation, all rats were randomly assigned either to an experimental group or to a healthy control group. The experimental group was intraperitoneally injected with a single dose of streptozotocin (STZ; 65 mg/kg of bodyweight; Sigma‐Aldrich, St. Louis, MO, USA). Diabetes mellitus was confirmed after 2 weeks by measuring blood glucose levels (levels >16.7 mmol/L were confirmed as diabetic). The experimental group was then divided into a diabetes mellitus group (non‐treated diabetic rats receiving normal drinking water, n = 8) and a DG group (diabetic rats receiving 1% (w/v) glycine in drinking water ad libitum, as reported by others30, 31, 32, n = 7). Likewise, the healthy control group was divided into two groups: a control group (healthy rats receiving normal drinking water, n = 8) and a CG group (healthy rats receiving 1% [w/v] glycine in drinking water ad libitum, n = 8). After 12 weeks, all rats were killed. Serum samples were collected to determine biochemical profiles by an Automatic Biochemical Analyzer (7600; Hitachi, Tokyo, Japan). Equal amounts of urine and serum samples were used to measure the levels of cystatin‐C (CSB‐E08385r; CUSABIO, Wuhan, China).
Measurement of renal Glo1 activity
The activity of Glo1 was measured according to the method established by Arai et al.33. Samples of kidney cortex were washed in phosphate‐buffered saline, and sonicated in 10 mmol/L sodium phosphate buffer (pH 7). The protein concentration of the supernatants was adjusted to the same level in all samples. In a 96‐well UV plate, 125 μL sodium phosphate buffer (100 mmol/L, pH 6.6), 25 μL GSH (40 mmol/L), 25 μL MG (40 mmol/L) and 70 μL Millipore water were added into each well and incubated at 37°C for 15 min. After incubation, 5 μL solubilized protein was added into each well. The absorbance at 240 nm (A240) was monitored every 2 min. The Glo1 activity was displayed as the change in A240 per minute per mg protein.
Quantitative real‐time reverse transcription polymerase chain reaction
The method of real‐time reverse transcription polymerase chain reaction has been previously reported24. The primer sequences were as follows: Nrf2 GAATAAAGTTGCCGCTCAGAA (forward), AAGGTTTCCCATCCTCATCAC (reverse); Glo1 GAAGATGACGAGACGCAGAGTTAC (forward), CAGGATCTTGAACGAACGCCAGAC (reverse); CAT ACACTTTGACAGAGAGCGGA (forward), TTTCACTGCAAACCCACGAG (reverse); SOD 2 CTGCTGGGGATTGATGTGTG (forward), CTACAAAACACCCACCACGG (reverse); HO‐1 CTGGTGATGGCCTCCTTGTA (forward), GATGAGTACCTCCCACCTCG (reverse); NQO1 CCTGATTGTATTGGCCCACG (forward), CTCAGGCGGCCTTCCTTATA (reverse); GPx‐1 GACCGACCCCAAGTACATCA (forward), GCAGGGCTTCTATATCGGGT (reverse); glutamate‐cysteine ligase catalytic subunit GACCATCGACACGGAGATCT (forward), GAGTTTGGAGGAGGAGGCTT (reverse); glutamate‐cysteine ligase modifier subunit CACAACTCAGGGGCCTTGTA (forward), CGCCAGGGAGGTACTCAAAC (reverse); GSS CGTGGTGCTACTGATTGCTC (forward), AACAGCCTTCGGTTTTGGTC (reverse); β‐actin ATCTGGCACCACACCTTC (forward), AGCCAGGTCCAGACGCA (reverse). Gene expression was normalized to β‐actin and calculated using the 2−ΔΔCT method.
Western blot
To obtain total protein samples, frozen samples of kidney cortex were homogenized in ice‐cold radioimmunoprecipitation assay lysis buffer (P0013; Beyotime, Beijing, China) with 1% protease inhibitors cocktail and phenylmethane sulfonyl fluoride. The protein concentration of the supernatants was determined by the bicinchoninic acid assay kit and adjusted to the same level in all samples. The separation of nuclear and cytosol protein was carried out according to the manufacturer's instructions (KGP1100; KeyGEN BioTECH, Beijing China).
The method of western blot has been previously reported elsewhere24. The membrane was incubated overnight with a primary mouse anti‐Nrf2 antibody (1:1,000 ab89443; Abcam, Cambridge, UK) or mouse anti‐Glo1 antibody (1:3,000, MA1‐13029; Invitrogen, Waltham, MA, USA) at 4°C. After washing, the membrane was incubated with a secondary antibody (1:5,000 HRP‐coupled anti‐mouse antibody, ZB‐2305; ZSGB‐BIO, Beijing, China) for 1 h at room temperature. The membrane was probed for β‐actin (1:3,000, TA‐09; ZSGB‐BIO) as a loading control for total protein or cytoplasmic protein. Histone was used as a loading control for nuclear protein (1:3,000, ab11079; Abcam). The bands were visualized using the ECL Western Blotting Substrate (Thermo Fisher, Hudson, NY, USA), and quantified with Image‐Pro Plus 6.0 software (Media Cybernetics, Rockville, MD, USA).
Measurement of renal anti‐oxidant capacity
Briefly, renal cortex samples were lysed in ice‐cold HEPES buffer and centrifuged at 17,000 g for 20 min at 4°C. The supernatants were collected and the protein concentrations of the samples were adjusted to the same level. Equal amounts of the protein samples were subjected to the measurement of total GSH levels (A061‐1; Jiancheng, Nanjing, China), ratio of reduced GSH/oxidized GSH (GSSG; S0053 GSH kit; Beyotime), malondialdehyde levels (S0131; Beyotime), SOD activity (706002; Cayman Chemicals, Ann Arbor, MI, USA), CAT activity (707002; Cayman Chemicals), 8‐hydroxy‐2′‐deoxyguanosine (8‐OHdG) levels (CSB‐E10526r; CUSABIO), protein carbonyl levels (STA‐310, OxiSelect™ protein carbonyl ELISA kit; Cellbiolabs, San Diego, CA, USA) and 8‐iso‐prostaglandin F2α (8‐iso‐PGF2α) levels (ab133043; Abcam) according to the manufacturers' instructions.
Statistical analysis
SPSS 20.0 (SPSS Inc., Chicago, IL, USA) was applied to carry out statistical analysis of the data. Quantitative data are shown as the mean ± standard error of the mean (for normally distributed data) or medians and interquartile ranges (for non‐normally distributed data). Differences between groups were assessed using one‐way analysis of variance (anova) for normally distributed data, followed by Tukey's post‐hoc test. In addition, the Kruskal–Wallis test was used for non‐normally distributed data. A P‐value <0.05 was considered statistically significant.
Results
Effect of glycine on bodyweight, glucose control and biochemical profiles
Compared with the control group, the bodyweight in the diabetes mellitus group decreased significantly (Figure 1a). After glycine treatment, the bodyweight seemed unaltered. The blood glucose levels in the diabetes mellitus group increased sharply compared with the control group after the induction of diabetes mellitus. However, treatment of glycine did not affect the glucose levels (Figure 1b). Likewise, the levels of hemoglobin A1c in the diabetes mellitus group were higher than in the control group, but were not significantly changed after glycine treatment (Table 1). No marked alterations were observed in the healthy control rats treated with glycine (the CG group).
Figure 1.
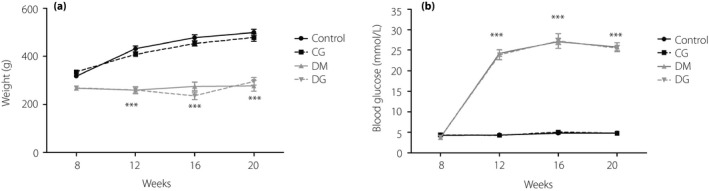
(a) Bodyweight and (b) blood glucose levels. ***P < 0.001 compared with the control group. CG, healthy rats receiving tap water with 1% glycine added; Control, healthy rats receiving normal tap water; DG, diabetic rats receiving tap water with 1% glycine added; DM, diabetic rats receiving normal tap water.
Table 1.
Hemoglobin A1c levels and serum biochemical profiles after 12 weeks of treatment
| Group | Control | CG | DM | DG |
|---|---|---|---|---|
| HbA1c (%) | 4.338 ± 0.47 | 4.363 ± 0.30 | 9.587 ± 0.69* | 9.429 ± 0.62* |
| CREA (μmol/L) | 42.5 ± 2.26 | 39.38 ± 2.16 | 40.88 ± 2.69 | 34.14 ± 2.14** |
| UREA (μmol/L) | 8.71 ± 1.06 | 7.40 ± 1.31 | 20.49 ± 2.29* | 12.3 ± 1.89** |
| Serum cystatin‐C (ng/mL) | 5.85 ± 0.41 | 6.68 ± 0.68 | 10.75 ± 1.61* | 7.30 ± 0.68 |
| Urinary cystatin‐C (ng/mL) | 3.00 ± 0.29 | 3.30 ± 0.43 | 8.84 ± 1.19* | 3.75 ± 0.85** |
| ALT (mmol/L) | 38.0 ± 4.96 | 36.2 ± 3.97 | 276.5 ± 10.91* | 200.0 ± 12.72* |
| AST (mmol/L) | 207.75 ± 15.77 | 109.5 ± 10.50 | 488.13 ± 16.61* | 401.43 ± 18.86* |
| TG (mmol/L) | 0.41 ± 0.37 | 0.47 ± 0.44 | 2.3 ± 1* | 2.08 ± 1.18* |
| TCHO (mmol/L) | 2.29 ± 0.67 | 2.09 ± 0.69 | 2.55 ± 0.69 | 2.46 ± 0.81 |
| HDL (mmol/L) | 0.65 ± 0.30 | 0.65 ± 0.36 | 0.89 ± 0.40 | 1.05 ± 0.40 |
| LDL (mmol/L) | 0.33 ± 0.33 | 0.22 ± 0.22 | 0.41 ± 0.42 | 0.42 ± 0.51 |
Data are expressed as the mean ± standard error of the mean. *P < 0.05 compared with the control group; **P < 0.05 compared with the diabetic rats receiving normal tap water (DM) group. ALT, alanine transaminase; AST, aspartate transaminase; CG, healthy rats receiving tap water with 1% glycine added; Control, healthy rats receiving normal tap water; CREA: creatinine; DG, diabetic rats receiving tap water with 1% glycine added; HbA1c, hemoglobin A1c; HDL, high‐density lipoprotein; LDL, low‐density lipoprotein; TCHO, total cholesterol; TG, triglyceride.
The serum creatinine levels in the diabetes mellitus group were not altered compared with those in the control group. However, after glycine treatment, the serum creatinine levels were significantly lower than in the diabetes mellitus group (P < 0.05). The levels of urea and cystatin‐C in the serum increased significantly in the diabetes mellitus group than in the control group (P < 0.05). After glycine treatment, the level of urea significantly was decreased (P < 0.05). The levels of serum cystatin‐C tended to be reduced, but this reduction did not reach statistical significance. The levels of urinary cystatin‐C in the diabetes mellitus group were increased compared with the control group (P < 0.05), but were significantly decreased after glycine treatment (P < 0.05). The levels of aspartate transaminase, alanine transaminase and triglyceride in the diabetes mellitus group were significantly higher than in the control group (P < 0.05), but seemed unaffected by glycine treatment. No marked changes in other parameters of lipid profiles were detected among the four groups.
Glycine increases renal Glo1 function
To assess the function of Glo1, we measured the messenger ribonucleic acid (mRNA) and protein expressions, as well as the activity of Glo1 in the kidneys. As GSH serves as the cofactor of Glo1, the levels of renal GSH were determined. A decrease of total GSH level in the diabetes mellitus group was observed compared with the control group (P < 0.05; Figure 2a), but this reduction was reversed by glycine supplement (P < 0.001). Although the total GSH levels in the CG group tended to be higher than in the control group, no statistical significance was observed. The levels of reduced GSH were decreased in the kidneys of diabetic rats as compared with the control group (P < 0.001; Figure 2b), but were increased by glycine treatment (P < 0.01). Conversely, the levels of GSSG were increased in the diabetes mellitus group (P < 0.05; Figure 2c), but were decreased in the DG group (P < 0.01). Consequently, the ratio of reduced GSH/GSSG was significantly increased in the DG group as compared with the diabetes mellitus group (P < 0.01; Figure 2d).
Figure 2.
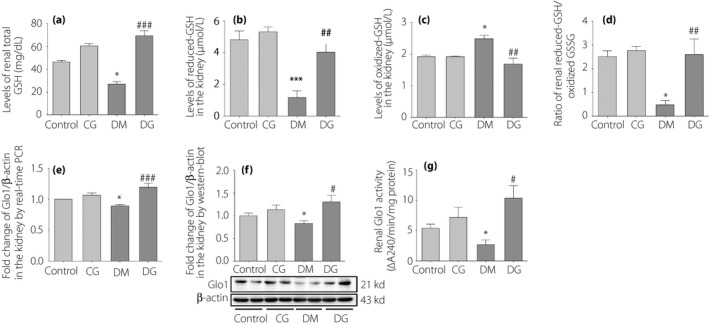
The assessments of glyoxalase‐1 (Glo1) function in the kidneys. (a) The levels of total glutathione (GSH) in the kidneys. (b) The levels of reduced GSH in the kidneys. (c) Levels of oxidized GSH (GSSG) in the kidneys. (d) The ratio of reduced GSH/GSSG in the kidneys. (e) The messenger ribonucleic acid expression of renal Glo1. (f) The protein expression of renal Glo1. (g) The activity of renal Glo1. *P < 0.05; ***P < 0.001 compared with the control group. # P < 0.05; ## P < 0.01; ### P < 0.001 compared with the diabetic rats receiving normal tap water (DM) group. Control, healthy rats receiving normal tap water; CG, healthy rats receiving tap water with 1% glycine added; DG, diabetic rats receiving tap water with 1% glycine added.
The mRNA and protein expression of renal Glo1 were lower in the diabetes mellitus group than in the control group (P < 0.05; Figure 2e,f). After glycine treatment, the mRNA and protein expression of Glo1 were markedly increased (P < 0.001 and P < 0.05, respectively). The activity of renal Glo1 was decreased in the diabetes mellitus group compared with the control group (P < 0.05; Figure 2g), but was increased in the DG group (P < 0.05). No obvious changes in the protein expression and activity of Glo1 in the CG group were observed compared with the control group.
Glycine promotes the translocation of Nrf2 from the cytoplasm into the nucleus
Both mRNA and protein expression of Nrf2 in the total protein of kidney samples were increased significantly in the diabetes mellitus group compared with those in the control group (P < 0.05; Figure 3a,b), but remained unaltered after glycine treatment. However, the protein expression of Nrf2 in the cytoplasm of kidney samples was significantly higher in the diabetes mellitus group than in the DG group (P < 0.001; Figure 3c). Conversely, the protein expression of Nrf2 in the nucleus of kidney samples was significantly higher in the DG group than in the diabetes mellitus group (P < 0.001; Figure 3d). The mRNA expressions of other downstream signaling molecules in the Nrf2 pathway were detected in the kidneys. The mRNA expressions of CAT, SOD2, HO‐1 and NQO1 in the diabetes mellitus group were not markedly changed as compared with the control group. However, the mRNA expressions of these genes were significantly increased in the DG group as compared with the diabetes mellitus group (P < 0.05, P < 0.05, P < 0.05 and P < 0.01, respectively; Figure 4a–d). The mRNA expression of GPx‐1 was decreased in the diabetes mellitus group as compared with the control group (P < 0.05; Figure 4e), but was significantly increased after glycine treatment (P < 0.001). The mRNA expressions of GSS and glutamate‐cysteine ligase catalytic subunit were lower in the diabetes mellitus group than in the control group (P < 0.01; Figure 4f,g), but were not altered after glycine treatment. No statistically significant changes were detected in the mRNA expression of glutamate‐cysteine ligase modifier subunit (Figure 4h).
Figure 3.
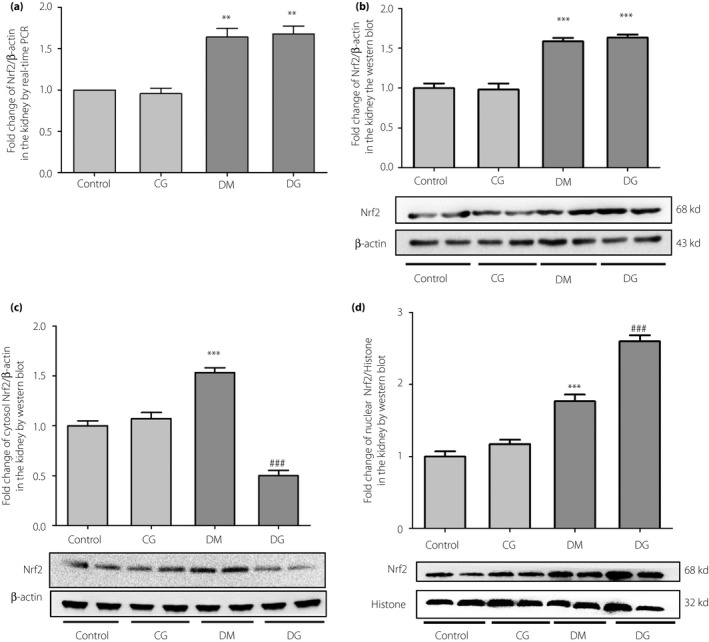
The (a) messenger ribonucleic acid expression, (b) protein expression in the total tissue lysis, (c) cytoplasm and (d) nucleus of nuclear factor erythroid 2‐related factor 2 (Nrf2) in the kidneys. **P < 0.01; ***P < 0.001 compared with the control group. ### P < 0.001 compared with the diabetic group without treatment (DM). CG, control rats receiving 1% oral glycine treatment; Control, healthy control group; DG, diabetic rats receiving 1% oral glycine treatment; PCR, polymerase chain reaction.
Figure 4.
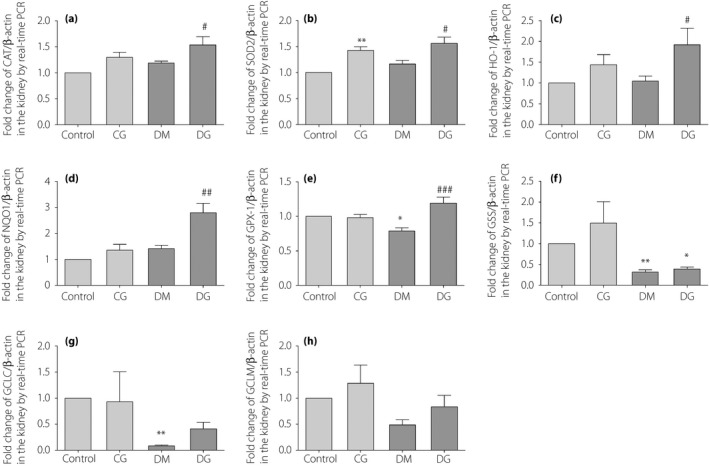
The messenger ribonucleic acid expression of (a) catalase (CAT), (b) superoxide dismutase 2 (SOD2), (c) heme oxygenase‐1 (HO‐1), (d) reduced nicotinamide adenine dinucleotide (phosphate) quinone dehydrogenase 1 (NQO1), (e) glutathione peroxidase‐1 (GPx‐1), (f) glutathione synthetase (GSS), (g) glutamate‐cysteine ligase catalytic subunit (GCLC) and (h) glutamate‐cysteine ligase modifier subunit (GCLM) in the kidneys. *P < 0.05; **P < 0.01 compared with the control group. # P < 0.05; ## P < 0.01; ### P < 0.001 compared with the diabetic group without treatment (DM). CG, control rats receiving 1% oral glycine treatment; Control, healthy control group; DG, diabetic rats receiving 1% oral glycine treatment; PCR, polymerase chain reaction.
Glycine restores the impaired redox defense
The activities of CAT and SOD in the diabetes mellitus group were lower than in the control group (P < 0.05 and P < 0.01, respectively; Figure 5a,b), but were restored after glycine treatment (P < 0.001 and P < 0.01, respectively). The levels of renal 8‐iso‐PGF2α, 8‐OHdG, malondialdehyde and protein carbonyls were increased in the diabetes mellitus group compared with the control group (P < 0.05, P < 0.01, P < 0.05 and P < 0.05, respectively; Figure 5c–f), but were significantly decreased after glycine treatment, except for 8‐iso‐PGF2α (P > 0.05, P < 0.01, P < 0.05 and P < 0.05, respectively.).
Figure 5.
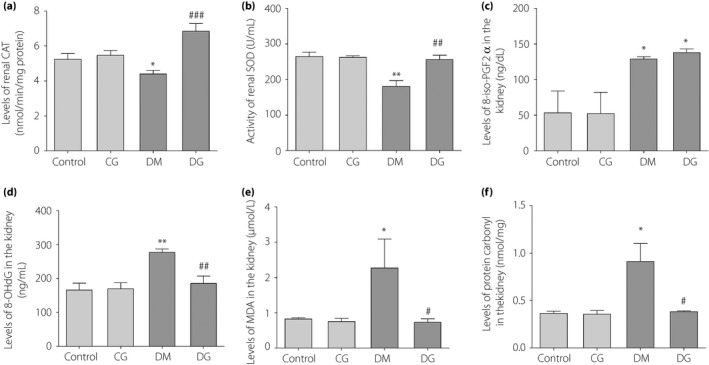
Estimation of anti‐oxidant capacity in the kidneys of the four groups. (a) The activity of renal catalase. (b) The activity of renal superoxide dismutase. (c) The levels of renal 8‐iso‐prostaglandin F2α (8‐iso‐PGF2α). (d) The levels of renal 8‐hydroxy‐2′‐deoxyguanosine (8‐OHdG). (e) The levels of renal malondialdehyde (MDA). (f) The levels of protein carbonyl in the kidneys. *P < 0.05; **P < 0.01; compared with the control group. # P < 0.05; ## P < 0.01; ### P < 0.001 compared with the diabetic group without treatment (DM) group. CG, control rats receiving 1% oral glycine treatment; Control, healthy control group; DG, diabetic rats receiving 1% oral glycine treatment.
Discussion
The present study shows that oral glycine treatment increases the expression and activity of renal Glo1 by promoting the nuclear translocation of Nrf2 and increasing GSH synthesis, thus ameliorating oxidative stress and renal injury in diabetic rats.
We have previously reported that oral glycine treatment inhibited the formation of AGEs in the kidneys of STZ‐induced diabetic rats, thus suppressing the expression of RAGE, Nox4 and the subsequent renal oxidative stress24, 25. As a result, renal damage, such as increased urinary albumin/creatinine rate, mesangial expansion and thickening of glomerular basement membrane, was decreased after glycine treatment24, 25. Besides our previous findings, Bahmani et al.30 reported that oral glycine treatment in diabetic rats significantly lowers plasma AGEs levels, thus delaying the development of cataracts. It was also hypothesized that glycine might work as a scavenger of intracellular glucose, and thereby protect the protein in the lens from excessive glycation34. In addition, the high solubility of glycine might prevent the formation and precipitation of AGEs, as raised by Alvarado‐Vásquez et al.31. Despite these findings, the upstream mechanism whereby glycine reduces the formation of AGEs still remains unclear.
The glyoxalase system plays a vital role in degrading MG, a highly‐reactive metabolite that accelerates the formation of AGEs35. As the rate‐limiting enzyme of the glyoxalase system, Glo1 efficiently detoxifies MG, thus suppressing AGEs formation12, 36, 37. It was reported that in non‐diabetic mice, knockdown of Glo1 increased AGEs formation and accelerated oxidative stress to the extent observed in the diabetic mice, causing morphological changes, as seen in diabetic nephropathy9. However, this damage could be completely prevented by overexpression of Glo19, 38, 39, 40. Hence, in order to protect against renal damage induced by AGEs, it is of great importance to enhance the function of Glo1. In the present study, the mRNA and protein expressions, as well as the activity of renal Glo1, in the diabetes mellitus group were decreased compared with those in the control group. After glycine treatment, these parameters of Glo1 function were significantly increased. This result indicated that the decreased formation of AGEs in the glycine‐treated rats observed in our previous study could be explained, at least in part, by the enhancement of Glo1 function.
It was reported that Glo1 is transcriptionally regulated by Nrf212, and activators of Nrf2 can promote mRNA and protein expressions of Glo1, and increase Glo1 activity10, 41. Recently, the role of anti‐oxidants in activating Nrf2 has sparkled intensive attention. Anti‐oxidants, such as resveratrol, quercetin and mangiferin, exert protective effects against the formation of AGEs and dicarbonyl stress by promoting nuclear translocation of Nrf2, thus increasing Glo1 expression41, 42, 43, 44, 45. In the present study, glycine treatment significantly enhanced the nuclear translocation of Nrf2, and increased the mRNA expression of Nrf2‐targeted genes, such as Glo1, CAT, SOD2, HO‐1, NQO1 and GPx‐1, suggesting that the Nrf2 pathway was activated. The activities of SOD and CAT were also increased after glycine treatment, which is consistent with previous studies21, 23, but the mechanism remains unclear. One speculation is that glycine increases the level of GSH, which has been reported to increase SOD activity by abolishing reactive oxygen species‐induced inactivation46. This could also be explained by the increased mRNA expression of CAT and SOD2 after glycine treatment observed in the present study. In addition, glycine treatment decreased the levels of oxidative markers, such as 8‐OHdG, malondialdehyde and protein carbonyls, indicating that the increased oxidative stress in the kidneys was suppressed. The renal levels of 8‐iso‐PGF2α in diabetic rats were not significantly reduced after glycine treatment, which might be explained by the limit of the method47, 48 and the possible increase in arachidonic acid levels after glycine treatment49. Consistent with the ameliorated oxidative stress, renal damage, such as mesangial expansion and microalbumin excretion, was reduced25. The renoprotective effect of glycine was also supported by the decreased serum creatinine and urea levels, as well as the decreased urinary cystatin‐C levels in the present study. It was reported that renal tubules are more prone to be injured by oxidative stress50, and our previous study showed that glycine can specifically suppress oxidative stress in the tubular area rather than the glomerular area in the kidney24. In the present study, the levels of urinary Cystatin‐C were significantly decreased in the DG group, indicating that glycine treatment is more effective in protecting against tubular damage.
It was reported that activators of Nrf2, such as sulforaphane and cinnamic aldehyde, could significantly attenuate hyperglycemia51. However, in the present study, the treatment of glycine did not exert such a beneficial effect in diabetic rats. Although there is not total agreement about the effect of glycine on hyperglycemia in diabetic models21, 24, 30, 32, 52, the unchanged glucose levels after glycine treatment in the present study indicated that the beneficial effects of glycine might be independent from the alleviation in hyperglycemia.
GSH is a crucial cofactor of the glyoxalase system19, 20. The activity of Glo1 is proportional to the levels of GSH, and depletion of GSH can suppress the function of Glo117, 18, 19 and induce significant MG accumulation20. Glycine is one of the predecessors of GSH. It was suggested that glycine is rate‐limiting for GSH synthesis53. Under diabetes or metabolic syndrome, the level of GSH is reduced, but this reduction can be reversed by glycine treatment21, 22, 23. Our previous study showed that the levels of glycine in both serum and kidneys were decreased in diabetic rats, but were restored after oral glycine treatment24. In the present study, the levels of total GSH and the ratio of GSH/GSSG in the kidneys of the diabetes mellitus group were significantly lower than the control group, but were significantly elevated after glycine treatment, which is in accordance with previous studies. However, the mRNA expressions of the enzymes that are involved in GSH synthesis, such as glutamate‐cysteine ligase catalytic subunit, glutamate‐cysteine ligase modifier subunit and GSS, were not significantly altered. Therefore, we speculate that the supplementation of glycine might increase the content of GSH by sustaining the availability of the substrate in the kidneys.
Taken together, the present study showed that glycine treatment increases the expression and activity of renal Glo1 by promoting the nuclear translocation of Nrf2 and increasing GSH synthesis, thus ameliorating oxidative stress and renal injury in diabetic rats. The enhanced function of Glo1 might, to some extent, account for the suppressive effects of glycine on the renal AGE/RAGE signaling pathway observed in our previous study. However, the favorable effects in the present study are limited to our model of diabetic rats, and the optimal serum levels of glycine in humans have not reached total agreement. Although further investigation is required, the role of glycine in attenuating glycation and restoring anti‐oxidant defense might provide new insights into the therapeutic options of diabetic nephropathy.
Disclosure
The authors declare no conflict of interest.
Acknowledgments
This work was supported by funding from the Clinical Medical Research of Chinese Medical Association (grant number 13040700455), China National Key R&D Program during the 13th Five‐year Plan (grant number 2016YFC1305401, 2016YFC1305405), and Beijing Municipal Science and Technology Project (grant number D17110000281701).
J Diabetes Investig 2019; 10: 1189–1198
References
- 1. Brownlee M. The pathobiology of diabetic complications: a unifying mechanism. Diabetes 2005; 54: 1615–1625. [DOI] [PubMed] [Google Scholar]
- 2. Forbes JM, Coughlan MT, Cooper ME. Oxidative stress as a major culprit in kidney disease in diabetes. Diabetes 2008; 57: 1446–1454. [DOI] [PubMed] [Google Scholar]
- 3. Koulis C, Watson AMD, Gray SP, et al Linking RAGE and Nox in diabetic micro‐ and macrovascular complications. Diabetes Metab 2015; 41: 272–281. [DOI] [PubMed] [Google Scholar]
- 4. Goldin A, Beckman JA, Schmidt AM, et al Advanced glycation end products: sparking the development of diabetic vascular injury. Circulation 2006; 114: 597–605. [DOI] [PubMed] [Google Scholar]
- 5. Giacco F, Brownlee M. Oxidative stress and diabetic complications. Circ Res 2010; 107: 1058–1070. [DOI] [PMC free article] [PubMed] [Google Scholar]
- 6. Schalkwijk CG. Vascular AGE‐ing by methylglyoxal: the past, the present and the future. Diabetologia 2015; 58: 1715–1719. [DOI] [PMC free article] [PubMed] [Google Scholar]
- 7. Nigro C, Leone A, Raciti GA, et al Methylglyoxal‐glyoxalase 1 balance: the root of vascular damage. Int J Mol Sci 2017; 18: 188. [DOI] [PMC free article] [PubMed] [Google Scholar]
- 8. McLellan AC, Thornalley PJ, Benn J, et al Glyoxalase system in clinical diabetes mellitus and correlation with diabetic complications. Clin Sci 1994; 87: 21–29. [DOI] [PubMed] [Google Scholar]
- 9. Giacco F, Du X, D'Agati VD, et al Knockdown of glyoxalase 1 mimics diabetic nephropathy in nondiabetic mice. Diabetes 2014; 63: 291–299. [DOI] [PMC free article] [PubMed] [Google Scholar]
- 10. Liu Y, Zhu X, Zhang L, et al Up‐regulation of glyoxalase 1 by mangiferin prevents diabetic nephropathy progression in streptozotocin‐induced diabetic rats. Eur J Pharmacol 2013; 721: 355–364. [DOI] [PubMed] [Google Scholar]
- 11. Brouwers O, Niessen PMG, Miyata T, et al Glyoxalase‐1 overexpression reduces endothelial dysfunction and attenuates early renal impairment in a rat model of diabetes. Diabetologia 2014; 57: 224–235. [DOI] [PubMed] [Google Scholar]
- 12. Xue M, Rabbani N, Momiji H, et al Transcriptional control of glyoxalase 1 by Nrf2 provides a stress‐responsive defence against dicarbonyl glycation. Biochem J 2012; 443: 213–222. [DOI] [PubMed] [Google Scholar]
- 13. Done AJ, Traustadóttir T. Nrf2 mediates redox adaptations to exercise. Redox Biol 2016; 10: 191–199. [DOI] [PMC free article] [PubMed] [Google Scholar]
- 14. Zoja C, Zanchi C, Benigni A. Key pathways in renal disease progression of experimental diabetes. Nephrol Dial Transplant 2015; 30(Suppl 4): v54–v59. [DOI] [PubMed] [Google Scholar]
- 15. Kim HJ, Vaziri ND. Contribution of impaired Nrf2‐Keap1 pathway to oxidative stress and inflammation in chronic renal failure. Am J Physiol‐Renal 2010; 298: F662–F671. [DOI] [PubMed] [Google Scholar]
- 16. Ruiz S, Pergola PE, Zager RA, et al Targeting the transcription factor Nrf2 to ameliorate oxidative stress and inflammation in chronic kidney disease. Kidney Int 2013; 83: 1029–1041. [DOI] [PMC free article] [PubMed] [Google Scholar]
- 17. Ramasamy R, Yan SF, Schmidt AM. Advanced glycation endproducts: from precursors to RAGE: round and round we go. Amino Acids 2012; 42: 1151–1161. [DOI] [PMC free article] [PubMed] [Google Scholar]
- 18. Nishimoto S, Koike S, Inoue N, et al Activation of Nrf2 attenuates carbonyl stress induced by methylglyoxal in human neuroblastoma cells: increase in GSH levels is a critical event for the detoxification mechanism. Biochem Bioph Res Co 2017; 483: 874–879. [DOI] [PubMed] [Google Scholar]
- 19. Kumar SM, Swaminathan K, Clemens DL, et al Modulation of GSH with exogenous agents leads to changes in glyoxalase 1 enzyme activity in VL‐17A cells exposed to chronic alcohol plus high glucose. Food Funct 2014; 5: 345–358. [DOI] [PubMed] [Google Scholar]
- 20. Thornalley PJ. Glyoxalase I–structure, function and a critical role in the enzymatic defence against glycation. Biochem Soc Trans 2003; 31: 1343–1348. [DOI] [PubMed] [Google Scholar]
- 21. Ruiz‐Ramírez A, Ortiz‐Balderas E, Cardozo‐Saldaña G, et al Glycine restores glutathione and protects against oxidative stress in vascular tissue from sucrose‐fed rats. Clin Sci 2014; 126: 19–29. [DOI] [PubMed] [Google Scholar]
- 22. Sekhar RV, McKay SV, Patel SG, et al Glutathione synthesis is diminished in patients with uncontrolled diabetes and restored by dietary supplementation with cysteine and glycine. Diabetes Care 2010; 34: 162–167. [DOI] [PMC free article] [PubMed] [Google Scholar]
- 23. El‐Hafidi M, Franco M, Ramírez AR, et al Glycine increases insulin sensitivity and glutathione biosynthesis and protects against oxidative stress in a model of sucrose‐induced insulin resistance. Oxid Med Cell Longev 2018; 2018: 1–12. [DOI] [PMC free article] [PubMed] [Google Scholar]
- 24. Wang Z, Zhang J, Wang L, et al Glycine mitigates renal oxidative stress by suppressing Nox4 expression in rats with streptozotocin‐induced diabetes. J Pharmacol Sci 2018; 137: 387–394. [DOI] [PubMed] [Google Scholar]
- 25. Li J, Zhang J, Chen L, et al [Glycine reduced renal lesions caused by AGEs in STZ‐induced diabetic rats]. Chin J Diabetes 2017; 6: 536–540 (Chinese) [Google Scholar]
- 26. Liu F, Lai S, Tong H, et al Release of free amino acids upon oxidation of peptides and proteins by hydroxyl radicals. Anal Bioanal Chem 2017; 409: 2411–2420. [DOI] [PMC free article] [PubMed] [Google Scholar]
- 27. Zhou X, Han D, Xu R, et al Glycine protects against high sucrose and high fat‐induced non‐alcoholic steatohepatitis in rats. Oncotarget 2016; 7: 80223–80237. [DOI] [PMC free article] [PubMed] [Google Scholar]
- 28. Alhasawi A, Castonguay Z, Appanna ND, et al Glycine metabolism and anti‐oxidative defence mechanisms in Pseudomonas fluorescens. Microbiol Res 2015; 171: 26–31. [DOI] [PubMed] [Google Scholar]
- 29. Wang W, Wu Z, Lin G, et al Glycine stimulates protein synthesis and inhibits oxidative stress in pig small intestinal epithelial cells. J Nutr 2014; 144: 1540–1548. [DOI] [PubMed] [Google Scholar]
- 30. Bahmani F, Bathaie SZ, Aldavood SJ, et al Glycine therapy inhibits the progression of cataract in streptozotocin‐induced diabetic rats. Mol Vis 2012; 18: 439–448. [PMC free article] [PubMed] [Google Scholar]
- 31. Alvarado‐Vásquez N, Lascurain R, Cerón E, et al Oral glycine administration attenuates diabetic complications in streptozotocin‐induced diabetic rats. Life Sci 2006; 79: 225–232. [DOI] [PubMed] [Google Scholar]
- 32. Alvarado‐Vásquez N, Zamudio P, Cerón E, et al Effect of glycine in streptozotocin‐induced diabetic rats. Comp Biochem Physiol C Toxicol Pharmacol 2003; 134: 521–527. [DOI] [PubMed] [Google Scholar]
- 33. Arai M, Nihonmatsu‐Kikuchi N, Itokawa M, et al Measurement of glyoxalase activities. Biochem Soc T 2014; 42: 491–494. [DOI] [PubMed] [Google Scholar]
- 34. Ramakrishnan S, Sulochana KN. Decrease in glycation of lens proteins by lysine and glycine by scavenging of glucose and possible mitigation of cataractogenesis. Exp Eye Res 1993; 57: 623–628. [DOI] [PubMed] [Google Scholar]
- 35. Maessen DEM, Stehouwer CDA, Schalkwijk CG. The role of methylglyoxal and the glyoxalase system in diabetes and other age‐related diseases. Clin Sci 2015; 128: 839–861. [DOI] [PubMed] [Google Scholar]
- 36. Jo‐Watanabe A, Ohse T, Nishimatsu H, et al Glyoxalase I reduces glycative and oxidative stress and prevents age‐related endothelial dysfunction through modulation of endothelial nitric oxide synthase phosphorylation. Aging Cell 2014; 13: 519–528. [DOI] [PMC free article] [PubMed] [Google Scholar]
- 37. Berner AK, Brouwers O, Pringle R, et al Protection against methylglyoxal‐derived AGEs by regulation of glyoxalase 1 prevents retinal neuroglial and vasodegenerative pathology. Diabetologia 2012; 55: 845–854. [DOI] [PubMed] [Google Scholar]
- 38. Yao D, Brownlee M. Hyperglycemia‐induced reactive oxygen species increase expression of the receptor for advanced glycation end products (RAGE) and RAGE ligands. Diabetes 2010; 59: 249–255. [DOI] [PMC free article] [PubMed] [Google Scholar]
- 39. Shinohara M, Thornalley PJ, Giardino I, et al Overexpression of glyoxalase‐I in bovine endothelial cells inhibits intracellular advanced glycation endproduct formation and prevents hyperglycemia‐induced increases in macromolecular endocytosis. J Clin Invest 1998; 101: 1142–1147. [DOI] [PMC free article] [PubMed] [Google Scholar]
- 40. Beisswenger PJ, Drummond KS, Nelson RG, et al Susceptibility to diabetic nephropathy is related to dicarbonyl and oxidative stress. Diabetes 2005; 54: 3274–3281. [DOI] [PubMed] [Google Scholar]
- 41. Liu Y, Cheng Y, Liu X, et al Mangiferin upregulates glyoxalase 1 through activation of Nrf2/ARE signaling in central neurons cultured with high glucose. Mol Neurobiol 2016; 54: 4060–4070. [DOI] [PubMed] [Google Scholar]
- 42. Cheng AS, Cheng YH, Chiou CH, et al Resveratrol upregulates Nrf2 expression to attenuate methylglyoxal‐induced insulin resistance in Hep G2 cells. J Agric Food Chem 2012; 60: 9180–9187. [DOI] [PubMed] [Google Scholar]
- 43. Zhu X, Cheng Y, Lu Q, et al Enhancement of glyoxalase 1, a polyfunctional defense enzyme, by quercetin in the brain in streptozotocin‐induced diabetic rats. Naunyn‐Schmiedeberg's Arch Pharmacol 2018; 391: 1237–1245. [DOI] [PubMed] [Google Scholar]
- 44. Shi Y, Liang XC, Zhang H, et al Quercetin protects rat dorsal root ganglion neurons against high glucose‐induced injury in vitro through Nrf‐2/HO‐1 activation and NF‐kappaB inhibition. Acta Pharmacol Sin 2013; 34: 1140–1148. [DOI] [PMC free article] [PubMed] [Google Scholar]
- 45. Yao P, Nussler A, Liu L, et al Quercetin protects human hepatocytes from ethanol‐derived oxidative stress by inducing heme oxygenase‐1 via the MAPK/Nrf2 pathways. J Hepatol 2007; 47: 253–261. [DOI] [PubMed] [Google Scholar]
- 46. Loven D, Schedl H, Wilson H, et al Effect of insulin and oral glutathione on glutathione levels and superoxide dismutase activities in organs of rats with streptozocin‐induced diabetes. Diabetes 1986; 35: 503–507. [DOI] [PubMed] [Google Scholar]
- 47. Forman HJ, Augusto O, Brigelius‐Flohe R, et al Even free radicals should follow some rules: a Guide to free radical research terminology and methodology. Free Radical Bio Med 2015; 78: 233–235. [DOI] [PubMed] [Google Scholar]
- 48. Xiao Y, Fu X, Pattengale P, et al A sensitive LC‐MS/MS method for the quantification of urinary 8‐iso‐prostaglandin F2alpha (8‐iso‐PGF2alpha) including pediatric reference interval. Clin Chim Acta 2016; 460: 128–134. [DOI] [PubMed] [Google Scholar]
- 49. Pérez‐Torres I, Ibarra B, Soria‐Castro E, et al Effect of glycine on the cyclooxygenase pathway of the kidney arachidonic acid metabolism in a rat model of metabolic syndrome. Can J Physiol Pharm 2011; 89: 899–910. [DOI] [PubMed] [Google Scholar]
- 50. Breggia AC, Himmelfarb J. Primary mouse renal tubular epithelial cells have variable injury tolerance to ischemic and chemical mediators of oxidative stress. Oxid Med Cell Longev 2008; 1: 33–38. [DOI] [PMC free article] [PubMed] [Google Scholar]
- 51. Zheng H, Whitman SA, Wu W, et al Therapeutic potential of Nrf2 activators in streptozotocin‐induced diabetic nephropathy. Diabetes 2011; 60: 3055–3066. [DOI] [PMC free article] [PubMed] [Google Scholar]
- 52. Chen L, Zhang J, Li C, et al Glycine Transporter‐1 and glycine receptor mediate the antioxidant effect of glycine in diabetic rat islets and INS‐1 cells. Free Radic Biol Med 2018; 123: 53–61. [DOI] [PubMed] [Google Scholar]
- 53. McCarty MF, O'Keefe JH, DiNicolantonio JJ. Dietary glycine is rate‐limiting for glutathione synthesis and may have broad potential for health protection. Ochsner J 2018; 18: 81–87. [PMC free article] [PubMed] [Google Scholar]