

Abstract
The aim of this study was to investigate the impact of hypoxia and hypotension during the agonal phase of donor warm ischemia time (DWIT) on hepatic ischemia/reperfusion injury (IRI) and complications in donation after circulatory death (DCD) liver transplantation. A retrospective single‐center study of 93 DCD liver transplants (Maastricht type III) was performed. DWIT was divided into 2 periods: the agonal phase (from withdrawal of treatment [WoT] until circulatory arrest) and the asystolic phase (circulatory arrest until cold perfusion). A drop to <80% in peripheral oxygenation (SpO2) was considered as hypoxia in the agonal phase (SpO2‐agonal) and a drop to <50 mm Hg as hypotension in the agonal phase (SBP‐agonal). Peak postoperative aspartate transaminase level >3000 U/L was considered as severe hepatic IRI. SpO2 dropped within 2 minutes after WoT <80%, whereas the systolic blood pressure dropped to <50 mm Hg after 9 minutes, resulting in a longer SpO2‐agonal (13 minutes) than SBP‐agonal (6 minutes). In multiple logistic regression analysis, only duration of SpO2‐agonal was associated with severe hepatic IRI (P = 0.006) and not SBP‐agonal (P = 0.32). Also, recipients with long SpO2‐agonal (>13 minutes) had more complications with a higher Comprehensive Complication Index during hospital admission (43.0 versus 32.0; P = 0.002) and 90‐day graft loss (26% versus 6%; P = 0.01), compared with recipients with a short SpO2‐agonal (≤13 minutes). Furthermore, Cox proportional hazard modeling identified a long SpO2‐agonal as a risk factor for longterm graft loss (hazard ratio, 3.30; 95% confidence interval, 1.15‐9.48; P = 0.03). In conclusion, the onset of hypoxia during the agonal phase is related to the severity of hepatic IRI and postoperative complications. Therefore, SpO2 <80% should be considered as the start of functional DWIT in DCD liver transplantation.
Abbreviations
- AST
aspartate transaminase
- BMI
body mass index
- CI
confidence interval
- CCI
Comprehensive Complication Index
- DCD
donation after circulatory death
- DWIT
donor warm ischemia time
- EAD
early allograft dysfunction
- FFP
fresh frozen plasma
- HAT
hepatic artery thrombosis
- HR
hazard ratio
- ICU
intensive care unit
- IQR
interquartile range
- IRI
ischemia/reperfusion injury
- ITBL
ischemic‐type biliary lesions
- LOESS
locally weighted scatter‐plot smoother
- MAP
mean arterial pressure
- MELD
Model for End‐Stage Liver Disease
- OR
odds ratio
- PNF
primary nonfunction
- PRS
postreperfusion syndrome
- RBC
red blood cell
- RWIT
recipient warm ischemia time
- SBP
systolic blood pressure
- SBP‐agonal
hypotension in the agonal phase
- SD
standard deviation
- SpO2
peripheral oxygenation
- SpO2‐agonal
hypoxia in the agonal phase
- UW
University of Wisconsin
- WoT
withdrawal of treatment
Donation after circulatory death (DCD) grafts are increasingly being used in liver transplantation, and in some European countries, more than one‐third of the deceased donor liver transplants are performed with DCD grafts.1, 2, 3 Nonetheless, the use of these marginal grafts is associated with various biliary and renal complications, resulting in inferior survival rates, compared with donation after brain death grafts.4, 5, 6, 7, 8, 9, 10, 11
The inferior results are likely the consequence of the obligatory donor warm ischemia time (DWIT). This extra period of warm ischemia in DCD grafts is thought to aggravate hepatic ischemia/reperfusion injury (IRI).12, 13 In previous studies, duration of DWIT has been linked to biliary complications and impaired graft survival.9, 10, 11, 12, 13 In general, DWIT consists of 2 periods (Fig. 1A): the agonal phase (from withdrawal of treatment [WoT] until circulatory arrest) and the asystolic phase (from circulatory arrest until cold perfusion). However, multiple definitions for DWIT are currently being used.14 The trajectory of the agonal phase differs widely between donors, and the exact moment of onset of hepatic tissue injury is still unknown. Furthermore, the lack of a uniform definition for the onset of DWIT compromises evaluation of its impact on recipient outcomes. Earlier studies, primarily focusing on the blood pressure during the agonal phase, yielded varying results on its relation to postoperative complications.15, 16, 17, 18 Abt et al. showed that a slow decline in systolic blood pressure (SBP) during the agonal phase is correlated with longterm graft loss. Therefore, SBP is frequently used to mark the beginning of functional DWIT. However, from our clinical experience, we have noticed that the peripheral oxygenation (SpO2) drops much quicker than SBP during the agonal phase. We therefore hypothesize that ischemic hepatic injury is more closely related to the onset of hypoxia, rather than hypotension during the agonal phase.
Figure 1.
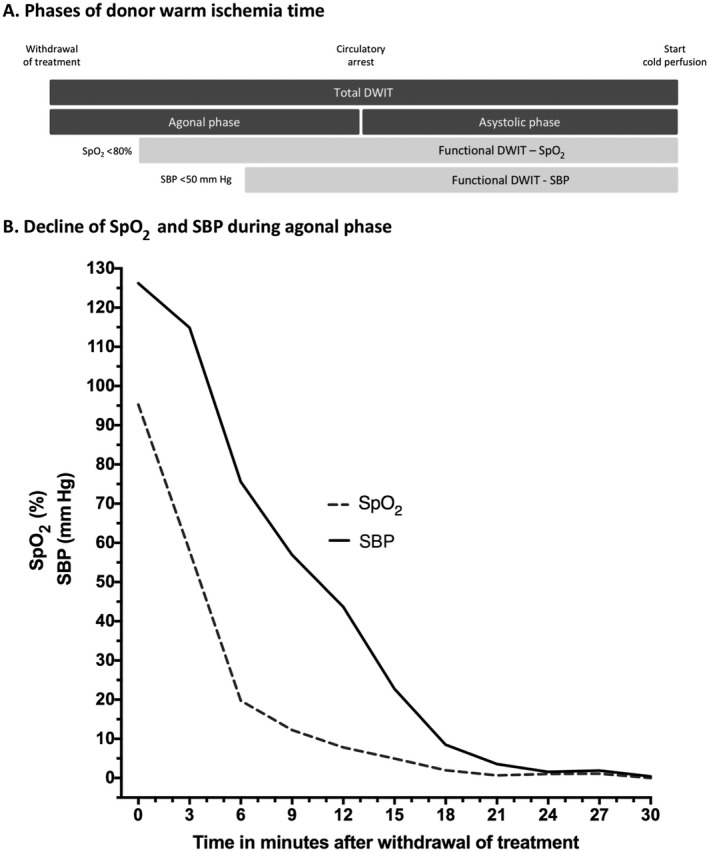
DWIT in DCD liver transplantation. (A) The phases of donor warm ischemia; (B) the decline of SpO2‐agonal and SBP‐agonal.
The aim of this study is, first, to explore the relation between vital parameters during the agonal phase and hepatic IRI and observe potential cutoff points for the start of functional DWIT. Second, we will explore the relation between the agonal phase and recipient outcome in DCD liver transplantation.
1. Patients and Methods
This retrospective study was performed with the approval of the Erasmus University Medical Center institutional review board (registration number: EMC‐2014‐670). All consecutive adult patients who underwent DCD liver transplantation in our center from July 2008 to March 2016 were included. All DCD grafts were retrieved from Maastricht type III donors. Exclusion criteria were retransplantation and liver transplantation for acute liver failure. None of the grafts were machine perfused. In the Netherlands, DCD donors older than 60 years of age or with a body mass index (BMI) > 28 kg/m2 are regularly not considered for liver donation. Also, we allocate DCD livers preferably to recipients with hepatocellular carcinoma and/or a relatively low biological Model for End‐Stage Liver Disease (MELD) score of <20. The donor risk index was calculated to express graft quality.19 The amount of graft steatosis was assessed in biopsies taken after reperfusion.
Data following length and structure of different phases of DWIT were retrieved from the Eurotransplant database. An overview of DWIT is displayed in Fig. 1A. The cutoff time points were considered at <80% for hypoxia in the agonal phase (SpO2‐agonal) and <50 mm Hg for hypotension in the agonal phase (SBP‐agonal). DCD grafts used in this study come from donors in the Netherlands only and are offered through the Eurotransplant waiting list on the basis of MELD status. In the Netherlands, WoT of the donor is the responsibility of the intensive care unit (ICU). After circulatory arrest, there is an obligatory 5 minutes waiting time, after which the donor is declared deceased and transported to the operation theatre (5‐10 minutes) for organ procurement, using the super‐rapid retrieval technique.20
The first flush (6‐8 L) is performed with University of Wisconsin (UW) preservation fluid under a pressure of 200 mm Hg via the aorta. The portal vein, hepatic artery, and biliary tract are additionally flushed at the back table with UW as well. The standard surgical technique included piggyback cavocaval anastomosis with only incidental use of a portocaval shunt, and the graft was routinely reperfused via the portal vein. The length of the surgical procedure, cold ischemia time, recipient warm ischemia time (RWIT), intraoperative blood loss with subsequent transfusion of red blood cell (RBC) concentrates, fresh frozen plasma (FFP), and end of surgery requirement of vasopressors were all recorded. The postreperfusion syndrome (PRS) was defined as a >30% drop in mean arterial pressure (MAP) in the 5 minutes after reperfusion, lasting at least 1 minute.21 The peak aspartate transaminase (AST) level in the first 72 postoperative hours was used as a marker for severity of hepatic IRI, a known marker for early allograft dysfunction (EAD) as well.22 The standard immunosuppression regimen in our center is based on the triple therapy strategy: prednisolone and mycophenolate mofetil from day 0, basiliximab at day 0 and day 4, and the introduction of tacrolimus on postoperative day 5. Length of hospital and ICU admission, recipient and graft survival were all documented to assess postoperative morbidity and mortality. All major postoperative complications in the first year were documented. Major postoperative complications were defined as grade ≥3b by the Clavien‐Dindo classification, and the Comprehensive Complication Index (CCI) was calculated at hospital discharge, 6 months, and 12 months after transplantation.23, 24
1.1. Statistical Analysis
Data were analyzed with IBM SPSS Statistics, version 24 (IBM, Armonk, NY). Student t test was used to compare normally distributed continuous variables. Nonparametric continuous variables were compared using the Mann‐Whitney U test. To compare categorical variables, the chi‐square test or Fisher’s exact test was used. P values <0.05 were considered statistically significant. Continuous variables were expressed as mean with standard deviation (SD) or median and interquartile range (IQR), where appropriate. A multiple logistic regression analysis was used to identify donor, DWIT, and surgical risk factors associated with severe hepatic IRI (peak serum AST > 3000 U/L). Two‐year graft and patient survival rates were estimated using Kaplan‐Meier methods. A Cox proportional hazard model was used to identify donor, surgical, and recipient factors associated with graft loss within the first 2 years after transplantation.
2. Results
2.1. Patient Selection
During the study period, 105 patients underwent DCD liver transplantation of whom 93 were included. A total of 2 patients were excluded because of retransplantation, and 1 recipient was transplanted for acute liver failure. In 8 patients, the length of DWIT and donor’s hemodynamic profile data were missing. In 1 patient, intraoperative data were not complete.
2.2. Baseline Characteristics
Baseline characteristics are displayed in Table 1. Median recipient age was 57 years, and 70% of the recipients were male. Viral hepatitis was the most common diagnosis of liver disease (27%), followed by alcohol‐related cirrhosis (22%), and biliary cirrhosis (17%). Mean preoperative laboratory MELD score was 15. Median donor age was 47 years, and 58% of the donors were male. The mean donor risk index was 2.6. Mean length of total DWIT and asystolic phase were 32 and 16 minutes, respectively. Average length of the total agonal phase was also 16 minutes. Notably, a variety in dispersion of the DWIT phases was observed (Table 1). The SD and range in the agonal phase were longer than in the asystolic phase. SpO2 dropped already 2 minutes after WoT below 80%, whereas the SBP dropped below 50 mm Hg after 9 minutes (Fig. 1B), resulting in a longer SpO2‐agonal (13 minutes) than SBP‐agonal (6 minutes). Also, the dispersion of SpO2‐agonal was greater than the SBP‐agonal, with larger SD and range. The mean time between the drop in SpO2 and SBP was 7 minutes. The mean length of cold ischemia time and RWIT was 6.6 hours and 29 minutes, respectively.
Table 1.
Baseline Donor, Recipient, and Surgical Characteristics in DCD Liver Transplantation
| Total (n = 93) | |
|---|---|
| Donor | |
| Donor risk index | 2.6 ± 0.5 |
| Age, years | 47 (39‐53) |
| Sex, male | 54 (58) |
| BMI, kg/m2 | 24.2 (22.0‐26.0) |
| Serum AST, U/L | 46 (29‐89) |
| Graft steatosis | |
| None | 53 (57) |
| 1%‐10% | 33 (36) |
| 11%‐33% | 4 (4) |
| >33% | 3 (3) |
| Total DWIT | 32 (32; 12‐60) |
| Asystolic phase | 16 (15; 7‐28) |
| Agonal phase | |
| Total agonal phase | 16 (15; 4‐39) |
| SpO2‐agonal | 13 (12; 2‐38) |
| SBP‐agonal | 6 (5; 1‐17) |
| Between SpO2 and SBP‐agonal | 7 (6; 0‐24) |
| Recipient | |
| Age, years | 57 (49‐63) |
| Sex, male | 65 (70) |
| BMI, kg/m2 | 26.5 ± 4.3 |
| Etiology of liver disease | |
| Biliary cirrhosis | 16 (17) |
| Viral hepatitis | 25 (27) |
| Postalcoholic cirrhosis | 20 (22) |
| Other | 32 (34) |
| Hepatocellular carcinoma | 31 (33) |
| Laboratory MELD score | 15 (7.8) |
| Sodium, mmol/L | 138 (134‐140) |
| Medical history | |
| Hypertension | 19 (20) |
| Coronary artery disease | 2 (2) |
| Diabetes mellitus | 29 (31) |
| Operation time, hours | 7.9 (7.7; 6‐12) |
| Cold ischemia time, hours | 6.6 (6.4; 4‐12) |
| RWIT, minutes | 29 (28; 17‐61) |
| Blood loss, liters | 4.1 (3.2‐6.2) |
| RBC transfusion, units | 3 (1‐5) |
| FFP transfusion, units | 3 (0‐6) |
| PRS | 37 (40) |
| Dose norepinephrine end of surgery (ug/kg/minute) | 0.30 (0.12‐0.50) |
| EAD | 56 (60) |
| Postoperative peak serum AST, U/L | 2287 (1305‐4881) |
| Peak serum AST in categories | |
| 0‐3000 U/L | 53 (57) |
| >3000 U/L | 40 (43) |
Continuous variables are displayed as mean ± SD, median (IQR), and n (%) where appropriate. Values of DWIT and intraoperative periods are displayed as follows: mean (median; range).
2.3. Length of Ischemia Periods and Hepatic IRI
More than half of the recipients developed EAD (60%) according to the Olthoff criteria22 because of the relatively high peak AST levels (median, 2287 U/L) in the first days after DCD liver transplantation. Therefore, this parameter was not considered suitable to quantify hepatic IRI. Instead, we used a cutoff of 3000 U/L in peak AST in the first 72 hours after transplantation. The peak AST was >3000 U/L in 43% of the recipients. Univariate analysis of risk factors associated with severe hepatic IRI (Table 2) showed that length of total agonal phase was significantly associated with a peak AST > 3000 U/L (odds ratio [OR], 1.08; 95% confidence interval [CI], 1.01‐1.14; P = 0.01), but the correlation for SpO2‐agonal was even stronger (OR, 1.11; 95% CI, 1.01‐1.20; P = 0.004). No relation was observed for SBP‐agonal and severe hepatic IRI (P = 0.41). Multivariate analysis of the same risk factors was used to correct for potential confounders in relation to severe hepatic IRI. Two multivariate analyses were performed, both with all factors of the univariate analysis and either with the SpO2‐agonal or SBP‐agonal period (Table 2). In Table 2, the agonal phase for the multivariate analysis for SpO2‐agonal is split into the time before and after the drop <80% in SpO2, and the agonal phase in the multivariate analysis for SBP agonal is also split using the drop in SBP <50 mm Hg. Multivariate analysis for SpO2‐agonal shows that only the SpO2‐agonal is related to severe hepatic IRI (P = 0.006) and not the period before the drop in SpO2 (P = 0.26). On the contrary, the multivariate analysis for SBP‐agonal shows that the length of the SBP‐agonal period was not an independent factor (P = 0.32), whereas the period between the drop in SpO2 and the drop in SBP was significantly related to severe hepatic IRI (hypoxic agonal phase; P = 0.003).
Table 2.
Univariate and Multivariate Analysis of Risk Factors Associated With Severe Hepatic IRI in DCD Liver Transplantation
| Univariate Analysis* | Multivariate Analysis for SpO2‐Agonal† | Multivariate Analysis for SBP‐Agonal‡ | |||||||
|---|---|---|---|---|---|---|---|---|---|
| Donor | OR | 95% CI | P Value | OR | 95% CI | P Value | OR | 95% CI | P Value |
| Age, years | 1.03 | 1.00‐1.06 | 0.086 | 1.05 | 0.98‐1.12 | 0.10 | 1.05 | 0.98‐1.12 | 0.20 |
| Sex, female | 0.67 | 0.29‐1.53 | 0.34 | 0.43 | 0.13‐1.43 | 0.10 | 0.51 | 0.15‐1.74 | 0.29 |
| BMI | 1.06 | 0.95‐1.18 | 0.30 | 0.87 | 0.72‐1.06 | 0.19 | 0.88 | 0.73‐1.06 | 0.19 |
| Donor risk index | 0.75 | 0.30‐1.85 | 0.53 | 0.51 | 0.08‐3.42 | 0.37 | 0.48 | 0.07‐3.43 | 0.46 |
| Graft steatosis | |||||||||
| No steatosis | 1.00 | 1.00 | 1.00 | ||||||
| Steatosis 1%‐10% | 2.54 | 1.04‐6.22 | 0.04 | 2.57 | 0.83‐7.92 | 0.09 | 2.43 | 0.78‐7.63 | 0.13 |
| Steatosis >10% | 5.29 | 0.93‐30.11 | 0.06 | 9.17 | 1.32‐63.94 | 0.02 | 8.80 | 1.26‐61.32 | 0.03 |
| DWIT | |||||||||
| Agonal phase | |||||||||
| Total agonal phase | 1.08 | 1.01‐1.14 | 0.01 | ||||||
| SpO2‐agonal | 1.11 | 1.04‐1.20 | 0.004 | 1.14 | 1.04‐1.26 | 0.006 | |||
| SBP‐agonal | 1.04 | 0.94‐1.15 | 0.41 | 1.07 | 0.94‐1.23 | 0.32 | |||
| Before SpO2‐agonal | 0.88 | 0.70‐1.10 | 0.26 | 0.89 | 0.71‐1.11 | 0.30 | |||
| SpO2‐agonal | |||||||||
| Between SpO2 and SBP‐agonal | 1.19 | 1.06‐1.34 | 0.003 | ||||||
| Asystolic phase | 1.05 | 0.96‐1.15 | 0.32 | 1.08 | 0.99‐1.13 | 0.37 | 1.11 | 0.97‐1.28 | 0.13 |
| Intraoperative | |||||||||
| Cold ischemia time | 0.97 | 0.69‐1.35 | 0.84 | 1.09 | 0.73‐1.70 | 0.63 | 1.09 | 0.71‐1.69 | 0.69 |
| RWIT | 1.05 | 1.00‐1.11 | 0.07 | 1.06 | 0.99‐1.13 | 0.07 | 1.06 | 0.99‐1.14 | 0.10 |
| RBC transfusion | 0.97 | 0.87‐1.10 | 0.65 | 0.93 | 0.84‐1.13 | 0.75 | 0.91 | 0.77‐1.08 | 0.27 |
*Univariate analysis of factors associated with severe hepatic IRI (peak postoperative AST > 3000 U/L).
Multivariate analysis with agonal phases split at the cutoff of saturation drop below 80%.
Multivariate analysis with agonal phases split at the cutoff of SBP below 50 mm Hg.
2.4. Length of SpO2‐Agonal and Clinically Relevant Outcome Parameters
2.4.1. Early Postoperative Complications
Table 3 displays the recipient outcome for the length of SpO2‐agonal. After visualization of locally weighted scatter‐plot smoother (LOESS) plots, the SpO2‐agonal was divided into 2 groups at the mean of 13 minutes. Recipients with a long SpO2‐agonal had significantly more postoperative complications and a longer length of stay, for both ICU and hospital admission. The CCI was measured at hospital discharge, 6 months, and 1 year after transplantation and at each moment the CCI was significantly higher in recipients with a long SpO2‐agonal. Also, recipients in the long SpO2‐agonal group experienced more 90‐day graft loss (26% versus 6%; P = 0.01). Three recipients had postoperative primary nonfunction (PNF) of the graft requiring retransplanation, and all of them had a long SpO2‐agonal. Surprisingly, no correlation was observed between length of SpO2‐agonal and development of biliary complications in the first year after transplantation.
Table 3.
Duration of SpO2‐Agonal and Recipient Outcomes in the First Year After DCD Liver Transplantation
| Length of SpO2‐Agonal | <13 minutes (n = 47) | ≥13 minutes (n = 46) | Total (n = 93) | P Value |
|---|---|---|---|---|
| In‐hospital | ||||
| ≥1 Major postoperative complication* | 10 (21) | 25 (54) | 35 (385) | 0.001 |
| Length of ICU admission (days) | 2 (2‐3) | 3 (2‐6) | 2 (2‐4) | 0.02 |
| Length of hospital admission (days) | 16 (14‐22) | 22 (17‐29) | 18 (15‐26) | 0.009 |
| CCI, median | ||||
| In‐hospital | 32.0 | 43.0 | 38.1 | 0.002 |
| 6 months | 46.0 | 58.4 | 48.2 | 0.006 |
| 1 year | 48.0 | 62.8 | 59.7 | 0.008 |
| 90‐day graft loss | 3 (6) | 12 (26) | 15 (16) | 0.01 |
| Retransplantation for HAT | 2 (4) | 3 (7) | 5 (5) | |
| Retransplantation for PNF | 0 | 3 (7) | 3 (3) | |
| Retransplantation for ITBL | 0 | 1 (2) | 1 (1) | |
| Death | 1 (2) | 5 (11) | 6 (6) | |
| Biliary complications in the first year | ||||
| Overall biliary complications† | 17 (36) | 18 (39) | 35 (38) | 0.77 |
| Anastomotic strictures‡ | 12 (26) | 12 (26) | 24 (26) | 0.95 |
| ITBL | 6 (13) | 5 (11) | 11 (11) | 0.78 |
| Retransplantation for ITBL | 1 (2) | 2 (4) | 3 (3) | 0.62 |
Data are given as n (%) and median (IQR), unless otherwise noted.
Major postoperative complication was defined as a Clavien‐Dindo classification ≥3B: reoperation or ICU readmittance.
Including all biliary complications requiring at least medical treatment (ie, antibiotics/ursodeoxycholic acid).
Requiring at least endoscopic treatment.
2.4.2. Longterm Graft Loss
The median follow‐up was 2.2 years. The estimated 2‐year graft and patient survival was 79% and 86%, respectively. Figure 2 shows the 2‐year graft survival for recipients with a short and long SpO2‐agonal. Recipients with a long SpO2‐agonal had the worst survival rate (70% versus 87%; P = 0.03). No difference was observed in 2‐year patient survival for recipients with a short (92%) and long (80%) SBP‐agonal (P = 0.12). The Cox proportional hazard model (Table 4) for graft loss in the first 2 years after transplantation showed that a long SpO2‐agonal leads to a 3‐fold increase in hazard ratio (HR) for graft loss (HR, 3.30; 95% CI, 1.15‐9.48; P = 0.03). Increasing recipient BMI was the other independent factor in this model (HR, 1.13; 95% CI, 1.02‐1.26; P = 0.02).
Figure 2.
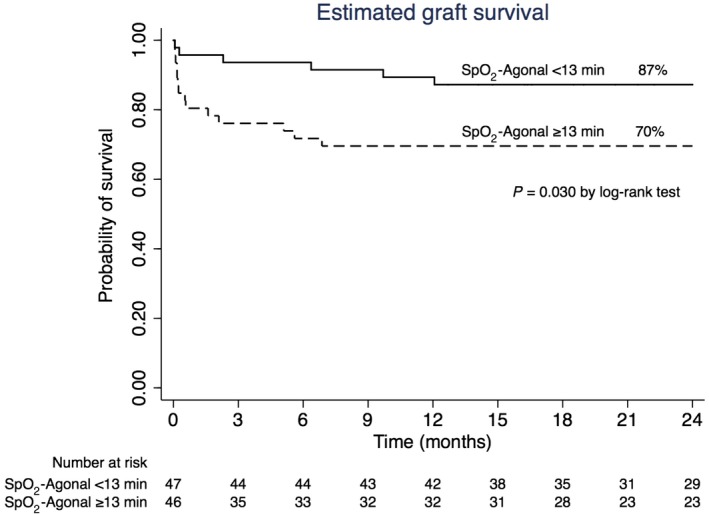
Kaplan‐Meier curve for length of SpO2‐agonal and graft survival after DCD liver transplantation.
Table 4.
Cox Proportional Hazard Model for Graft Loss After DCD Liver Transplantation
| HR | 95% CI | P Value | |
|---|---|---|---|
| Recipient | |||
| Age | 1.01 | 0.96‐1.07 | 0.63 |
| BMI | 1.13 | 1.02‐1.26 | 0.02 |
| Laboratory MELD | 0.99 | 0.92‐1.08 | 0.97 |
| Hepatocellular carcinoma | 0.28 | 0.07‐1.15 | 0.08 |
| Donor | |||
| Donor risk index | 0.91 | 0.30‐2.75 | 0.87 |
| Graft steatosis | |||
| None | 1.00 | ||
| 1%‐10% | 1.84 | 0.70‐4.79 | 0.21 |
| >10% | 4.11 | 0.77‐22.01 | 0.09 |
| Ischemia periods | |||
| DWIT ‐ SpO2‐Agonal | |||
| <13 minutes | 1.00 | ||
| ≥13 minutes | 3.30 | 1.15‐9.48 | 0.03 |
| DWIT ‐ asystolic phase | 1.06 | 0.94‐1.20 | 0.33 |
| Cold ischemia time | 1.02 | 0.95‐1.08 | 0.64 |
| RWIT | 1.23 | 0.89‐1.71 | 0.20 |
3. Discussion
This study provides new insight in the impact of vital parameters during the agonal phase on hepatic IRI in DCD liver transplantation. Our findings confirm the hypothesis that ischemic hepatic injury is more closely related to the onset of hypoxia, rather than hypotension. Similarly, in regular medical practice we fear hypoxia for damaging a patient’s organs, whereas a short period of severe hypotension is tolerated much better. Therefore, we hypothesized that hypoxia would be more detrimental to DCD donor livers than hypotension during the agonal phase, and our results indicate that the drop in SpO2 to <80% is much more relevant to assess the potential severity of hepatic IRI. Moreover, a prolonged SpO2‐agonal is associated with more postoperative complications and longterm graft failure.
Previous studies have used many different definitions for DWIT, and consequently, the length of an acceptable DWIT in these studies ranges from 10 to 35 minutes.15, 17, 25, 26, 27 The study by Abt et al. showed that a quick drop in SBP after WoT was associated with an improved graft survival.(15) Hong et al. identified a period of MAP < 60 mm Hg before circulatory arrest longer than 20 minutes increased the risk for graft loss.(17) Notably, the course of SpO2 was not considered in these studies. In a study by Firl et al., the trajectory of the agonal phase was divided into 3 categories by the course of SpO2 and MAP: a quick decline, a slow gradual decline, and a relatively long stable phase with initial good vital parameters with a quick decline just before circulatory arrest.16 The authors were not able to form strong conclusions about donors with the worst prognosis, but in donors with a slow decline, only the course of MAP was associated with graft loss. The course of SpO2 was not associated with graft loss, but it should be noted that pulse oximetry measurement of SpO2 is not reliable below a value of 80%.28, 29, 30 A more recent multicenter study by Coffey et al. investigated the relation between potential cutoffs of SpO2 and MAP and a composite endpoint consisting of early and late complications.31 Only the cutoff of SpO2 <60% was associated with postoperative complications, but these results were not confirmed in a multivariate analysis. Important pitfalls of this study are the low SpO2 cutoff of 60%, the uniform outcome that weakens the potential effect on different complications, and the lack of an analysis of the relation between DWIT and hepatic IRI.
In many countries, the cutoff for discarding a DCD liver is 30 minutes of functional DWIT (start of agonal phase at SBP <50 mm Hg until cold perfusion), and we also analyzed these periods with this cutoff for SBP. The cutoff for SpO2 was set at 80% because the accuracy of pulse oximetry decreases significantly with arterial hemoglobin saturation levels below 75%‐80%. Using these cutoffs, the onset of hypoxia was on average almost directly after WoT and 7 minutes earlier than hypotension, leading to a much longer SpO2‐agonal than SBP‐agonal period. In the multivariate analysis, only the duration of the SpO2‐agonal was associated with severe hepatic IRI. More importantly, the period between the drop in SpO2 and SBP (hypoxic agonal phase) was actually the period related to severe hepatic IRI in this multivariate model, suggesting that an agonal phase starting with a long hypoxic period is the driving force of the extra hepatic IRI in DCD grafts. These results are supported by studies investigating shock livers suggesting that hypoxia is an important cause for hepatic injury, even without hemodynamic shock.32 The increased hepatic IRI with the use of DCD grafts has previously been linked to impaired outcomes.13, 33, 34, 35 We found that recipients of a graft with an SpO2‐agonal period longer than 13 minutes had more major complications, a higher CCI, and more graft loss in the first 90 days. Moreover, the 3 recipients with PNF all had an SpO2‐agonal of ≥13 minutes. Considering that the sum of the SpO2‐agonal (13 minutes) and asystolic phase (16 minutes) is 29 minutes, we would advise setting the new cutoff for functional DWIT at 30 minutes.
The severity of hepatic IRI and complications has a multifactorial origin. Steatotic grafts are more vulnerable to IRI, and graft steatosis was a significant factor in our multivariate analysis as well.36, 37 We also observed a trend for increased RWIT, a known factor to increase hepatic IRI.38 Remarkably, the length of the asystolic phase was not significant. This might be caused by the relatively narrow dispersion of this phase, reflecting the legal 5 minutes no‐touch period, transport of the donor, and cannulation time of the dedicated organ retrieval team, thus almost standardizing this period in all donors. Cold ischemia was not a factor, which could be explained by the relatively short cold ischemia time (mean, <6.5 hours). The molecular pathways that could potentially explain our results regarding the importance of hypoxia have been previously studied before in renal transplantation by Damman et al.39 In this human study, transcriptomics of donor biopsies during retrieval and transplantation followed by functional pathway analysis showed that pathways related to prolonged and worsening deprivation of oxygen were associated with delayed graft function in DCD grafts. These pathways were already up‐regulated before organ retrieval and included metabolic pathways related to hypoxia and the complement‐and‐coagulation cascades. After reperfusion, these pathways were related to delayed kidney graft function. Furthermore, an experimental study in a rat liver transplant model with simulated prolonged warm ischemia time by Zhang et al. confirmed that these complement‐associated pathways are an important factor in the severity of hepatic IRI.40 To our knowledge, such analyses of prolonged warm ischemia have not yet been performed in human liver transplantation. However, these studies confirm that hypoxia is an important factor in the warm phase of IRI. Interestingly, the duration of SpO2‐agonal was not related to the development of biliary complications in our study. It is known that the biliary tree responds differently to ischemia than hepatocytes, and previous experimental studies suggested that they are better resistant to hypoxia but more susceptible to reoxygenation injury.41, 42 Taner et al. studied the impact of DWIT on ischemic‐type biliary lesions (ITBLs) and only observed a relation between the length of the asystolic phase and the development of ITBL.10 This implicates that the biliary tree is less affected by hypoxia or hypotension during the agonal phase, compared with the full no‐flow ischemia during the asystolic phase. Even though there was no relation between the length of SpO2‐agonal and biliary complications, the 90‐day outcomes and longterm survival rates were worse for grafts with a long SpO2‐agonal because of an increased rate of hepatic artery thrombosis (HAT) and PNF.
There are several limitations to this study. The retrospective design of this study means that recipient perioperative management varies, but our institution has a well‐implemented liver transplant protocol and has done over 1000 liver transplants. Donor data were retrieved from Eurotransplant, which has a well‐organized database. However, in the first years of DCD organ retrieval, not all DWIT data were available, and we had to exclude 8 patients. Peak serum AST levels are a surrogate marker for hepatic IRI, also depending on the weight of the donor liver. The only alternative option would be a histological assessment, but this would be subject to the interpretation by different pathologists. We specifically did not use the classic Olthoff criteria for EAD because we have observed that median peak AST levels are above 2000 U/L in the majority of DCD recipients. This study is reflecting the practice in the Netherlands, which can be different from other countries.
We believe our study provides strong evidence that hypoxia, rather than hypotension, marks the beginning of hepatic tissue injury in DCD grafts. We advise transplant professionals to consider functional DWIT as the period between SpO2 <80% and start of cold perfusion, regardless of blood pressure. The length of hypoxia during the agonal phase over 13 minutes could identify potential poor‐quality grafts and thereby enable the transplant surgeons to apply graft‐improving methods such as machine perfusion.
4. Potential conflict of interest
Nothing to report.
The copyright line for this article was changed on July 26, 2019 after original online publication.
References
- 1. Merion RM, Pelletier SJ, Goodrich N, Englesbe MJ, Delmonico FL. Donation after cardiac death as a strategy to increase deceased donor liver availability. Ann Surg 2006;244:555‐562. [DOI] [PMC free article] [PubMed] [Google Scholar]
- 2. National Health Services Blood and Transplant . Organ Donation and Transplantation Activity Report. 2015/16. https://www.odt.nhs.uk/statistics-and-reports/annual-activity-report/
- 3. Eurotransplant International Foundation . Annual Report 2015. Branger P, Samuel U, eds. 2015; 49 p. https://www.eurotransplant.org/cms/index.php?page=annual_reports/
- 4. Pine JK, Aldouri A, Young AL, Davies MH, Attia M, Toogood GJ, et al. Liver transplantation following donation after cardiac death: an analysis using matched pairs. Liver Transpl 2009;15:1072‐1082. [DOI] [PubMed] [Google Scholar]
- 5. Jay CL, Lyuksemburg V, Ladner DP, Wang E, Caicedo JC, Holl JL, et al. Ischemic cholangiopathy after controlled donation after cardiac death liver transplantation: a meta‐analysis. Ann Surg 2011;253:259‐264. [DOI] [PubMed] [Google Scholar]
- 6. Foley DP, Fernandez LA, Leverson G, Anderson M, Mezrich J, Sollinger HW, D'Alessandro A. Biliary complications after liver transplantation from donation after cardiac death donors: an analysis of risk factors and long‐term outcomes from a single center. Ann Surg 2011;253:817‐825. [DOI] [PMC free article] [PubMed] [Google Scholar]
- 7. DeOliveira ML, Jassem W, Valente R, Khorsandi SE, Santori G, Prachalias A, et al. Biliary complications after liver transplantation using grafts from donors after cardiac death: results from a matched control study in a single large volume center. Ann Surg 2011;254:716‐722. [DOI] [PubMed] [Google Scholar]
- 8. Leithead JA, Tariciotti L, Gunson B, Holt A, Isaac J, Mirza DF, et al. Donation after cardiac death liver transplant recipients have an increased frequency of acute kidney injury. Am J Transplant 2012;12:965‐975. [DOI] [PubMed] [Google Scholar]
- 9. Taner CB, Bulatao IG, Perry DK, Sibulesky L, Willingham DL, Kramer DJ, Nguyen JH. Asystole to cross‐clamp period predicts development of biliary complications in liver transplantation using donation after cardiac death donors. Transpl Int 2012;25:838‐846. [DOI] [PubMed] [Google Scholar]
- 10. Taner CB, Bulatao IG, Willingham DL, Perry DK, Sibulesky L, Pungpapong S, et al. Events in procurement as risk factors for ischemic cholangiopathy in liver transplantation using donation after cardiac death donors. Liver Transpl 2012;18:100‐111. [DOI] [PubMed] [Google Scholar]
- 11. Kalisvaart M, de Haan JE, Polak WG, Metselaar HJ, Wijnhoven BPL, IJzermans JNM, de Jonge J. Comparison of postoperative outcomes between donation after circulatory death and donation after brain death liver transplantation using the comprehensive complication index. Ann Surg 2017;266:772‐778. [DOI] [PubMed] [Google Scholar]
- 12. Dubbeld J, Hoekstra H, Farid W, Ringers J, Porte RJ, Metselaar HJ, et al. Similar liver transplantation survival with selected cardiac death donors and brain death donors. Br J Surg 2010;97:744‐753. [DOI] [PubMed] [Google Scholar]
- 13. Xu J, Sayed BA, Casas‐Ferreira AM, Srinivasan P, Heaton N, Rela M, et al. The impact of ischemia/reperfusion injury on liver allografts from deceased after cardiac death versus deceased after brain death donors. PLoS One 2016;11:e0148815. [DOI] [PMC free article] [PubMed] [Google Scholar]
- 14. Thuong M, Ruiz A, Evrard P, Kuiper M, Boffa C, Akhtar MZ, et al. New classification of donation after circulatory death donors definitions and terminology. Transpl Int 2016;29:749‐759. [DOI] [PubMed] [Google Scholar]
- 15. Abt PL, Praestgaard J, West S, Hasz R. Donor hemodynamic profile presages graft survival in donation after cardiac death liver transplantation. Liver Transpl 2014;20:165‐172. [DOI] [PubMed] [Google Scholar]
- 16. Firl DJ, Hashimoto K, O'Rourke C, Diago‐Uso T, Fujiki M, Aucejo FN, et al. Role of donor hemodynamic trajectory in determining graft survival in liver transplantation from donation after circulatory death donors. Liver Transpl 2016;22:1469‐1481. [DOI] [PubMed] [Google Scholar]
- 17. Hong JC, Yersiz H, Kositamongkol P, Xia VW, Kaldas FM, Petrowsky H, et al. Liver transplantation using organ donation after cardiac death: a clinical predictive index for graft failure‐free survival. Arch Surg 2011;146:1017‐1023. [DOI] [PubMed] [Google Scholar]
- 18. Bradley JA, Pettigrew GJ, Watson CJ. Time to death after withdrawal of treatment in donation after circulatory death (DCD) donors. Curr Opin Organ Transplant 2013;18:133‐139. [DOI] [PubMed] [Google Scholar]
- 19. Feng S, Goodrich NP, Bragg‐Gresham JL, Dykstra DM, Punch JD, DebRoy MA, et al. Characteristics associated with liver graft failure: the concept of a donor risk index. Am J Transplant 2006;6:783‐790. [DOI] [PubMed] [Google Scholar]
- 20. Perera MT. The super‐rapid technique in Maastricht category III donors: has it developed enough for marginal liver grafts from donors after cardiac death? Curr Opin Organ Transplant 2012;17:131‐136. [DOI] [PubMed] [Google Scholar]
- 21. Aggarwal S, Kang Y, Freeman JA, Fortunato FL Jr, Pinsky MR. Postreperfusion syndrome: hypotension after reperfusion of the transplanted liver. J Crit Care 1993;8:154‐160. [DOI] [PubMed] [Google Scholar]
- 22. Olthoff KM, Kulik L, Samstein B, Kaminski M, Abecassis M, Emond J, et al. Validation of a current definition of early allograft dysfunction in liver transplant recipients and analysis of risk factors. Liver Transpl 2010;16:943‐949. [DOI] [PubMed] [Google Scholar]
- 23. Clavien PA, Barkun J, de Oliveira ML, Vauthey JN, Dindo D, Schulick RD, et al. The Clavien‐Dindo classification of surgical complications: five‐year experience. Ann Surg 2009;250:187‐196. [DOI] [PubMed] [Google Scholar]
- 24. Slankamenac K, Graf R, Barkun J, Puhan MA, Clavien PA. The comprehensive complication index: a novel continuous scale to measure surgical morbidity. Ann Surg 2013;258:1‐7. [DOI] [PubMed] [Google Scholar]
- 25. Mathur AK, Heimbach J, Steffick DE, Sonnenday CJ, Goodrich NP, Merion RM. Donation after cardiac death liver transplantation: predictors of outcome. Am J Transplant 2010;10:2512‐2519. [DOI] [PubMed] [Google Scholar]
- 26. Blok JJ, Detry O, Putter H, Rogiers X, Porte RJ, van Hoek B, et al. for Eurotransplant Liver Intestine Advisory Committee. Longterm results of liver transplantation from donation after circulatory death. Liver Transpl 2016;22:1107‐1114. [DOI] [PubMed] [Google Scholar]
- 27. de Vera ME, Lopez‐Solis R, Dvorchik I, Campos S, Morris W, Demetris AJ, et al. Liver transplantation using donation after cardiac death donors: long‐term follow‐up from a single center. Am J Transplant 2009;9:773‐781. [DOI] [PubMed] [Google Scholar]
- 28. Van de Louw A, Cracco C, Cerf C, Harf A, Duvaldestin P, Lemaire F, Brochard L. Accuracy of pulse oximetry in the intensive care unit. Intensive Care Med 2001;27:1606‐1613. [DOI] [PubMed] [Google Scholar]
- 29. Carter BG, Carlin JB, Tibballs J, Mead H, Hochmann M, Osborne A. Accuracy of two pulse oximeters at low arterial hemoglobin‐oxygen saturation. Crit Care Med 1998;26:1128‐1133. [DOI] [PubMed] [Google Scholar]
- 30. Kohyama T, Moriyama K, Kanai R, Kotani M, Uzawa K, Satoh T, Yorozu T. Accuracy of pulse oximeters in detecting hypoxemia in patients with chronic thromboembolic pulmonary hypertension. PLoS One 2015;10:e0126979. [DOI] [PMC free article] [PubMed] [Google Scholar]
- 31. Coffey JC, Wanis KN, Monbaliu D, Gilbo N, Selzner M, Vachharajani N, et al. The influence of functional warm ischemia time on DCD liver transplant recipients’ outcomes. Clin Transplant 2017;31. [DOI] [PubMed] [Google Scholar]
- 32. Henrion J, Schapira M, Luwaert R, Colin L, Delannoy A, Heller FR. Hypoxic hepatitis: clinical hemodynamic study in 142 consecutive cases. Medicine (Baltimore) 2003;82:392‐406. [DOI] [PubMed] [Google Scholar]
- 33. Oniscu GC, Randle LV, Muiesan P, Butler AJ, Currie IS, Perera MT, et al. In situ normothermic regional perfusion for controlled donation after circulatory death–The United Kingdom experience. Am J Transplant 2014;14:2846‐2854. [DOI] [PubMed] [Google Scholar]
- 34. D'alessandro AM, Hoffmann RM, Knechtle SJ, Odorico JS, Becker YT, Musat A,, et al. Liver transplantation from controlled non‐heart‐beating donors. Surgery 2000;128:579‐588. [DOI] [PubMed] [Google Scholar]
- 35. Selten J, Schlegel A, de Jonge J, Dutkowski P. Hypo‐ and normothermic perfusion of the liver: which way to go? Best Pract Res Clin Gastroenterol 2017;31:171‐179. [DOI] [PubMed] [Google Scholar]
- 36. Ali JM, Davies SE, Brais RJ, Randle LV, Klinck JR, Allison ME, et al. Analysis of ischemia/reperfusion injury in time‐zero biopsies predicts liver allograft outcomes. Liver Transpl 2015;21:487‐499. [DOI] [PubMed] [Google Scholar]
- 37. Chu MJ, Hickey AJ, Phillips AR, Bartlett AS. The impact of hepatic steatosis on hepatic ischemia‐reperfusion injury in experimental studies: a systematic review. Biomed Res Int 2013;2013:192029. [DOI] [PMC free article] [PubMed] [Google Scholar]
- 38. Ricca L, Lemoine A, Cauchy F, Hamelin J, Sebagh M, Esposti DD, et al. Ischemic postconditioning of the liver graft in adult liver transplantation. Transplantation 2015;99:1633‐1643. [DOI] [PubMed] [Google Scholar]
- 39. Damman J, Bloks VW, Daha MR, van der Most PJ, Sanjabi B, van der Vlies P, et al. Hypoxia and complement‐and‐coagulation pathways in the deceased organ donor as the major target for intervention to improve renal allograft outcome. Transplantation 2015;99:1293‐1300. [DOI] [PubMed] [Google Scholar]
- 40. Zhang J, Hu W, Xing W, You T, Xu J, Qin X, Peng Z. The protective role of CD59 and pathogenic role of complement in hepatic ischemia and reperfusion injury. Am J Pathol 2011;179:2876‐2884. [DOI] [PMC free article] [PubMed] [Google Scholar]
- 41. Noack K, Bronk SF, Kato A, Gores GJ. The greater vulnerability of bile duct cells to reoxygenation injury than to anoxia. Implications for the pathogenesis of biliary strictures after liver transplantation. Transplantation 1993;56:495‐500. [DOI] [PubMed] [Google Scholar]
- 42. Seehofer D, Eurich D, Veltzke‐Schlieker W, Neuhaus P. Biliary complications after liver transplantation: old problems and new challenges. Am J Transplant 2013;13:253‐265. [DOI] [PubMed] [Google Scholar]