Abstract
Purpose
The multi‐exponential character of T1 relaxation in bovine articular cartilage was investigated at low magnetic fields below 0.5 T. The ultimate aim was to identify a parameter based on the T1 relaxation time distribution as a biomarker to biochemical features of osteoarthritis.
Methods
Osteoarthritis conditions were simulated by enzymatic digestion of cartilage with trypsin. Fast‐field cycling NMR relaxometry was carried out in the magnetic field range B0 = 70 μT to 600 mT. The data were analyzed in terms of T1 distributions on a log‐time scale using inverse Laplace transform, whereas integral properties such as mean T1s and distribution widths were obtained without data inversion from logarithmic moment analysis and a stretched‐exponential fit to the data. Attempts were also made to differentiate between water dynamic components through multi‐Lorentzian decomposition of average relaxation‐rate dispersions.
Results
T1 distribution in bovine articular cartilage was found to be bimodal, with the dominating, long component shifting toward larger values following trypsin digestion. The effect is more prominent toward lower magnetic field strength. This shift leads to an overall increase of the distribution width and an equivalently more pronounced deviation from exponential behavior.
Conclusion
The logarithmic width of T1 distribution functions at fields of 0.5 T and below, and the stretched‐exponential decay fit exponent β, show a significant trend after trypsin digestion of cartilage. These 2 parameters are suggested as possible biomarkers for osteoarthritis in humans and can be acquired entirely in vivo, with increasing significance for lower magnetic field strengths.
Keywords: articular cartilage, enzymatic digestion, inverse Laplace transform, logarithmic moment analysis multiexponential relaxation, T1 relaxation
1. INTRODUCTION
Articular cartilage (AC) is a thin layer of connective tissue that covers and protects the articular surfaces of bones. One form of degeneration of articular cartilage is called osteoarthritis (OA), which is one of the major causes of mobility disability among the elderly. The MRI techniques developed for early diagnosis of OA exploit spatially resolved measurements of T1, T2, and T1ρ as potential biomarkers, thanks to their correlation with the composition and structure of AC.1 In addition to the MRI mapping of T1 and T2, fast field‐cycling (FFC) NMR relaxometry has recently been used in the attempt to correlate the biological state of AC cartilage with T1 dispersion.2, 3, 4 The FFC experiments were carried out in the magnetic fields B0 = 0.2 mT to 470 mT, which span quadrupolar relaxation enhancement (QRE) peaks. A statistically significant difference was found between osteoarthritic and healthy cartilage for both the dispersion amplitude and the area of the QRE peaks,2, 4 as well as for the maximum values of T1 and T2 when the samples were subject to external load.4 The power‐law exponent α in at B0 < 25 mT was found to correlate weakly with Mankin grade but significantly with other biomarkers.5 A number of parameters obtained at low magnetic field strengths were found to correlate with disease status only under external load.4
In this work, we aim to analyze FFC relaxation data in terms of a T1 distribution, g(T 1), underlying a total magnetization relaxation function Mtot(t). Our particular goal was to investigate the field dependence of g(T 1) and see whether it is affected by the enzymatic treatment of cartilage that mimics the early stage of OA (normal versus OA‐relevant degraded tissue) and thus has the potential of being a biomarker for OA.
Nonexponential T1 relaxation in AC can be anticipated from its zonal structure. Indeed, spatially resolved measurements of T1 on bovine hip’s cartilage samples at B0 = 0.27 T5 have shown that T1 ranges between 30 ms in the calcified zone and 350 ms in the transitional zone, which is over 1 order of magnitude (Figure 1). Therefore, one might expect a multiple T1 relaxation for Mtot(t) over the entire range of B0 covered by a typical FFC instrument (B0 ≤ 0.6 T), or at least below 0.27 T where this observation was made.
Figure 1.
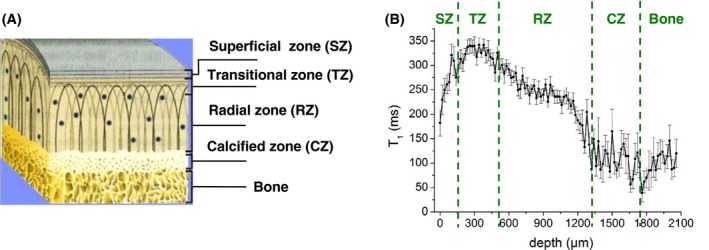
A, Four zones of articular cartilage based on orientation of collagen fibers and concentration of water and proteoglycans.14 B, Spatially resolved measurements of T1 relaxation times in the stray field of a single‐sided NMR scanner NMR MOUSE, at a Larmor frequency of 11.7 MHz (reprinted from Ref 5). In the original paper,5 single‐exponential fits were carried out per slice
In practice, nonexponential NMR relaxation is analyzed using inverse Laplace transform (ILT). A number of ILT algorithms are available6, 7, 8 that convert M(t) into a histogram of T1, which then can be submitted to further statistical analysis or used as a relaxation metric in itself. In this work, the ILT is used primarily for selective T1‐component monitoring, whereas statistical (integral) properties of distributions such as the geometric mean T1 and the geometric standard deviation σg are obtained without data inversion from a logarithmic moment analysis (LMA).9 An alternative approach to integral measures of g(T 1) is available from a stretched‐exponential fit to M(t), which gives the arithmetic mean T1 and a stretching exponent as the measure of the degree of nonexponentiality. All 3 methods are complementary to each other and used here in comparison, with the aim of testing their robustness toward routine measurements.
A shape analysis of T1‐relaxation dispersion can assist in probing the multicomponent relaxation in the frequency domain. With a good accuracy, a correlation time distribution, g(τc), can be obtained through a multi‐Lorentzian decomposition of a given relaxation rate profile. This sort of analysis assumes that the relaxation rate at every B0 is a sum of rates of elementary relaxation processes driven by fluctuations with exponential correlation functions. We will refer to such processes as Bloembergen‐Purcell‐Pound–type relaxation. Such a decomposition is generally possible mathematically, and is expected to be robust, regardless of the underlying correlation functions and detailed molecular dynamics models. The formalism of the multi‐Lorentzian decomposition is introduced here instead of the power‐law approximation to the T1 dispersion4 in the attempt to draw a correlation between g(τc) and the changes caused by enzymatic treatment of cartilage.
2. METHODS
2.1. Fast field cycling NMR relaxometry
T1‐relaxation decays were recorded on a commercial field‐cycling relaxometer Spinmaster FFC2000 (Stelar s.r.l., Mede, Italy) in the magnetic field range B0 = 70 μT to 600 mT corresponding to the 1H Larmor frequency = 3 kHz to 25 MHz. The minimum value of 3 kHz is beyond the lower limit of 10 kHz recommended by the relaxometer manufacturer, given background magnetic fields. However, because dispersion profiles does not exhibit a tendency toward a plateau below 10 kHz, as can be expected if the background fields predominate, it appears appropriate to keep the corresponding data, provided greater care is taken. The magnetic field varied from the highest value downward in logarithmically spaced steps. The number of steps was 20 when scanning over the entire field range and 50 for a separate scan over the QRE region ( = 0.4 MHz‐4 MHz). A pulse sequence with a prepolarization pulse was used at < 5 MHz, which produced M(t) in a form of decay (Figure 2), and without prepolarization above 5 MHz in which case M(t) was a recovery function. The relaxation delay t ev varied from 0.01 to 5‐10 × T1, in 24 logarithmically equidistant steps. With 4 averaging scans per delay, a 20‐point profile was acquired under 2 hours. The FID acquisition field was fixed at 0.4 T ( = 16.7 MHz), the 90° RF pulse length being 7.5 μs. The field‐switching time was set to 3 ms (Figure 2) and the slew rate to 9 MHz/ms. The temperature of the samples was 10°C.
Figure 2.
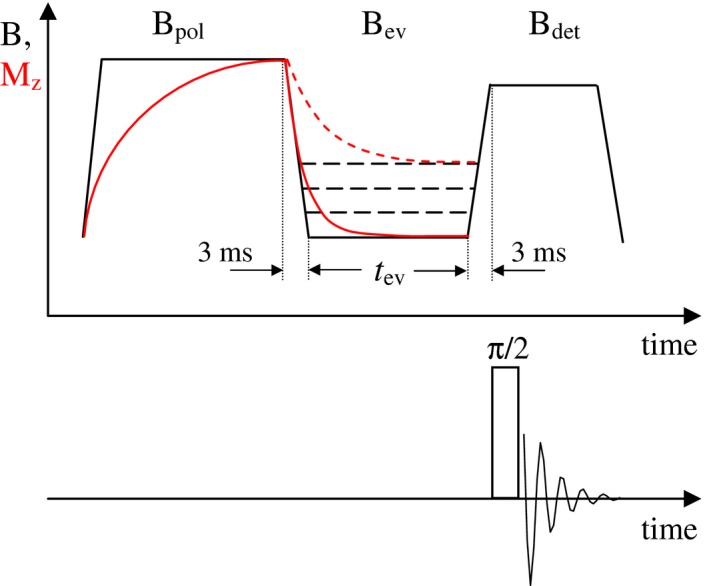
Protocol of a fast field‐cycling (FFC) relaxometry experiment with a prepolarization pulse. The field switching time was set to 3 ms. Black lines indicate magnetic field variations and the red line corresponds to the evolution of the magnetization
2.2. Multi‐exponential data analysis
The inverse Laplace transformation of M(t) was performed by the program UPEN.7 The algorithm of UPEN features an uniform smoothing penalty over the sharp and broad components of a distribution. The calculated distributions are supplied in the form of histograms of T1 with logarithmically sized bins.
The geometric mean T1, <T 1>g, and the geometric SD of T1, σg, were calculated without data inversion using an LMA. The LMA algorithm consists, in essence, of a numerical integration of M(t) that is preliminary normalized to [1, 0], followed by a few elementary operations.9 By definition,
| (1) |
where is the variance of T1 on the logarithmic time scale. The lower limit of σg is 1, which corresponds to a single exponential T1 relaxation. The logarithm of σg is proportional to the width of a T1 distribution when the latter is plotted against the logarithm of T1. This makes σg a convenient parameter to be used alongside the ILT histograms with a logarithmical abscissa. For a unimodal, symmetrical histogram, is approximately equal to the decadic logarithm of the ratio of the largest to the smallest T1 at half maximum; as such, measures the T1 distribution in terms of decades (or orders of magnitude).
The stretched‐exponential fit is a simple phenomenological model
| (2) |
in which the stretching exponent β [0, 1] measures the deviation from a single exponential (inversely correlated with σg). The arithmetic mean T1, <T 1>a, can be conveniently calculated from β and τK as
| (3) |
where denotes the gamma function. This stretched‐exponential fit is robust and less demanding for the completeness of the data compared with the LMA; however, it does not suit the case of distributions with well‐resolved and sharp T1 components. Because Equation 2 is a phenomenological model, the parameter β is correlated with σg only qualitatively, as well as with other measures that depend on the second moment of a distribution.
2.3. Multi‐Lorentzian data analysis
This analysis applies to variable‐field measurements of the arithmetic mean relaxation rate . By definition, where is the harmonic mean T1. In principle, can be calculated from ILT histograms of T1. However, this scheme was found to introduce a large scattering in values and therefore is considered impractical. Instead, we recommend using the approximation ,10 where the geometric and the arithmetic means are taken from the LMA and the stretched‐exponential fit, respectively. Note that the multi‐Lorentzian analysis of dispersion profiles is also applicable when relaxation functions are approximated by a single exponential. Although being of limited utility in case of a T1 distribution, the single‐exponential fit to M(t) gives the least scattered dispersion profiles among the present parameterization methods (see subsequently).
Henceforth the brackets and subscript “a” in is omitted for simplicity. The model for is a weighted sum of N contributions of Bloembergen‐Purcell‐Pound type, representing uncorrelated random processes with correlation times :
| (4) |
which is, with a high accuracy, approximated by a sum of single Lorentzian dispersions with an effective correlation time .11 The approximation in Equation 4 enables a 2‐step inversion of . First, it is Fourier transformed to represent data as a sum of exponentials in the time domain, and then it is submitted to a multi‐exponential decomposition by means of ILT. Because is measured at logarithmically equidistant frequencies, a special Fourier‐transform algorithm called FFTLog is used.12
2.4. Sample preparation
Samples of bovine articular cartilage were taken from calf knee joints by slicing them to a depth of several centimeters along the bone direction with the aid of a commercially available bow saw. The thickness of the slices was approximately 4 mm. A cartilage layer was separated from the subchondral bone by using a manual cutting machine. The cut chips of cartilage were 5 mm to 10 mm long, depending on the radius of curvature of the joint’s surface. To keep the whole of the calcified zone, which is only a few hundred micrometers thick and has a wavy surface, we had to cover a certain part of the adjacent bone when cutting. Each chip was then visually examined, and those containing a considerable amount of the subchondral bone were discarded. Thus, we do not expect bone marrow, if any, to contribute significantly to the NMR signal. A dozen or so of cartilage chips collected from 1 spot of the knee joint (either at a lateral condyle or a tibia) constituted 1 NMR sample.
If no enzymatic treatment was applied, the cartilage chips were kept in pure physiological saline solution (phosphate buffered saline) for 24 h under constant agitation at room temperature. The chips were removed from the phosphate buffered saline 2 hours before the NMR measurement, put in a Petri dish, and kept unsealed in the refrigerator to remove excess surface moisture. Then they were packed into a 10‐mm NMR tube and covered with Fluorinert FC‐70 fluid (a fully fluorinated aliphatic compound) to preserve the state of the cartilage. Once the NMR relaxometry experiments were complete, the cartilage chips were removed from the NMR tube, washed in pure phosphate buffered saline, and then placed in a phosphate buffered saline containing trypsin (Sigma‐Aldrich, T1426, 0.5 mg/mL concentration), where they were kept at 34°C under constant agitation for 24 hours. Afterward, the cartilage underwent this wash‐and‐dry procedure and was placed back to the NMR tube and covered with Fluorinert for the second run of the FFC measurements.
The cartilage chips were packed into an NMR tube closely and stacked there nearly parallel to each other. This might give a preference to a particular orientation of collagen fibers with respect to B0. Previous measurements,13 however, have not revealed a significant angular dependence of T1 in bovine cartilage; thus, the orientation of cartilage specimens in an NMR tube will not introduce any ambiguities in the T1 distribution measurements.
Overall, 3 calf knees were used that had been supplied by a local butcher on demand. The number of NMR samples made from a given calf knee varied from 2 to 4. No systematic documentation between origin and position of these samples was carried out, so these will be denoted symbolically as “sample A, B, C, …” in the order of their mentioning in the text.
3. RESULTS
3.1. Individual T1 component monitoring
Figure 3 shows representative T1 distributions in bovine articular cartilage at a variable . They exhibit two partially overlapping components with significantly dissimilar field dependences (dispersions). The components become fully resolved at = approximately 2 MHz, at which point they appear to constitute 20% and 80% of the population, respectively. As the field lowered into a sub‐megahertz region, the short‐time edge of the minor peak eventually reaches the instrumental limit of measurable T1 values (approximately 1 ms), which decreases its apparent amplitude down to 10%.
Figure 3.
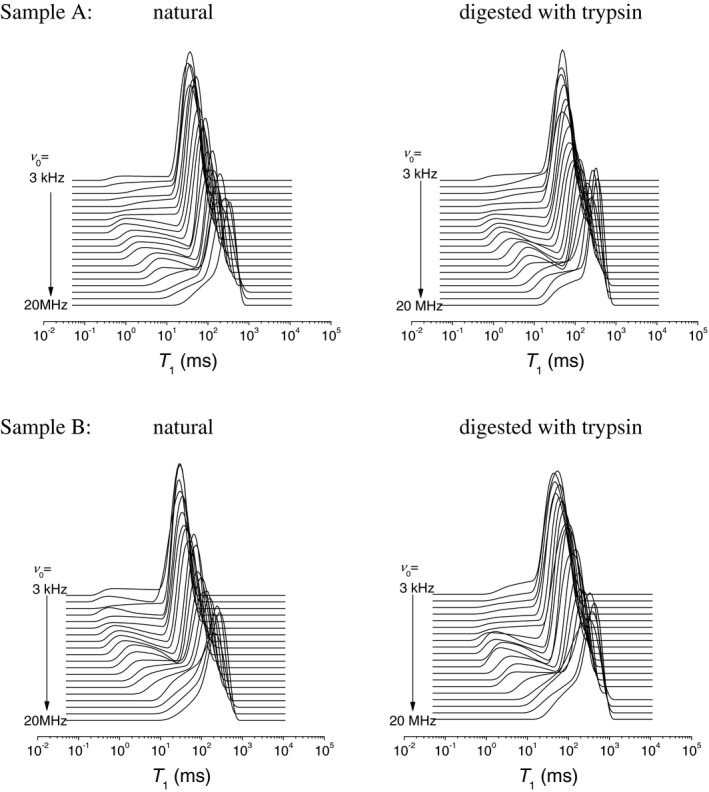
Representative T1 distributions in bovine articular cartilage before and after trypsin digestion, at different magnetic field strengths, indicated by their Larmor frequencies ν 0
To relate the observed T1 components to the constituents of cartilage, we recapitulated the results of the spatially resolved measurements of T1 by Rössler et al5 carried out on a bulk sample of bovine articular cartilage. Thus, we plotted a histogram of the T1 values from that study across the cartilages (Figure 1B), weighting their counts with the respective signal intensities14 and then overlaid it with our measurements (Figure 4). Remarkably, the T1 distributions from the two sources exhibit the same peak’s positions and comparable areas on the left sides from the peak. This supports the idea that the T1 variance across zones is a main factor of the T1 distribution observed in our FFC experiments. Because the data analysis used single exponential functions exclusively,5 and a certain structural and/or dynamic heterogeneity is expected even within the thin slice, the actual distribution of T1 values must indeed be wider. The T1 components on the left‐hand side originate mostly from the calcified zone and underlying bone (see red‐colored bars in Figure 4), which accounts for about 11% of the total histogram area. This allows us to ascribe the minor T1 component of the ILT histograms in Figure 3 primarily to the calcified zone. The comparatively short T1 and a stronger T1 dispersion of this component indicate a lower molecular mobility of water in that part of cartilage.
Figure 4.
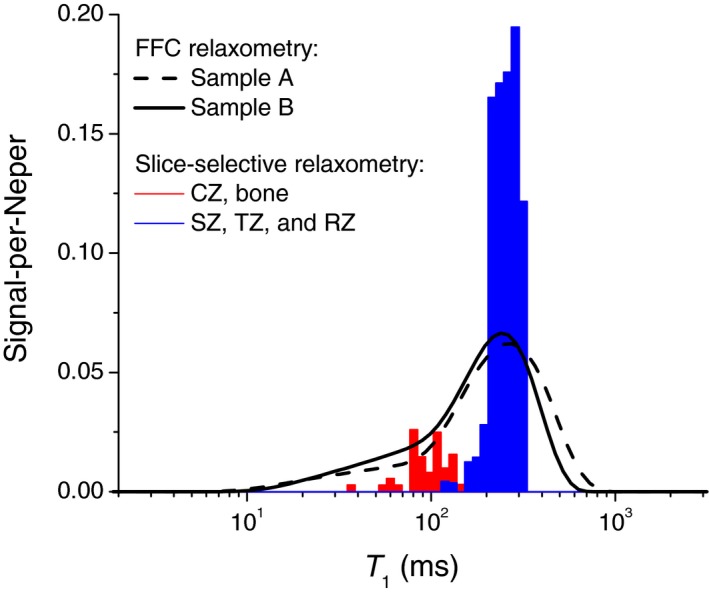
Comparison of the T1 distribution measurements from FFC relaxometry (the solid and dashed lines) and slice‐selective relaxation data presented in Figure 1. The experiments were carried out at ν 0 = 12.5 MHz and 11.7 MHz, respectively. To plot a histogram based on the slice‐selective data, the counts of T1 were weighted using a corresponding NMR signal intensity profile.14 The contribution from the calcified zone and the underlying bone is highlighted in red
It is apparent from the FFC data that T1 relaxation tends toward a single exponential as the field increases. To ascertain this tendency, we complemented the FFC data with conventional inversion‐recovery T1 relaxometry carried out at = 43.4 MHz (Spinsolve Benchtop NMR, Magritek Ltd, Wellington, New Zealand). The T1 distributions at this field were found to collapse to an irresolvable narrow peak situated within T1 = 475 ms to 545 ms, depending on the cartilage sample measured.
Trypsin digestion of the cartilage does not appear to have an appreciable effect on the minor T1 component of the distribution (assigned primarily to a signal from the calcified zone). However, this leads to a shift of the major T1 component toward longer T1 values; thus, it increases the contrast between the two T1 populations (Figure 5). The effect of trypsin on the average values of T1, and , may vary among cartilage samples,15 but overall the T1 relaxation becomes slower after trypsin digestion at all in the given FFC frequency range. This agrees with previous FFC investigations of enzymatically degraded cartilage,3 in which this fact was established from a single‐exponential fit to M(t). A similar observation has been reported for the transverse relaxation time components.16
Figure 5.
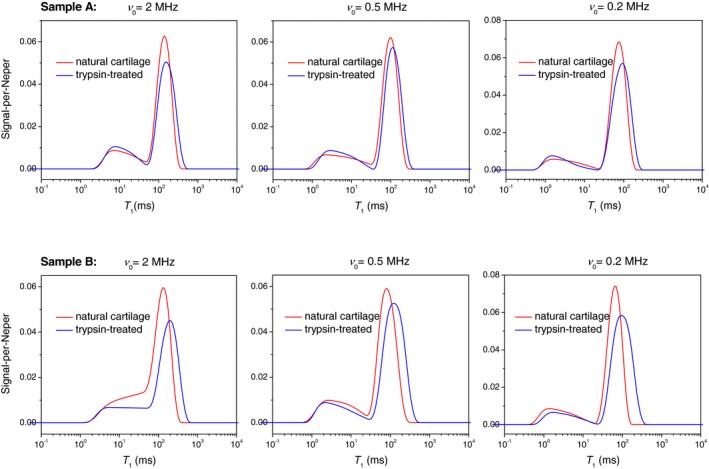
Representative inverse Laplace transform (ILT) histograms of T1 illustrate the effect of trypsin digestion on T1 populations in articular cartilage. It is apparent that the effect consists primarily of a shift of the long T1 peak (which is considered a cumulative signal from superficial, transitional, and radial zones) toward longer times
3.2. Integral parameters of T1 relaxation
Figure 6 shows the T1 distribution width parameters σg and β obtained through the LMA and the stretched‐exponential fit to M(t), respectively. Both σg and β have a prominent extremum at about = 1 MHz in agreement with preliminary findings.17 The plots of the complete distribution functions in Figure 3 suggest that this extremum can be, at least partially, caused by the minor T1 component losing its amplitude when approaching the low‐field region. This in turn is a result of an irrevocable relaxation loss of the NMR signal during field switching intervals (Figure 2). Supplementary FFC NMR relaxation experiments carried out on synthetic samples have shown that in the case of two well‐separated T1 components, the ratio of the short‐T1 to the long‐T1 component begins to deviate noticeably from the true value when the shorter T1 is approximately one order of magnitude longer than the switching time (3 ms in this study).
Figure 6.
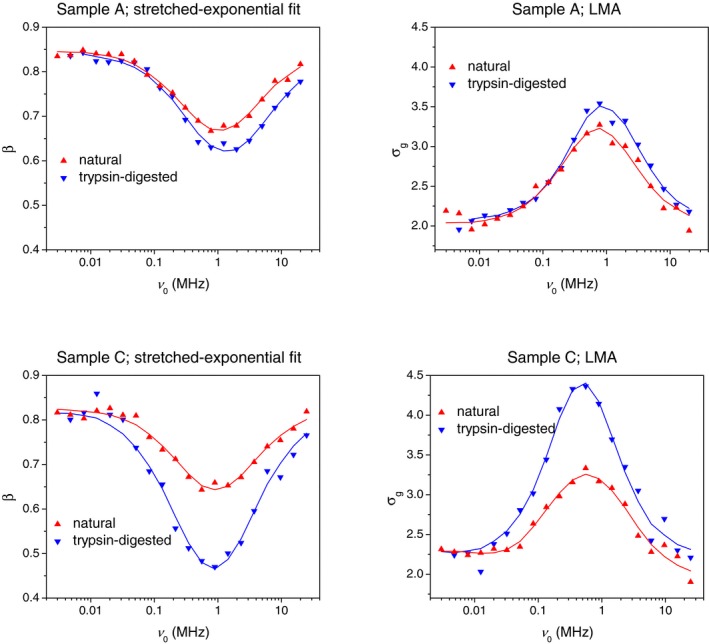
Two metrics of nonexponential T1 relaxation—the geometric SD σg and the stretching exponent β—as a function of ν 0. Lowering ν 0 increases the degree of nonexponentiality, which is securely detected down to ν 0 = 1 MHz. Below 1 MHz, the shortest T1 components become too short for a parity detection with longer T1 components, hence the apparent extremum. Digestion of cartilage with trypsin increases the degree of nonexponentiality. The solid lines are guides to the eye. Abbreviation: LMA, logarithmic moment analysis
Despite these instrumental restrictions on quantitation of short T1 components, the effect of trypsin treatment is securely detected through the integral distribution parameters σg and β, indicating the broadening of T1 distributions in the enzymatically degraded cartilage.
3.3. Multi‐Lorentzian analysis of dispersion profiles
In addition to the apparent narrowing of the T1 distribution, the uneven relaxation losses of T1 components on field switching also bias the means, and , in favor of longer T1s. Using them as such for calculating the arithmetic mean R1 leads to distorted dispersion profiles that can no longer be modeled as a sum of Lorentzian functions (see Equation 4). For this reason, instead of calculating the mean R1, we analyze the reciprocals of and as individual parameters. The reciprocal of a single‐exponential fit parameter has also been considered. Strictly speaking, the multi‐Lorentzian decomposition of such profiles can no longer be interpreted in terms of superposing R1 dispersions. Rather, it is thought of merely as a parameterization technique that might be suitable to trace the changes caused by enzymatic treatment of cartilage.
Figure 7A shows multi‐Lorentzian best‐fit curves and corresponding correlation time distributions for sample A. The thus‐measured distributions cover more than 1 order of magnitude, from several to a hundred nanoseconds. The interpretation of the obtained is out of scope of this work. We can only assume that a peak at , corresponding to a dispersion midpoint frequency 10 MHz, reflects internal motions in the aqueous gel (“bulk water”) or in the protein network,11 whereas the long‐ components account for relaxation of protein‐entrapped water (see subsequently).
Figure 7.
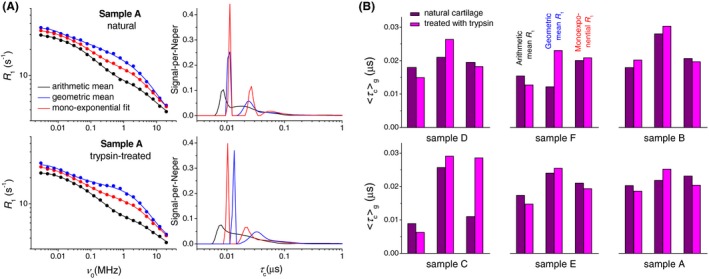
A, Dispersion profiles of three estimates of an average relaxation rate R 1—the reciprocal of the arithmetic mean T1, of the geometric mean T1, and of the best‐fit single‐exponential decay rate. The solid lines represent the multi‐Lorentzian models (Equation 4), which are plotted using the correlation time distributions shown on the right. B, Mean correlation times computed from the given for each of the three R1 estimates. The means based on the values (see the blue profiles) consistently increase after the trypsin digestion of cartilage
To quantitate the effect of trypsin digestion on , we calculated the mean for all 3 cases of , , and (Figure 7B). Only the based on the measurements (the blue profiles in Figure 7A) demonstrated a consistent response (always increases) to trypsin digestion, whereas the two other estimates have no definitive trend.
3.4. T1 relaxation broadening at QRE peaks
Figure 8 shows a profile recorded with a higher resolution to cover two quadrupolar peaks on the high‐frequency side. Most interestingly, the peaks on the profile are accompanied by peaks on a SD profile, , which is indicative of a higher degree of nonexponentiality of M(t) at the QRE frequencies.
Figure 8.
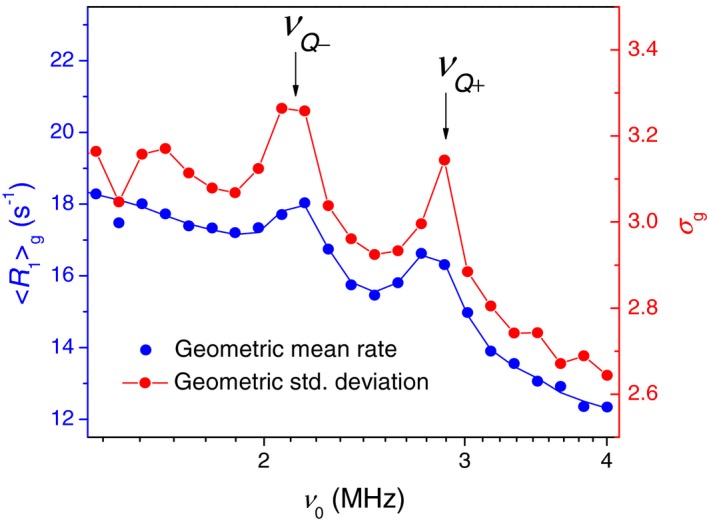
Geometric mean relaxation rate, , and geometric SD, , measured with a higher resolution over a quadrupolar relaxation enhancement region (sample B). The arrows indicate 2 of 3 quadrupolar relaxation enhancement (QRE) peaks occurring at frequencies and of the static residual quadrupole coupling of amide 14N in immobilized proteins18
The QRE is caused by a 1H–14N cross relaxation in the protein amide groups.18 It occurs under level‐matching conditions in the range of 0.4 MHz to 4 MHz, giving rise to three characteristic peaks on a 1H dispersion profile. Magnetization transfer from amide protons to the bulk water relies on diffusion and chemical proton exchange. If those processes are slow on the T1 time scale, one may indeed expect to observe an additional T1‐relaxation broadening at the QRE frequencies.
In general, the magnitude of the QRE peaks—of which often only the two high‐field peaks are sufficiently well pronounced to allow quantitative analysis—provide information about the number density and mobility of amide moieties, hence the concentration and mobility of proteins. It is a well‐known fact that proteoglycans are depleted during OA, and trypsin digestion is considered a suitable model for this aspect of OA degradation. This has been exploited to quantify the effect of trypsin digestion by measuring the QRE peak areas.3 The motive for presenting QRE data in this work is different: It is to show that the partition of water in AC into protein‐bound and bulk states is a sufficient cause of a T1 distribution on its own. We will use this argument in the Discussion to assess various sources of multiple T1 relaxation in cartilage.
4. DISCUSSION
These results show that the T1 distribution has the potential of being a biomarker for OA, provided that a suitable parameterization procedure is used. The result shown in Figure 6 is key: It demonstrates that trypsin digestion of cartilage has a pronounced effect on T1, which is securely detected over the entire range through the parameters σg and β. On the ILT histograms (Figure 5), the trypsin digestion manifests in a shift of the longer and dominating T1 component toward longer T1 values. The maximum possible contrast between naturally treated and trypsin‐treated cartilage is achieved for the given FFC instrument at = approximately 1 MHz.
In the absence of a detailed model for T1 distribution that would account for both dynamical and compositional heterogeneity of AC, the discussion of these results is largely conjectural. At this point, one needs to discern and acknowledge all possible factors leading to the nonexponential T1 relaxation observed at low fields. The measured T1 relaxation pertains to water proton relaxation; therefore, both the factors of the T1 distribution and the changes observed in T1 dispersion need to be considered in the context of the particular conditions that water is in.
From the slice‐selective low‐field relaxometry by Rössler et al,5 a single‐exponential‐fit parameter T1 varies throughout the depth of AC over one order of magnitude. Our reproduction of a log‐binned histogram of T1 (Figure 1B and Figure 4) showed that it had a similar shape to the ILT T1 distribution measured on the sum magnetization, even though it does not represent T1 values on the order of the field‐switching time with correct weighting.5 On this basis, we have to ascribe a major effect to the zonal heterogeneity of AC. However, one cannot exclude the T1 relaxation broadening due to water‐protein interactions on a local length scale, which refers to the magnetization transfer between water entrapped inside the protein matrix and bulk water.19 Thus, according to Ref 20, 30%‐35% of water in AC is entrapped in the intrafibrillar space within collagen and the remainder in the extrafibrillar space. These two domains may represent distinguishable relaxation sinks, provided an exchange between them is slower than individual relaxation. Indeed, the rise of observed at the QRE frequencies (Figure 8) suggests that the relaxation enhancement due to water/protein contacts may not be completely averaged at of several megahertz and lower. In the attempt to single out this factor of T1 distribution, we analyzed the available data from slice‐selective T1 relaxometry with the slice width of 0.1 mm at = 11.7 MHz. The result turned out to be dependent on the position inside the tissue. Namely, we were able to detect a T1 distribution of finite width in the radial and the calcified zones, but not in the transitional zone (Figure 9). Moreover, T1 relaxation in compositionally homogeneous bovine meniscus tissue consisting of bulk fibrocartilage was found to be nonexponential, too, although to a lesser extent than in AC (Figure 10).
Figure 9.
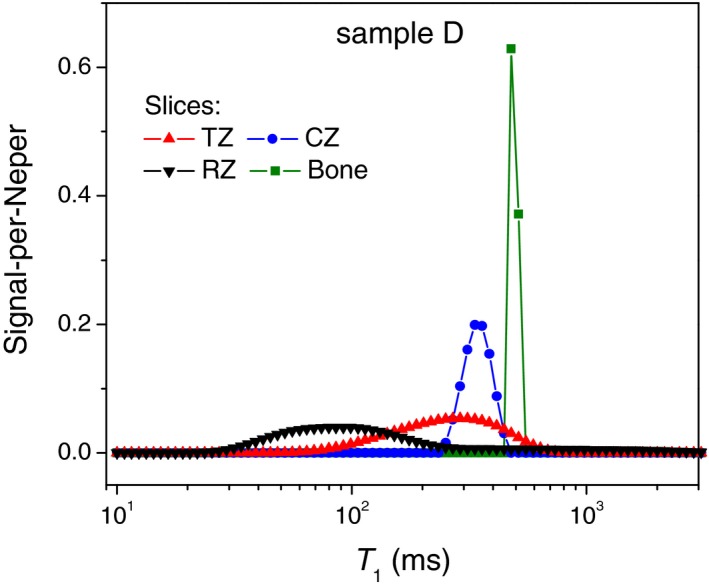
T1 distributions computed from slice‐selective T1 relaxometry with the NMR MOUSE (the measurements were performed by Dr. Andrea Creţu on a 1‐mm‐thick articular cartilage). Different colors denote morphological zones of articular cartilage being scanned over the course of the experiment (for zone acronyms, see Figure 1A)
Figure 10.
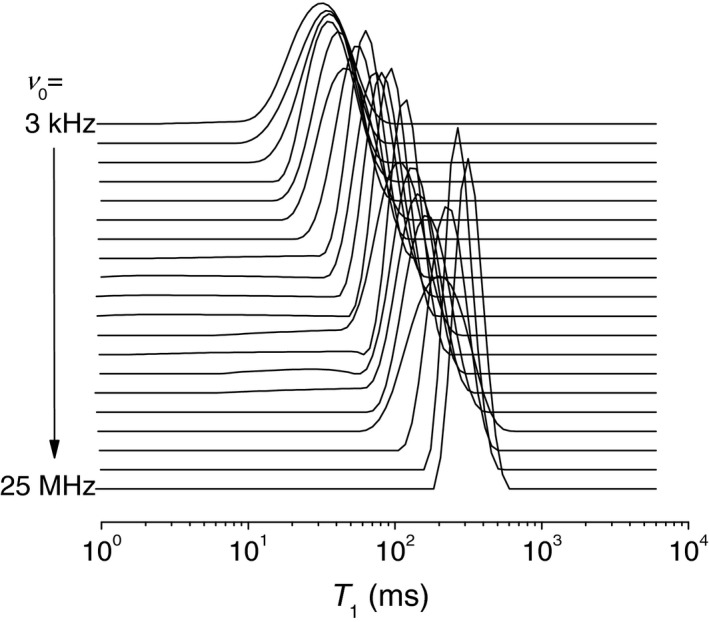
T1 distributions in bovine meniscus tissue as a function of ν 0
To address the observed tendency of T1 relaxation in AC toward a single exponential at high fields, we will refer to a particular relaxation model called an exchange‐mediated orientational randomization (EMOR).11 Similar to other 3‐pool models,19 the EMOR model attributes the water‐1H relaxation enhancement in tissue to the proton exchange between bulk water and a pool of protons (termed intermediary protons) consisting of labile macromolecular groups and entrapped water molecules. The efficiency of this mechanism relies on the residence time τex of intermediary protons falling in the microsecond range. In this range, a low‐field water‐1H relaxation rate attains its maximum due to a cross‐relaxation coupling between intermediary protons and immobilized protein protons (see Figure 8 in Ref 11). In high fields (), the efficiency of the EMOR mechanism decreases, and the water‐1H relaxation is dominated by a local reorientation of water molecules that has a substantial spectral density at those frequencies. We believe that unlike τex, the local reorientation rate is rather insensitive to the variation of the protein/water composition across morphological zones of cartilage, hence the tendency to a single T1 at high fields.
The EMOR model predicts a virtually exponential evolution of the water magnetization after nonselective excitation (the case of FFC). In particular, for the bovine pancreatic trypsin inhibitor as a representative biopolymer system, the deviation from single‐exponential evolution was found to be insignificant at an intermediary proton fraction of 0.01 and hardly detectable at that of 0.1.11 Thus, as long as bulk water remains an abundant component, the cross‐relaxation coupling between intermediary protons and immobilized protein protons does not appear to add significantly to these sources of a nonexponential relaxation.
The trypsin digestion of cartilage leads to a broader T1 relaxation distribution, as it is securely detected through the parameters σg and β at all B0. On ILT histograms, it manifests as a shift of the long‐T1 peak toward larger values, which is assigned to the transitional and the radial zones of cartilage (Figure 5), thus suggesting enhanced water mobility in those zones. Trypsin digestion removes proteoglycans (PGs) while keeping the collagen fibrils mostly intact; hence, the increase in water mobility can be related to the depletion of PGs.21 On the one hand, it is known that PG in the form of aggrecans is able to uptake 40% weight of water,22 so that a considerable amount of water in natural cartilage can be physically entrapped within the aggrecans, and as such, has a slower dynamics compared with the trypsin‐treated cartilage in which the depleted aggrecans are replaced with protein‐free water. On the other hand, PGs are known to interact with collagen fibrils in such a way that they affect the exchange of water between intrafibrillar and extrafibrillar space.20 Neither of these mechanisms can be excluded based on the present results.
To take full advantage of the FFC NMR relaxometry, we compare T1 relaxation dispersion profiles between naturally treated and enzyme‐treated cartilage. In the presence of a T1 distribution, practitioners of the FFC relaxometry usually analyze dispersions of individual T1 components after first decomposing M(t) on the time scale (such as through a bi‐exponential fit). Our approach is quite opposite: We want to discriminate between components on the frequency scale through decomposition of the average relaxation rate dispersion, , which calls for estimates of . We analyze such a dispersion as a sum of simple Lorentzian dispersions, which give us access to the correlation time distributions, , according to Equation 4. Although we do not have a dynamic model to verify the obtained , we expect consistent, general direction in which the mean value may be changing on enzymatic treatment of cartilage. Such a trend was indeed found for dispersion profiles based on the geometric mean T1 (Figure 7), which repeatedly showed an increase in after trypsin digestion. However, this contradicts the conclusion that trypsin digestion enhances water mobility in the transitional and the radial zones. Moreover, no trend was found for other measures of average relaxation: the arithmetic mean T1 and T1, mono. It must be concluded, therefore, that this formalism cannot provide reliable information on molecular mobility unless true values are supplied over the entire frequency range.
5. CONCLUSIONS
Relating NMR relaxation behavior to osteoarthritis‐induced cartilage degradation requires a thorough understanding of relevant biochemical features of OA. According to Ref 23, the early‐stage OA can be characterized “as increased water contents, slightly decreased PGs and reorganized collagens.” Seeking a suitable relaxation characteristic that would be sensible to these particular changes in cartilage biochemistry, we investigated T1 relaxation in bovine AC at low magnetic fields (B0 < 600 mT) using the FFC technique. The early‐stage OA conditions were simulated by enzymatic digestion of cartilage with trypsin.21 Using the low fields reveals a T1 relaxation‐time distribution that is attributed to morphological zones of articular cartilage—a benefit of the low‐field relaxometry as opposed to the single‐exponential T1 relaxation typically observed in stronger fields of 1 T and above.
It was found that the T1 distribution width increased significantly after trypsin digestion of cartilage. A general discussion of this result led us to the conclusion that it could indeed be explained by the biochemical changes that are characteristic of the early‐stage OA—particularly by the depletion of PGs. We should recall that this conclusion has the underlying assumption that trypsin treatment reproduces early‐stage OA conditions. Further research on the potential of this parameter (the T1 distribution width) to be a biomarker of OA requires validation in trials on articular cartilage in vitro and in vivo; corresponding experiments are currently planned.
The FFC technique is not uniquely suitable for such a type of research; one can envisage T1 distribution measurements performed on a low‐field MRI scanner equipped with a permanent magnet. The advantage of the FFC relaxometry over the steady‐field relaxometry is that it introduces through varying B0 the second dimension that can be exploited in a complementary way or in its own right to monitor the OA‐induced changes in cartilage.2, 4 Thus, attempts were made to analyze quasi‐continuous T1 dispersion profiles before and after trypsin digestion in terms of elementary Bloembergen‐Purcell‐Pound–type relaxation processes with individual correlation times. The presence in the T1 spectrum of the components that are comparable or even shorter than the field‐switching time of the FFC instrument makes the results of such analysis ambiguous; thus, its potential in providing information on molecular mobility in cartilage in terms of τc remained limited. However, its feasibility is likely to be demonstrated for most other tissues that possess much longer relaxation times.
The methods that use FFC relaxometry in combination with MRI offer access to spatially resolved T1 dispersion of human tissue in vivo. Recently, whole‐body FFC‐MRI scanners have been demonstrated and are now capable of imaging at 0.06 T and 0.2 T, with the relaxation field varying down to 10 kHz.24, 25 This newly accessible hardware can be exploited noninvasively to gain information on OA‐induced changes in human cartilage, including suitably adapted multicomponent analysis of T1 relaxation.
ACKNOWLEDGMENTS
This project has received funding from the European Union’s Horizon 2020 research and innovation programme under grant agreement No. 668119 (project “IDentIFY”). We gratefully acknowledge the scientific discussions and support by Carlos Mattea and Erik Rössler, and are indebted to Andrea Creţu for providing additional measurements.
Petrov OV, Stapf S. Multicomponent analysis of T1 relaxation in bovine articular cartilage at low magnetic fields. Magn Reson Med. 2019;81:2858–2868. 10.1002/mrm.27624
Funding information
European Union’s Horizon 2020 Research and Innovation Programme; Grant/Award number 668119 (project “IDentIFY”).
REFERENCES
- 1. Xia Y, Momot K. editors. Biophysics and Biochemistry of Cartilage by NMR and MRI. Cambridge, United Kingdom: The Royal Society of Chemistry; 2017;731. [Google Scholar]
- 2. Broche LM, Ashcroft GP, Lurie DJ. Detection of osteoarthritis in knee and hip joints by fast field‐cycling NMR. Magn Reson Med. 2012;68:358–362. [DOI] [PubMed] [Google Scholar]
- 3. Rössler E, Mattea C, Stapf S. NMR dispersion investigations of enzymatically degraded bovine articular cartilage. Magn Reson Med. 2015;73:2005–2014. [DOI] [PubMed] [Google Scholar]
- 4. Rössler E, Mattea C, Saarakkala S, et al. Correlations of low‐field NMR and variable‐field NMR parameters with osteoarthritis in human articular cartilage under load. NMR Biomed. 2017;30:e3738. [DOI] [PubMed] [Google Scholar]
- 5. Rössler E, Mattea C, Stapf S. Feasibility of high‐resolution one‐dimensional relaxation imaging at low magnetic field using a single‐sided NMR scanner applied to articular cartilage. J Magn Reson. 2015;251:43–51. [DOI] [PubMed] [Google Scholar]
- 6. Provencher SW. CONTIN: a general purpose constrained regularization program for inverting noisy linear algebraic and integral equations. Comput Phys Commun. 1982;27:229. [Google Scholar]
- 7. Borgia GC, Brown R, Fantazzini P. Uniform‐penalty inversion of multiexponential decay data. J Magn Reson. 1998;132:65–77. [DOI] [PubMed] [Google Scholar]
- 8. Venkataramanan L, Song Y‐Q, Hürlimann MD. Solving Fredholm integrals of the first kind with tensor product structure in 2 and 2.5 dimensions. IEEE Trans Signal Process. 2002;50:1017–1026. [Google Scholar]
- 9. Petrov OV, Stapf S. Parameterization of NMR relaxation curves in terms of logarithmic moments of the relaxation time distribution. J Magn Reson. 2017;279:29–38. [DOI] [PubMed] [Google Scholar]
- 10. Rossman LA. Design stream flows based on harmonic means. J Hydraul Eng. 1990;116:946–950. [Google Scholar]
- 11. Halle B. Molecular theory of field‐dependent proton spin‐lattice relaxation in tissue. Magn Reson Med. 2006;56:60–72. [DOI] [PubMed] [Google Scholar]
- 12. Hamilton AJS. Uncorrelated modes of the non‐linear power spectrum. Mon Not R Astron Soc. 2000;312:257–284. [Google Scholar]
- 13. Rössler E, Mattea C, Mollova A, Stapf S. Low‐field one‐dimentional and direction‐dependent relaxation imaging of bovine articular cartilage. J Magn Reson. 2011;213:112–118. [DOI] [PubMed] [Google Scholar]
- 14. Rössler E. Ortsaufgelöste Niederfeld‐NMR‐Untersuchungen der Wasser‐ und Proteindynamik an Knorpelgewebe sowie dessen Bestandteilen zur Charakterisierung von degenerativen Erkrankungen [Ph.D. Thesis]. Ilmenau University of Technology; 2017. [Google Scholar]
- 15. Wang N, Chopin E, Xia Y. The effects of mechanical loading and gadolinium concentration on the change of T1 and quantification of glycosaminoglycans in articular cartilage by microscopic MRI. Phys Med Biol. 2013;58:4535–4547. [DOI] [PMC free article] [PubMed] [Google Scholar]
- 16. Reiter DA, Lin PC, Fishbein KW, Spencer RG. Multicomponent T2 relaxation analysis in cartilage. Magn Reson Med. 2009;61:803–809. [DOI] [PMC free article] [PubMed] [Google Scholar]
- 17. Petrov OV, Rössler E, Mattea C, et al. Low‐field NMR relaxation times distributions and their magnetic field dependence as a possible biomarker in cartilage In: Eskola H, Väisänen O, Viik J, Hyttinen J, editors. IFMBE Proceedings. Basel, Switzerland: Springer Nature; 2018:952–955. [Google Scholar]
- 18. Sunde EP, Halle B. Mechanism of 1H–14N cross‐relaxation in immoblized proteins. J Magn Reson. 2010;203:257–273. [DOI] [PubMed] [Google Scholar]
- 19. Calucci L, Forte C. Proton longitudinal relaxation coupling in dynamically heterogeneous soft systems. Prog Nucl Magn Reson Spectrosc. 2009;55:296–323. [Google Scholar]
- 20. Torzilli PA. Influence of cartilage conformation on its equilibrium water partition. J Orthop Res. 1985;3:473–483. [DOI] [PubMed] [Google Scholar]
- 21. Rojas FP, Batista MA, Lindburg CA, et al. Molecular adhesion between cartilage extracellular matrix macromolecules. Biomacromol. 2014;15:772–780. [DOI] [PMC free article] [PubMed] [Google Scholar]
- 22. Prudnikova K, Yucha RW, Patel P, et al. Biomimetic proteoglycans mimic macromolecular architecture and water uptake of natural proteoglycans. Biomacromol. 2017;18:1713–1723. [DOI] [PubMed] [Google Scholar]
- 23. Wang K, Wu J, Day R, Kirk TB, Hu X. Characterizing depth‐dependent refractive index of articular cartilage subjected to mechanical wear or enzymic degeneration. J Biomed Optics. 2016;21:095002. [DOI] [PubMed] [Google Scholar]
- 24. Ross PJ, Broche LM, Davies GR, Lurie DJ. A fast‐field‐cycling MRI system for clinical applications In Proceedings of the 34th Annual Meeting of ESMRMB; 2017; Barcelona, Spain. Abstract 56. [Google Scholar]
- 25. Lurie DJ, Ross PJ, Broche LM. Techniques and applications of field‐cycling magnetic resonance in medicine In: Kimmich R, ed. Field‐Cycling NMR Relaxometry: Instrumentation, Model Theories and Applications. London, United Kingdom: Royal Society of Chemistry; 2018:563. [Google Scholar]


