Abstract
Objective
To describe spinal epidural lipomatosis (SEL) of the lumbar region and evaluate the relative versus absolute values of epidural fat (EF) to determine which is more appropriate when using magnetic resonance imaging (MRI).
Design
Comparative study.
Setting
Hospital.
Participants
Eight SEL patients and 40 healthy adults.
Interventions
MRI measurement of EF.
Outcome Measures
The MRI-based EF thickness, cutoff value, and coefficient of variation (CV) were calculated. Frequency distribution maps for the absolute EF value and the relative EF/DuS value were created.
Results
SEL involved L3 − L4 in all cases. The mean EF thickness was 12.11 ± 2.28 mm (range: 9.91 − 16.86 mm), and the average diameter of the dural sac (DuS) was 20.02 ± 2.64 mm; the EF/DuS ratio was 0.61 ± 0.03. In controls, the average EF thickness was 7.35 ± 1.68 mm (range: 4.81 − 10.92 mm), and the average DuS was 20.86 ± 2.11 mm; the EF/DuS ratio was 0.35 ± 0.08. The relative and absolute values were significantly higher in the SEL group than in the normal group. A cutoff value of 9.8 mm could distinguish SEL patients from normal individuals. For the SEL group, the CV of the relative values (4.9%) was lower than that of the absolute values (18.8%). The frequency distribution map showed that the distribution of relative values was more concentrated than that of the absolute values for both groups.
Conclusion
Based on the frequency distribution and CVs, the relative value of EF/DuS maybe a better measure for diagnosing SEL than the absolute EF value.
Keywords: Diagnosis, Dural sac, Epidural fat, Magnetic resonance imaging, Spinal epidural lipomatosis
Introduction
Spinal epidural lipomatosis (SEL) is characterized by excessive spinal epidural fat deposition. SEL was first described in 1975, affecting a patient’s lumbar region.1 The disease is typically first identified because compression of the spinal cord results in back pain, nerve root symptoms, and neurogenic claudication; however, it can also cause no clinical symptoms.
Epidural fat increases for many reasons. Intraspinal epidural steroid injections can increase local epidural fat, leading to a series of corresponding clinical symptoms.2,3 Recent studies have revealed an association between SEL and symptoms of Cushing's syndrome4 and exogenous hormone intake.5–7 Moreover, 70% of people with obesity are affected.8 Epidural fat and congenital spinal stenosis may be associated,9 but in many cases, there are no clear predisposing factors.8
Treatment of SEL mainly involves non-surgical management, such as weight-loss in overweight patients4,10 and tapering of steroid administration, if possible,11 and surgical decompression when necessary.12
Usually, SEL is diagnosed based on computed tomography (CT) or magnetic resonance imaging (MRI).13–15 Pinkhardt et al.16 and Borre et al.17 found that SEL in the lumbar region can be diagnosed if the epidural fat (EF)/anteroposterior diameter of the dural sac (DuS) exceeds 40%. Quint et al. diagnosed SEL based on MRI findings of EF thickness exceeding 6 mm in the posterior epidural space of the dorsal area with compression of the spinal cord in sagittal sections.18 Kumar et al.19 proposed that EF exceeding 7 mm at the dorsal thoracic sac is diagnostic for SEL. However, it is not clear whether it is better to use the absolute value of EF thickness or to use Borre's relative value.
SEL may affect the thoracic or lumbar spine. In a study by Al-Khawaja et al.8 involving 49 cases of idiopathic SEL and 62 cases of secondary SEL, 65% and 35%, respectively, involved the lumbar region. However, the study did not report which particular region of the lumbar spine was most frequently involved or the average EF value according to location.
This study aimed firstly to describe the range of MR findings in patients with SEL, and secondly, to assess differences in these findings compared to normal individuals and to define diagnostic criteria based on such measures.
Materials and methods
Subjects
Data from 1698 patients attending our hospital from March 2011 to March 2015, who underwent MRI because of lumbosacral pain, were retrospectively reviewed; of these, 63 patients were diagnosed with SEL by clinicians, and 8 of these patients had L3/L4 level epidural compression. MR images were used for diagnosing SEL using Borre et al.’s system [6]. Patients were assigned to 1 of the following 4 grade levels by measuring EF and DuS: normal; lumbar epidural lipomatosis (LEL) grade 0: EF/DuS index ≤ 40%; LEL grade I: EF/DuS index 41 − 50% (mild EF overgrowth); LEL grade II: EF/DuS index 51 − 74% (moderate EF over-growth); and LEL grade III: EF/DuS index ≥ 75% (severe EF overgrowth). Half of the SEL patients were male, and the patients age ranged from 47 to 68 years (mean age: 56.0 ± 5.9 years). The main clinical manifestations were numbness and weakness or tingling, lumbago, and pain in the flanks. Two patients presented with urinary incontinence and 2 had muscular atrophy in asymmetric limbs (Table 1).
Table 1. Demographic and clinical data of the 8 SEL patients in this study.
| Number | sex | age/BMI | Clinical symptoms | Site of fat increase as determined by MRI | EF/Spi C index, Borre classification |
|---|---|---|---|---|---|
| 1 | M | 55/21.2 | Lumbago, right leg pain, numbness and weakness | posterior of L3/L4–L4/L5 | 13.78/22.90, 60.2%, II |
| 2 | M | 65/19.7 | Left lower limb weakness, numbness, pins and needles sensation, sensory loss | Posterior of L3/L4–L4/L5 | 10.78/16.42, 65.7%, II |
| 3 | F | 50/27.9 | Pain and numbness in the lumbosacral region | Posterior of L3/L4 | 11.54/19.33, 59.7%, II |
| 4 | F | 51/20.5 | Lumbago, backache, heaviness in the chest and back, foot dorsiflexion weakness | posterior of L3/L4–L4/L5 | 11.57/19.58, 59.1%, II |
| 5 | F | 37/26.4 | Low back pain, leg pain | Posterior of L3/L4–L4/L5, anterior of L4-S1 | 16.0/21.77, 73.4% III |
| 6 | F | 73/24.3 | Pain in the lumbosacral region and pain in both legs. | Posterior of L3/L4 | 11.17/18.13, 61.6%, II |
| 7 | M | 65/25.4 | Left lower limb weakness, numbness, pins and needles sensation | Posterior of L3/L4 | 9.90/17.35, 57.0% II |
| 8 | M | 60/20.9 | Lumbago, thigh and leg numbness, right leg pain, muscle atrophy, bladder dysfunction | posterior and anterior of L3–S1 | 16.86/26.74, 63.1% II |
We also collected MRI data of the lumbar segment (T12 − S1) from 200 normal adults attending our hospital from July 2012 to March 2015. By number randomization, we selected a sample of 40 cases consisting of 20 males and 20 females aged 21 − 55 years with an average age of 36.1 ± 13.8 years. The inclusion criteria were as follows: (1) no malformation of the spine; (2) no prolapse or bulging of the lumbar intervertebral discs; (3) no lumbar spinal stenosis; (4) no space-occupying lesions in the spinal canal; (5) no thickening, calcifications, or osteoproliferation of the ligamentum flava; and (6) no long-term history of glucocorticoid use or Cushing’s syndrome.
Equipment and technology
We used a GE (Milwaukee, WI, USA) 1.5 T MRI scanner with a lumbar coil. The field of view was 32 cm × 32 cm, the matrix was 512 × 512, the scanning thickness was 4 mm, and the scanning gap was 0.5 mm. MRI inspection of all cases included a spin echo sequence, T1-weighted imaging (T1WI) sagittal view TR/TE = 540/7.9 ms, fast spin echo sequence, T2WI sagittal view and axial view, TR/TE = 2620/102 ms, and fat suppression sequence sagittal view for 5 cases, TR/TE = 3000/54.2 ms.
Observations and statistical methods
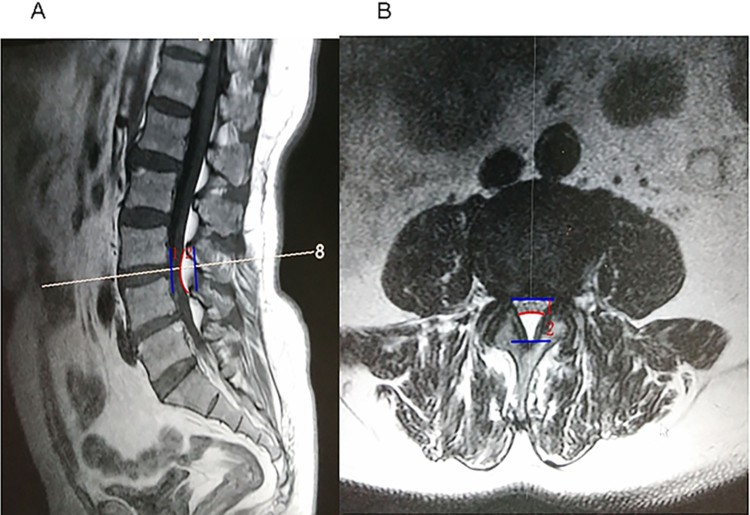
The lumbar EF thickness was measured by 3 experienced radiologists who were blinded to the diagnosis. They observed the signals, patterns, and distribution of fat in the spinal canal in the lumbar region and recorded the thickness of the EF in the spinal canal at the L3/L4 level, including the thickness of the DuS. The values were measured on T1WI sagittal views in the horizontal plane of the intervertebral disc segments. To establish reproducible measurements of the DuS and EF for each patient, the following 2 linear measurements were obtained at the midline: (1) the DuS and (2) the anteroposterior diameter of the EF located dorsally to the DuS (EF). The relative values were calculated as EF/DuS.
Kappa tests were used to assess the agreement of measurements among the 3 radiologists. SPSS19.0 statistical software (SPSS Inc., Chicago, IL) was used for statistical analysis. When kappa ≥ 0.75, we used the average of the 3 reported data points. The independent samples t-test was applied for comparison of measurements between the SEL group and the normal group. The coefficient of variation (CV) was calculated for the absolute and relative values (EF/DuS) in the SEL group. The frequency distribution was presented as box plots for the absolute and relative values for both the SEL and the control groups. The sensitivity and specificity of the absolute and relative values were then determined and compared.
Results
MRI performance
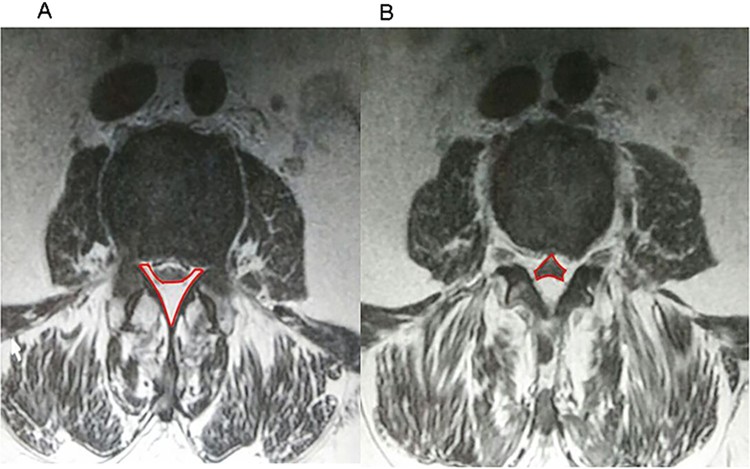
For the 8 SEL cases, the fat at the mid-sagittal diameter was hyper-intense on T1WI and hypo-intense on T2WI; and on STIR MRI; the fat tissue was mainly distributed around the DuS. In 6 SEL cases, the EF was located in the posterior region at the L3/L4 level. Dorsal EF was seen in 6 cases, also located at L3/L4, and 2 cases had overgrowth of EF in the anterior and posterior regions of the epidural sac that affected the spinal cord and resulted in cauda equina nerve compression. The epidural sac was compressed into a “Y”-shape or star-shape,20 as shown in Fig. 1A and B, respectively, and the DuS was narrow (Fig. 2A,B). At the L3/L4 level, the average thickness of the fat posterior to the DuS was 2.11 ± 2.28 mm (range: 9.91 − 16.86 mm). The average spinal canal diameter was 20.02 ± 2.64 mm (range: 16.07 − 26.74 mm). The ratio of the former to the latter measurements was 0.61 ± 0.03.
Figure 1.
(A) The posterior spinal epidural lipomatosis is Y-shaped in the axial view, which is clearly thicker than in normal adults. (B) Spinal epidural lipomatosis is seen as a star-shaped structure in the axial view.
Figure 2.
A 55-year-old male with a spinal epidural lipomatosis. (A) T1WI sagittal view; (B) axial T2WI view. Epidural fat (EF) and dural sac dimensions were measured on the T1WI sagittal view, drawn as a line at the level of the L3/L4 intervertebral disc. Between the blue lines is the spinal canal depth. The dural sac dorsal fat at the level of the L3/L4 intervertebral disc protrudes anteriorly with a characteristic arc (shown as the red curve). (1) Representative dural sac dimensions. (2) Representative posterior epidural fat. The dural sac is compressed and flattened.
In the 40 normal controls, fat in the anterior DuS was distributed less similar to a strip or crescent; rather, the fat was mainly located posterior to the epidural space in the shape of spindles and scattered segments, with the thickest level at L3/L4 or L4/L5. At the L3/L4 level, the average thickness of the fat posterior to the DuS was 7.35 ± 1.68 mm (range: 4.81 mm − 10.92 mm) and a 95% confidence interval (CI) of 6.94 − 7.59 mm. The average diameter of the spinal canal was 20.86 ± 2.11 mm (range: 11.33 − 25.56 mm). The ratio of the former to the latter values for normal controls was 0.35 ± 0.08.
Statistical comparisons
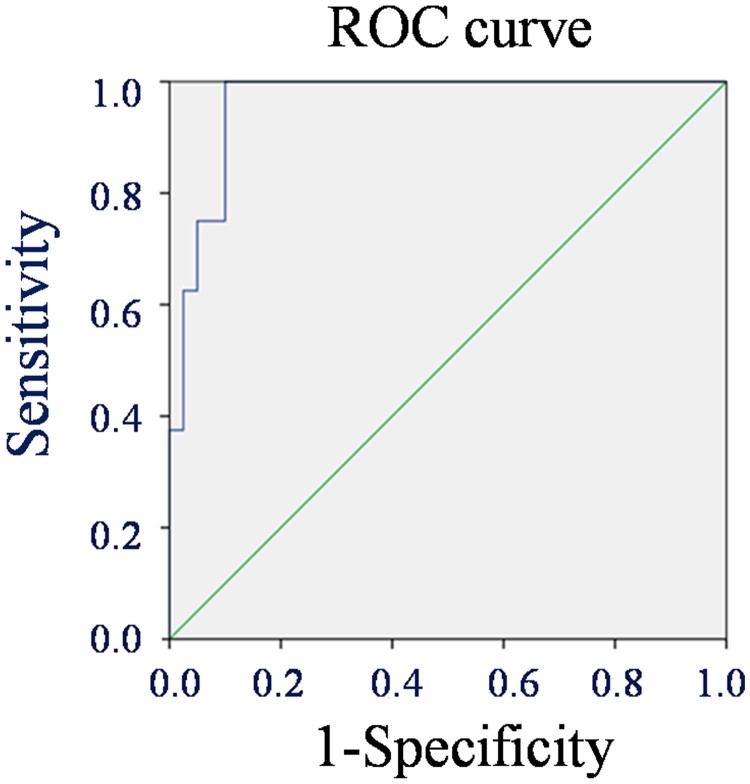
The kappa values for EF and DuS were 0.87 and 0.91, respectively; therefore, statistical analyses were performed using the average measurements of the 3 radiologists. An independent single-sample t-test was used for the SEL group and control group for both the absolute and the relative values, which revealed significant differences between the 2 groups for both values (Table 2). An ROC curve for the EF value of normal controls and SEL patients indicated a cutoff value for distinguishing between normal controls and SEL patients was 9.6 mm (Fig. 3), with a sensitivity and specificity of 100% and 90.2%, respectively.
Table 2. Comparison of the relative and absolute values of epidural thickness between patients with SEL and normal adult controls.
| Absolute value (mm, X¯ ± S) | Relative value (EF/Spi C index, X¯± S) |
||
|---|---|---|---|
| Epidural fat thickness |
Diameter of the dural sac | ||
| SEL | 12.11 ± 2.28 | 20.02 ± 2.64 | 0.61 ± 0.03 |
| Control | 7.35 ± 1.68 | 20.86 ± 2.11 | 0.35 ± 0.08 |
| t-test (t-value, P-value) | 6.92, 0.000 | −0.903, 0.371 | 9.10, 0.000 |
| SEL CV (S/X̅) | 18.8% | — | 4.9% |
SEL, spinal epidural lipomatosis; CV, coefficient of variation.
Figure 3.
The receiver operating curve (ROC) curve based on epidural fat measurements using sensitivity as the vertical coordinate and 1-specificity as horizontal coordinate; the area under the curve is 0.915.
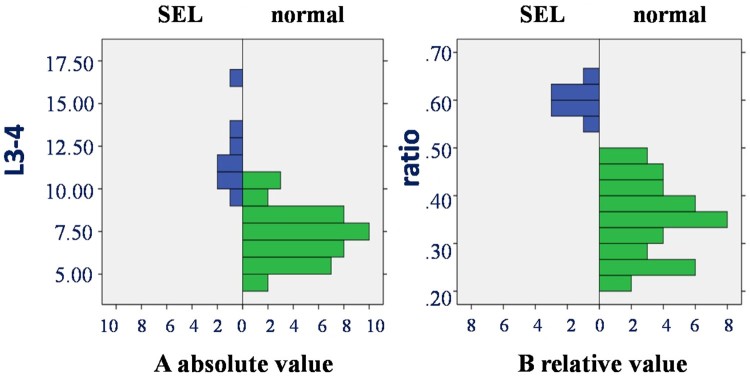
The CV of the SEL group was also calculated for the absolute and relative values (Table 2). The frequency distributions for the absolute and relative values for both groups were plotted as box plots (Fig. 4). For both groups, the frequency distribution was more strongly clustered and more closely approximated the normal distribution for the relative values than the absolute values, without overlap between normal and SEL groups. However, the plots of the absolute values showed a more discrete distribution in the SEL group, with a wider distribution range, and with greater overlap between groups.
Figure 4.
Frequency distribution of relative (A) and absolute (B) epidural fat thickness values in patients with spinal epidural lipomatosis (SEL) and normal controls.
Discussion
When SEL occurs in the L3/L4 epidural region, it is often overlooked as a cause of neurological symptoms and is inconsistently reported in radiology reports.20 With the advances in MRI technology in recent years, excessive fat can now be clearly displayed on multi-sequence MRI,3,5,6,15–17,21 and SEL is increasingly recognized and diagnosed.
Four causal associations have been reported for SEL: exogenous steroid use, obesity, endogenous excess steroid or Cushing syndrome, and idiopathic causes.22 Mostly occurring in the lumbar spine, idiopathic SEL is less common than secondary SEL.23 Kumar has proposed that SEL can be diagnosed if the following conditions are satisfied: (1) Medical history and physical examination show a compressed spinal cord; (2) MRI results show a marked increase in EF in successive bands or binding or spindle patterns, with an anteroposterior diameter exceeding 7 mm and narrowing or disappearance of the dorsal thecal sac due to compression; and (3) body mass index (BMI) exceeds 27.5 kg s.2 Our results suggest that when the SEL involves the L3/L4 segment, an EF of 9.8 mm is a reasonable cutoff value. In our 8 SEL patients, 3 had a BMI greater than 23 kg B−2 (defined as overweight; 2 females and 1 male); thus, we speculate that BMI may be related to SEL.
As expected, both the EF and the EF/DuS index in the SEL group were significantly higher than those in the normal group. We found that the average value of EF on the L3/L4 segment of SEL patients was 12.11 ± 2.28 mm, which was significantly greater than that of normal adults (7.35 ± 1.68 mm).
When comparing the specificity and sensitivity of both the absolute and relative values for the diagnosis of SEL in the 48 individuals, we found that the highest sensitivity and specificity values were obtained (100% and 90.2%, respectively) when using EF > 9.8 mm as a cutoff. It is not clear why this value was larger than the 6 mm and 7 mm cutoff values advocated by Quint et al.8 and Kumar et al.,9 respectively; however, there are 2 possible reasons. First, our 8 cases were severe (grade II or III according to Borre et al.17), as moderately affected patients may not seek medical attention. Second, the L3/L4 region accumulates more fat than other spinal segments.
The CV of the absolute value was greater than that of the relative value (18% and 4.9%, respectively); thus, the absolute value tended to be more variable while the relative ratios were more clustered. The frequency distribution of the absolute values in the SEL group had a wide range, overlapping with that of the normal control group, as previously reported.24–26 However, when using relative ratios, the frequency distribution of the SEL group was more clustered, trending towards a normal distribution without overlapping the distribution of the normal group ratios, suggestive of a boundary between the normal and SEL values.
This study had some limitations. First, only 8 cases with L3/L4 dorsal idiopathic spinal EF compression were included; thus, these findings can only be used for reference. Second, this report is based on lumbosacral MRI studies on patients with lumbago; therefore, patients with SEL in other vertebral regions were not included. Further studies should be conducted on patients with SEL involving different segments of the spine and treatment prognosis should be evaluated.
Conclusions
In conclusion, we described a group of SEL patients with involvement of the lumbar segment based on MRI, with an average EF thickness of 12.11 ± 2.28 mm. To distinguish SEL patients from normal individuals, an EF thickness value of 9.8 mm can be used as a cutoff. However, the use of the relative value (EF/DuS) for diagnosis of SEL is more accurate and has a wider region of application from the thoracic to the lumbar spine. Thus, if symptoms of spinal cord compression are present and other causes are excluded by MRI, SEL can be diagnosed based on observation of an excessive deposition of fat in the epidural space of the vertebral canal, as well as by an EF/DuS index > 40%.
Disclaimer statements
Contributors None.
Conflicts of interest None.
Ethics approval None.
Funding Statement
This work was supported by the Wuxi Key Medical Talents (ZDRC032) and the Public Health Research Project of Jiangnan University (No. 1286010242150640).
References
- 1.Lee M, Lekias J, Gubbay SS, Hurst PE.. Spinal cord compression by extradural fat after renal transplantation. Med J Aust 1975;1(7):201–3. [DOI] [PubMed] [Google Scholar]
- 2.Tok CH, Kaur S, Gangi A.. Symptomatic spinal epidural lipomatosis after a single local epidural steroid injection. Cardiovasc Intervent Radiol 2011;34 Suppl 2:S250–5. doi: 10.1007/s00270-010-9982-z [DOI] [PubMed] [Google Scholar]
- 3.Choi KC, Kang BU, Lee CD, Lee SH.. Rapid progression of spinal epidural lipomatosis. Eur Spine J 2012;21 Suppl 4:S408–12. doi: 10.1007/s00586-011-1855-x [DOI] [PMC free article] [PubMed] [Google Scholar]
- 4.Koch CA, Doppman JL, Watson JC, Patronas NJ, Nieman LK.. Spinal epidural lipomatosis in a patient with the ectopic corticotropin syndrome. N Engl J Med 1999;341(18):1399–400. doi: 10.1056/NEJM199910283411814 [DOI] [PubMed] [Google Scholar]
- 5.Artner J, Leucht F, Cakir B, Reichel H, Lattig F.. Spinal epidural lipomatosis. Orthopade 2012;41(11):889–93. doi: 10.1007/s00132-012-1966-z [DOI] [PubMed] [Google Scholar]
- 6.Sugaya H, Tanaka T, Ogawa T, Mishima H.. Spinal epidural lipomatosis in lumbar magnetic resonance imaging scans. Orthopedics 2014;37(4):e362–6. doi: 10.3928/01477447-20140401-57 [DOI] [PubMed] [Google Scholar]
- 7.Wakerley B, Kent L, Jackson M.. Progressive epidural lipomatosis with steroid use in severe refractory asthma. J Asthma 2011;48(3):316–8. doi: 10.3109/02770903.2011.554946 [DOI] [PubMed] [Google Scholar]
- 8.Al-Khawaja D, Seex K, Eslick GD.. Spinal epidural lipomatosis--a brief review. J Clin Neurosci 2008;15(12):1323–6. doi: 10.1016/j.jocn.2008.03.001 [DOI] [PubMed] [Google Scholar]
- 9.Flisberg P, Thomas O, Geijer B, Schott U.. Epidural lipomatosis and congenital small spinal canal in spinal anaesthesia: a case report and review of the literature. J Med Case Rep 2009;3:128. doi: 10.1186/1752-1947-3-128 [DOI] [PMC free article] [PubMed] [Google Scholar]
- 10.Maillot F, Mulleman D, Mammou S, Goupille P, Valat JP.. Is epidural lipomatosis associated with abnormality of body fat distribution? A case report. Eur Spine J 2006;15(1):105–8. doi: 10.1007/s00586-005-0955-x [DOI] [PMC free article] [PubMed] [Google Scholar]
- 11.Mahmood NS, Shetty S, Andrews S.. Lumbosacral epidural lipomatosis due to prolonged steroid intake causing cauda equina syndrome. Neurol India 2010;58(1):146–7. doi: 10.4103/0028-3886.60416 [DOI] [PubMed] [Google Scholar]
- 12.McCormick Z, Plastaras C.. Transforaminal epidural steroid injection in the treatment of lumbosacral radicular pain caused by epidural lipomatosis: a case series and review. J Back Musculoskelet Rehabil 2014;27(2):181–90. doi: 10.3233/BMR-130434 [DOI] [PubMed] [Google Scholar]
- 13.Bednar DA, Esses SI, Kucharczyk W.. Symptomatic lumbar epidural lipomatosis in a normal male. A unique case report. Spine 1990;15(1):52–3. [DOI] [PubMed] [Google Scholar]
- 14.Hierholzer J, Benndorf G, Lehmann T, Schneider GH, Podrabsky P, Sander B, et al. Epidural lipomatosis: case report and literature review. Neuroradiology 1996;38(4):343–8. doi: 10.1007/BF00596585 [DOI] [PubMed] [Google Scholar]
- 15.Kuhn MJ, Youssef HT, Swan TL, Swenson LC.. Lumbar epidural lipomatosis: the “Y” sign of thecal sac compression. Comput Med Imaging Graph 1994;18(5):367–72. doi: 10.1016/0895-6111(94)90007-8 [DOI] [PubMed] [Google Scholar]
- 16.Pinkhardt EH, Sperfeld AD, Bretschneider V, Unrath A, Ludolph AC, Kassubek J.. Is spinal epidural lipomatosis an MRI-based diagnosis with clinical implications? A retrospective analysis. Acta Neurol Scand 2008;117(6):409–14. doi: 10.1111/j.1600-0404.2007.00964.x [DOI] [PubMed] [Google Scholar]
- 17.Borre DG, Borre GE, Aude F, Palmieri GN.. Lumbosacral epidural lipomatosis: MRI grading. Eur Radiol 2003;13(7):1709–21. doi: 10.1007/s00330-002-1716-4 [DOI] [PubMed] [Google Scholar]
- 18.Quint DJ, Boulos RS, Sanders WP, Mehta BA, Patel SC, Tiel RL.. Epidural lipomatosis. Radiology 1988;169(2):485–90. doi: 10.1148/radiology.169.2.3174998 [DOI] [PubMed] [Google Scholar]
- 19.Kumar K, Nath RK, Nair CP, Tchang SP.. Symptomatic epidural lipomatosis secondary to obesity. Case report. J Neurosurg 1996;85(2):348–50. [DOI] [PubMed] [Google Scholar]
- 20.Chan JY, Chang CJ, Jeng CM, Huang SH, Liu YK, Huang JS.. Idiopathic spinal epidural lipomatosis - two cases report and review of literature. Chang Gung Med J 2009;32(6):662–7. [PubMed] [Google Scholar]
- 21.Al-Omari AA, Phukan RD, Leonard DA, Herzog TL, Wood KB, Bono CM.. Idiopathic spinal epidural lipomatosis in the lumbar spine. Orthopedics 2016;39(3):163–8. doi: 10.3928/01477447-20160315-04 [DOI] [PubMed] [Google Scholar]
- 22.Fogel GR, Cunningham PY 3rd, Esses SI.. Spinal epidural lipomatosis: case reports, literature review and meta-analysis. Spine J 2005;5(2):202–11. doi: 10.1016/j.spinee.2004.05.252 [DOI] [PubMed] [Google Scholar]
- 23.Badami JP, Hinck VC.. Symptomatic deposition of epidural fat in a morbidly obese woman. AJNR Am J Neuroradiol 1982;3(6):664–5. [PMC free article] [PubMed] [Google Scholar]
- 24.Daniel M, Doyon D, Bekkali F, Delvalle A, Francke JP.. [MRI of normal spinal epidural fat]. J Radiol 1992;73(12):695–8. [PubMed] [Google Scholar]
- 25.Daniel M, Doyon D, Bekkali F, Delvalle A, Francke JP, Husson B, et al. [MRI of the spinal epidural fat in pathology]. J Radiol 1992;73(11):595–603. [PubMed] [Google Scholar]
- 26.Reina MA, Franco CD, Lopez A, De Andres JA, van Zundert A.. Clinical implications of epidural fat in the spinal canal. A scanning electron microscopic study. Acta Anaesthesiol Belg 2009;60(1):7–17. [PubMed] [Google Scholar]


